In the world of information technology, few things are as frustrating as a sudden system crash. Whether you are a software developer, a system administrator, or a power user, encountering the infamous “Blue Screen of Death” (BSOD) on Windows or a “Kernel Panic” on macOS and Linux can disrupt productivity and signal deep-seated technical issues. However, these crashes are not merely dead ends; they are accompanied by a vital diagnostic tool known as a memory dump.
A memory dump is essentially a digital snapshot of a computer’s volatile memory (RAM) at the exact moment of a system failure or a specific triggered event. By capturing the state of the system’s processors, loaded drivers, and active processes, a memory dump provides the forensic evidence required to determine why a system failed. Understanding what a memory dump is, how it functions, and how to analyze it is fundamental to modern software debugging and digital security.
Understanding the Fundamentals of Memory Dumps
To grasp the concept of a memory dump, one must first understand the role of Random Access Memory (RAM). RAM serves as the short-term workspace for a computer, holding the data and code that the CPU needs to access quickly. Unlike a hard drive, RAM is volatile, meaning its contents are lost the moment power is cut or the system reboots.
The Snapshot of Volatile Memory
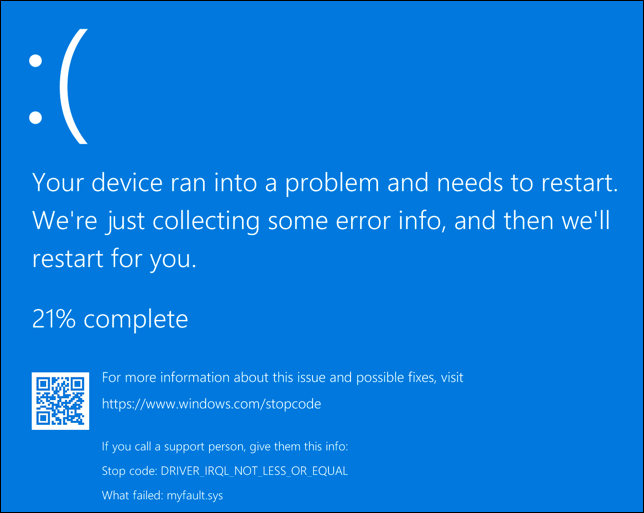
When an operating system encounters a critical error that it cannot recover from—often called a “fatal system error”—it executes a protective shutdown to prevent data corruption. Before the system goes dark, it performs a “dump” of the data currently residing in the RAM and writes it to a non-volatile storage location, typically the hard drive. This resulting file, often carrying a .dmp extension, acts as a “black box” recorder for the computer. It preserves the environment of the crash, allowing technicians to look back in time and see exactly what the CPU was processing when the failure occurred.
Why Systems Trigger a Dump
Systems do not create memory dumps without reason. The primary trigger is a kernel-mode exception that the operating system cannot handle. This could be caused by a hardware malfunction, such as a failing memory module, or a software conflict, such as a poorly written device driver attempting to access a memory address it does not have permission to use. By creating a dump, the OS ensures that the state of the error is preserved for post-mortem analysis, rather than being lost forever during the subsequent reboot.
The Different Types of Memory Dumps
Not all memory dumps are created equal. Depending on the configuration of the system and the nature of the problem, the operating system can generate several different types of dump files, varying in size and the depth of information they contain.
Complete Memory Dump
A Complete Memory Dump is the most comprehensive type available. It contains a full copy of everything that was in the physical RAM at the time of the crash. If a server has 128GB of RAM, a complete memory dump will be approximately 128GB in size. While these files are unwieldy due to their size, they are invaluable for deep-level debugging because they include the memory space of every running application, the kernel, and all loaded drivers.
Kernel Memory Dump
For most IT professionals, the Kernel Memory Dump is the “goldilocks” of diagnostic files. It ignores the memory allocated to user-mode applications and focuses exclusively on the memory used by the operating system kernel and the Hardware Abstraction Layer (HAL). Since most system crashes are caused by kernel-mode drivers, this file usually contains all the information necessary to identify the culprit while being significantly smaller than a complete dump.
Small Memory Dump (Minidump)
A Small Memory Dump, or Minidump, is a compact file (usually 64KB to 256KB) that records only the most essential information. This includes the stop error code, a list of loaded drivers, and the processor state. While minidumps lack the granular detail of a kernel dump, they are easy to share over the internet and are often sufficient for identifying a specific driver that is causing a recurring crash.
Automatic Memory Dump
Introduced in modern versions of Windows, the Automatic Memory Dump contains the same information as a Kernel Memory Dump but allows the operating system to dynamically manage the size of the page file to ensure a dump can be captured even if disk space is limited. This is the default setting for most modern systems, balancing the need for data with system efficiency.
The Role of Memory Dumps in Software Development and IT Support

Memory dumps are not just accidental byproducts of a crash; they are intentional tools used in the lifecycle of software development and high-level technical support.
Root Cause Analysis (RCA)
In enterprise environments, a single server crash can result in thousands of dollars of lost revenue per minute. Systematic Root Cause Analysis (RCA) is required to ensure the issue does not happen again. A memory dump allows system administrators to move beyond “turning it off and on again.” By analyzing the dump, they can pinpoint whether the crash was a “one-off” hardware glitch (like an alpha particle hitting a RAM chip) or a systemic software bug that requires a patch.
Post-Mortem Debugging
Software developers use memory dumps for “post-mortem debugging.” Often, a bug may occur on a user’s machine that the developer cannot replicate in their own controlled environment. By requesting the user’s dump file, the developer can load the exact state of the crashed application into their debugging environment. This allows them to inspect variable values, the call stack, and register states as if they were sitting at the user’s computer at the moment of the failure.
Identifying Memory Leaks and Hardware Failures
Memory dumps are also instrumental in detecting memory leaks. A memory leak occurs when a program fails to release RAM it no longer needs. By comparing multiple memory dumps taken over a period of time, developers can see which processes are consuming an ever-increasing amount of memory. Furthermore, dumps can reveal hardware issues; for example, if the dump consistently shows “bit-flipping” or corruption in a specific memory address, it is a clear indicator that the physical RAM stick is faulty and needs replacement.
How to Analyze and Interpret Memory Dump Files
Raw memory dump files are binary data and are unreadable by standard text editors. To make sense of them, specialized software tools and a specific methodology are required.
Essential Debugging Tools
The industry standard for analyzing Windows memory dumps is WinDbg (Windows Debugger), a powerful tool provided by Microsoft. For Linux systems, tools like GDB (GNU Debugger) and Crash are used to inspect core dumps. These tools take the raw binary data and translate it into human-readable code. To do this effectively, the debugger requires “Symbol Files” (.pdb). Symbols act as a map that links binary machine code back to the original source code, allowing the analyst to see function names and variable names instead of cryptic hexadecimal addresses.
Interpreting Stop Codes and Stack Traces
When an analyst opens a dump file, the first thing they look for is the Stop Code (e.g., 0x000000D1 or DRIVER_IRQL_NOT_LESS_OR_EQUAL). This code provides a general category for the error. The next step is examining the Stack Trace. The stack trace shows the sequence of function calls that led up to the crash. By looking at the top of the stack, the analyst can see the last command the CPU executed. If the stack trace ends in a specific driver file, such as nvlddmkm.sys, it becomes immediately clear that the Nvidia graphics driver was involved in the failure.
Security and Privacy Considerations of Memory Dumps
While memory dumps are essential for troubleshooting, they also present significant risks in the realms of digital security and data privacy.
Sensitive Data Exposure
Because a memory dump is a literal copy of RAM, it contains whatever data was being processed at the time of the crash. This can include decrypted passwords, credit card numbers, personal emails, or sensitive corporate documents. If a developer or IT company asks for a “Complete Memory Dump,” they are essentially asking for a copy of everything that was open on your computer. In a corporate or healthcare environment, sharing these files without proper sanitization can lead to severe data breaches and violations of privacy regulations like GDPR or HIPAA.
Memory Forensics in Cybersecurity
On the flip side, memory dumps are a powerful weapon for cybersecurity analysts and forensic investigators. Advanced malware, known as “fileless malware,” often resides only in the RAM to avoid detection by traditional antivirus software that scans the hard drive. By taking a memory dump of an infected machine, a security researcher can “catch” the malware in action. They can extract the malicious code from the dump, identify its command-and-control (C2) servers, and understand how it was encrypting or stealing data. Memory forensics is now a cornerstone of modern incident response.
Conclusion
The memory dump is a cornerstone of the modern technological landscape. It bridges the gap between a catastrophic system failure and a successful resolution. By capturing the fleeting state of volatile memory, these files provide the evidence necessary for developers to fix bugs, for IT professionals to stabilize infrastructure, and for security experts to thwart cyberattacks.
While the technical complexity of analyzing a dump file can be high, the existence of these snapshots ensures that technology can be refined and improved. In an era where we rely on software for every aspect of our lives, the humble memory dump remains one of our most potent tools for maintaining the stability, reliability, and security of our digital world. Whether you are avoiding a BSOD or hunting for a sophisticated hacker, the answers are almost always hidden somewhere in the dump.
aViewFromTheCave is a participant in the Amazon Services LLC Associates Program, an affiliate advertising program designed to provide a means for sites to earn advertising fees by advertising and linking to Amazon.com. Amazon, the Amazon logo, AmazonSupply, and the AmazonSupply logo are trademarks of Amazon.com, Inc. or its affiliates. As an Amazon Associate we earn affiliate commissions from qualifying purchases.