
In the intricate world of business finance, few metrics are as fundamental and revealing as the gross profit margin. Often considered the first line of defense in assessing a company’s profitability, it offers a succinct yet powerful snapshot of how efficiently a business is turning its core sales into actual profit before operating expenses even enter the picture. For entrepreneurs, investors, and finance professionals alike, understanding this key indicator is not just beneficial—it’s absolutely essential for making informed decisions, strategizing for growth, and ensuring long-term financial health.
At its core, the gross profit margin tells a story: the story of how much money a company makes from each dollar of sales after accounting for the direct costs associated with producing or acquiring the goods or services it sells. It acts as a critical barometer for a company’s operational efficiency, pricing strategy, and cost management in its primary revenue-generating activities. Ignoring this vital metric is akin to navigating a ship without a compass; while you might move forward, your direction and ultimate destination remain perilously uncertain. This article will demystify the gross profit margin, breaking down its components, illustrating its calculation, exploring its significance, and outlining strategies to optimize it for sustained success.
Understanding the Fundamentals of Gross Profit Margin
To truly grasp the significance of gross profit margin, one must first appreciate its constituent parts and the foundational role they play in revealing a company’s financial health. It’s not merely a number; it’s a ratio that speaks volumes about a business’s core operational effectiveness.
Defining Gross Profit
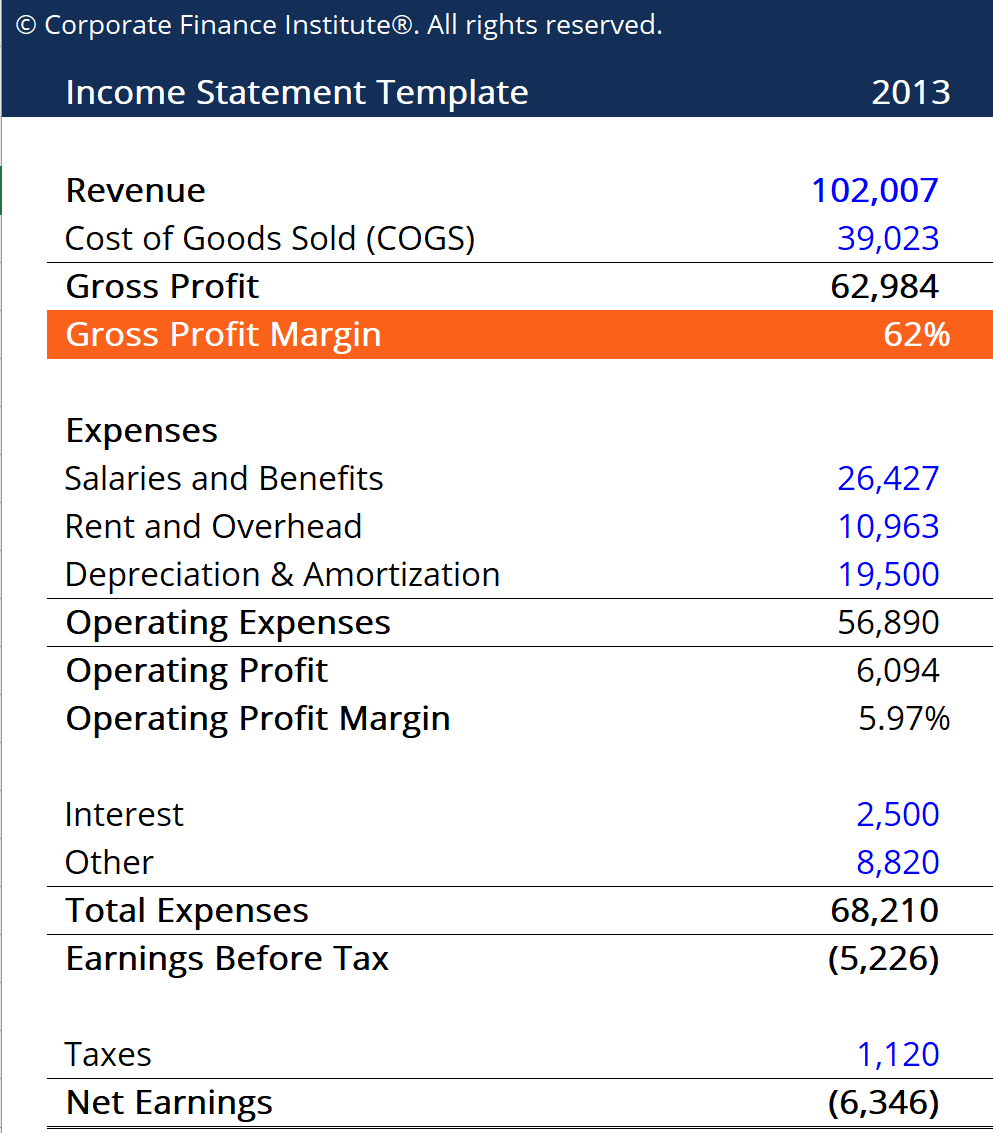
Before we can calculate a margin, we must first understand “gross profit.” Gross profit is the revenue a company retains after subtracting the direct costs associated with producing the goods or services it sells. It represents the profit a company makes from its sales before considering indirect expenses such like administrative costs, marketing, research and development, interest, or taxes. Think of it as the money left over to cover all other business costs and contribute to net profit.
The formula for gross profit is straightforward:
Gross Profit = Net Sales Revenue – Cost of Goods Sold (COGS)
Here, “Net Sales Revenue” refers to the total revenue generated from sales, minus any returns, discounts, or allowances. “Cost of Goods Sold (COGS)” includes all direct costs attributable to the production of the goods or services sold by a company. This can encompass the cost of raw materials, direct labor, and manufacturing overhead directly tied to production.
The Formula for Gross Profit Margin
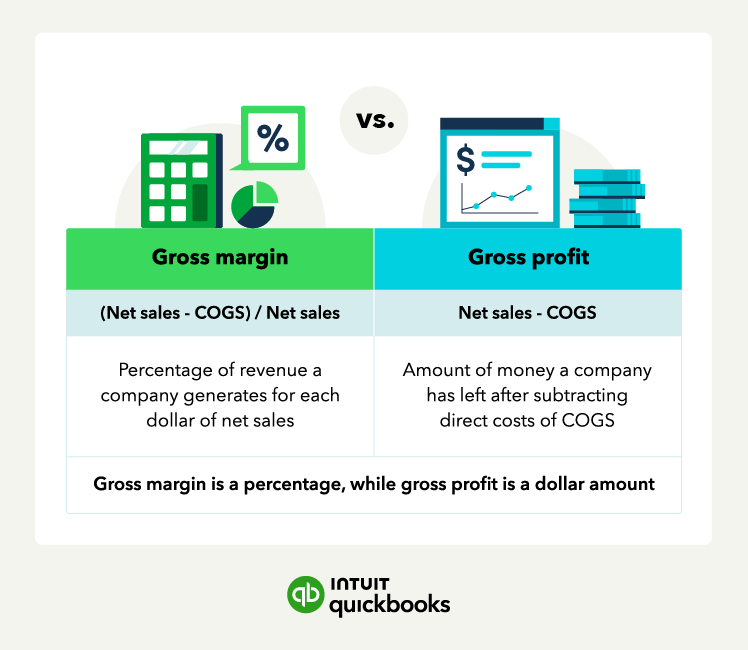
Once gross profit is determined, calculating the gross profit margin is the next logical step. The margin expresses gross profit as a percentage of net sales revenue, providing a standardized way to compare profitability regardless of the scale of operations.
The formula for gross profit margin is:
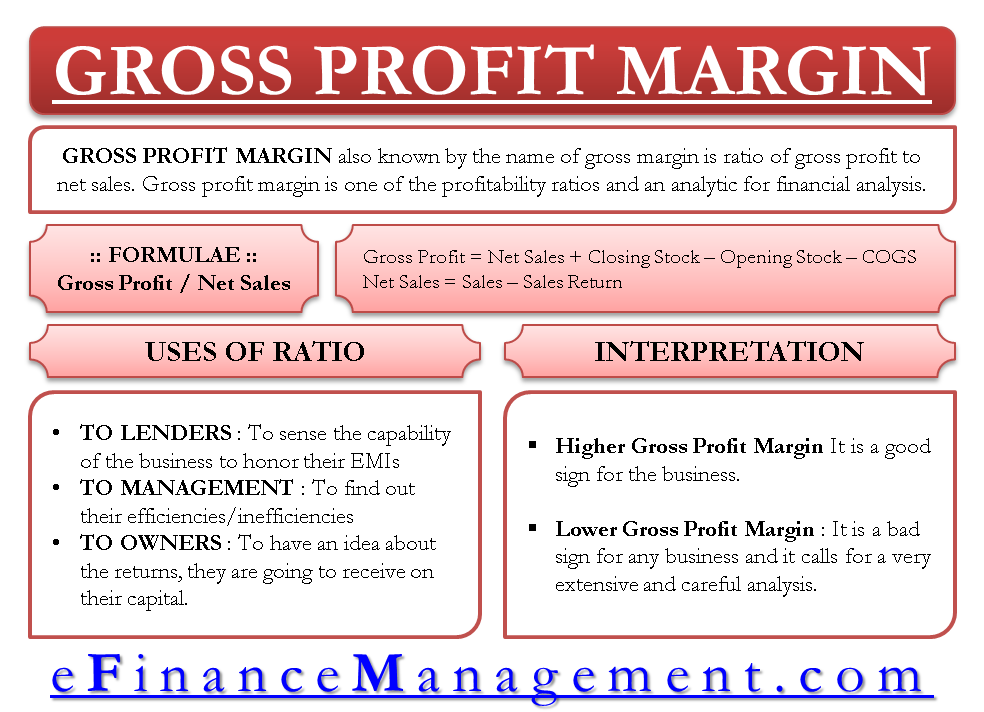
Gross Profit Margin = (Gross Profit / Net Sales Revenue) x 100%
For example, if a company has net sales revenue of $1,000,000 and its cost of goods sold is $600,000, its gross profit would be $400,000. Applying the margin formula: ($400,000 / $1,000,000) x 100% = 40%. This means that for every dollar of sales, the company retains 40 cents after covering the direct costs of production.
Why Gross Profit Margin Matters
The importance of gross profit margin cannot be overstated. It is a vital indicator for several reasons:
-
Operational Efficiency: A healthy gross profit margin suggests that a company is efficiently managing its production costs and has an effective pricing strategy. A declining margin, conversely, can signal issues with cost control, competitive pricing pressures, or a shift in product mix.
-
Pricing Strategy Validation: It helps businesses evaluate whether their pricing is set appropriately to cover production costs and contribute sufficiently to overall profitability. If the margin is too low, it might indicate that prices are too low or production costs are too high.
-
Covering Operating Expenses: The gross profit is what’s left to pay for all other operating expenses (salaries, rent, marketing, R&D). A strong gross profit margin ensures there’s ample room to cover these overheads and still generate a net profit. If the margin is thin, even with high sales, the business might struggle to achieve overall profitability.
-
Comparability: As a percentage, it allows for easy comparison between different companies in the same industry, regardless of their size, and provides insights into industry-wide profitability trends. It also enables tracking a company’s performance over different periods.
Delving Deeper into Components: Revenue and Cost of Goods Sold (COGS)
To effectively manage and improve gross profit margin, a granular understanding of its two primary components—net sales revenue and Cost of Goods Sold (COGS)—is absolutely critical. Each element presents distinct opportunities and challenges that, when properly addressed, can significantly impact a company’s profitability.
The Role of Net Sales (Revenue)
Net sales revenue is the starting point for profitability calculations. It represents the total income generated from selling goods or services, adjusted for any deductions. These deductions typically include:
-
Sales Returns: Money refunded to customers for returned merchandise.
-
Sales Allowances: Reductions in price given to customers for damaged or defective goods, rather than a full return.
-
Sales Discounts: Price reductions offered to customers for early payment of invoices.
Understanding net sales is crucial because simply increasing gross sales doesn’t always translate to higher net sales or better profitability if returns or discounts are disproportionately high. Businesses must focus on not just generating sales, but quality sales that stick and require minimal adjustments. Strategies to optimize net sales include effective marketing, competitive pricing, excellent customer service to reduce returns, and clear sales terms.
Identifying and Calculating Cost of Goods Sold (COGS)
COGS is perhaps the most critical and often complex component to manage. It includes all direct costs involved in producing the goods that a company sells, or for a retailer, the direct cost of acquiring the inventory it sells. For a manufacturing company, COGS typically encompasses:
-
Direct Materials: The raw materials that directly go into the product.
-
Direct Labor: The wages paid to employees directly involved in the manufacturing process.
-
Manufacturing Overhead: Costs directly related to the production facility but not directly tied to individual units, such as factory rent, utilities, depreciation of production equipment, and indirect labor (e.g., factory supervisors).
For a retail or wholesale business, COGS is primarily the purchase price of the inventory plus any costs incurred to bring that inventory to a saleable condition, such as freight-in.
The calculation of COGS for a period often follows this formula:
COGS = Beginning Inventory + Purchases (or Cost of Goods Manufactured) – Ending Inventory
Accurate COGS calculation is paramount. Overstating COGS will artificially lower gross profit and margin, while understating it will inflate profitability figures, leading to potentially misguided business decisions.
Common Pitfalls in COGS Calculation
Miscalculating COGS is a frequent issue that can severely distort a company’s financial picture. Common pitfalls include:
-
Incorrect Inventory Valuation: Using an inappropriate inventory valuation method (e.g., FIFO, LIFO, weighted-average) or failing to accurately count inventory can lead to errors.
-
Improper Inclusion/Exclusion of Costs: Incorrectly classifying certain costs as direct or indirect. For instance, including administrative salaries (which are operating expenses) in COGS, or excluding essential direct manufacturing overhead, can skew the numbers.
-
Treatment of Spoilage and Waste: How spoiled or wasted materials are accounted for can impact COGS. Normal spoilage is often included, while abnormal spoilage might be expensed separately.
-
Overlooking Freight-In: For retailers, the cost of shipping inventory to their premises (freight-in) is part of COGS, but it’s sometimes overlooked or misclassified.
Diligent tracking, robust accounting systems, and regular reconciliation are essential to ensure the accuracy of COGS, thereby providing a reliable foundation for gross profit margin analysis.
Interpreting and Utilizing Gross Profit Margin
Calculating the gross profit margin is just the first step. The real value lies in its interpretation and strategic application. A percentage on its own means little; its power comes from comparison, trend analysis, and its implication for various business functions.
Benchmarking Against Industry Standards
One of the most powerful uses of gross profit margin is benchmarking. Comparing your company’s gross profit margin against industry averages provides crucial context. Is your margin higher or lower than that of your competitors?
-
Higher Margin: A higher-than-average margin suggests that your company might have a competitive advantage, perhaps due to superior efficiency in production, stronger brand perception allowing for premium pricing, or a unique product offering. It could also indicate a more favorable cost structure for materials or labor.
-
Lower Margin: A lower-than-average margin could signal several issues: aggressive pricing to gain market share, inefficiencies in your production process, higher supplier costs, or a lack of differentiation in a competitive market. It serves as a red flag, prompting deeper investigation into pricing strategies, supplier negotiations, and operational workflows.
Industry benchmarks are typically available through financial reports, industry associations, or market research firms. It’s important to compare within your specific sub-industry, as “retail” or “manufacturing” are too broad; a luxury car manufacturer will have a vastly different margin profile than an economy car manufacturer, for example.
Tracking Trends Over Time
Beyond static comparisons, tracking your company’s gross profit margin over time (quarter-over-quarter, year-over-year) offers invaluable insights into its performance trajectory.
-
Consistent or Increasing Margin: A stable or upward trend in gross profit margin is generally a positive sign, indicating that the company is effectively managing its direct costs relative to its sales revenue. This could be due to successful cost-reduction initiatives, increased sales volume driving economies of scale, or effective price increases.
-
Declining Margin: A downward trend demands immediate attention. It suggests that direct costs are growing faster than sales revenue, or that pricing power is eroding. Potential causes include rising raw material costs, increasing labor expenses, fierce competition leading to price cuts, or a shift towards selling lower-margin products. Identifying the root cause is critical for developing targeted corrective actions.
Trend analysis helps identify seasonal variations, the impact of economic cycles, and the long-term effectiveness of management strategies.
The Link to Pricing Strategies and Operational Efficiency
Gross profit margin is inextricably linked to both pricing strategies and operational efficiency:
-
Pricing Strategy: A company’s pricing directly impacts its net sales revenue. If prices are too low, even with high sales volume, the gross profit margin can suffer. Conversely, prices that are too high might deter customers, leading to lower sales volume, which can also hurt total gross profit. The margin helps determine if current pricing adequately covers COGS and contributes sufficiently to overall profitability goals. It informs decisions about price adjustments, promotional strategies, and value-based pricing.
-
Operational Efficiency: This metric is a direct reflection of how efficiently a company produces its goods or services. Improvements in operational efficiency—such as optimizing the supply chain to reduce material costs, streamlining manufacturing processes to lower labor and overhead, or negotiating better terms with suppliers—will directly translate into a higher gross profit margin. Conversely, inefficiencies will erode the margin. Therefore, the gross profit margin serves as a key performance indicator (KPI) for production managers and supply chain officers.
By continuously analyzing gross profit margin in relation to these factors, businesses can make data-driven decisions that enhance both top-line revenue and bottom-line profitability.
Strategies to Improve Your Gross Profit Margin
For any business aiming for sustainable growth and enhanced profitability, actively working to improve the gross profit margin is a continuous and crucial endeavor. The strategies typically fall into two main categories: increasing revenue and decreasing Cost of Goods Sold (COGS).
Optimizing Pricing and Sales Volume
Adjusting pricing and managing sales volume are powerful levers that directly impact net sales revenue, and consequently, gross profit margin.
-
Strategic Price Adjustments: This doesn’t always mean raising prices. It involves understanding market elasticity, competitor pricing, and perceived customer value.
-
Value-Based Pricing: If your product offers unique features or superior quality, you might justify a premium price, thereby increasing the revenue per unit without a proportional increase in COGS.
-
Tiered Pricing: Offering different product versions at varying price points can capture different customer segments, maximizing overall revenue.
-
Dynamic Pricing: Adjusting prices in real-time based on demand, inventory levels, or competitor actions can optimize revenue for perishable goods or services.
-
-
Upselling and Cross-selling: Encouraging customers to purchase higher-value products (upselling) or complementary items (cross-selling) can increase the average transaction value, boosting overall sales revenue without necessarily increasing the COGS per base unit.
-
Targeted Promotions: Instead of broad discounts, implement targeted promotions that aim to clear slow-moving inventory or incentivize the purchase of higher-margin items, carefully balancing increased sales volume against margin erosion.
Reducing Cost of Goods Sold
This is often the most direct path to improving gross profit margin. Every dollar saved in COGS translates directly to an additional dollar of gross profit.
-
Supplier Negotiations: Regularly review and renegotiate terms with suppliers. Seeking multiple bids, committing to larger volumes, or exploring new suppliers can lead to better pricing on raw materials or inventory.
-
Process Optimization and Automation: For manufacturers, streamlining production processes, adopting lean manufacturing principles, and automating repetitive tasks can reduce direct labor costs and manufacturing overhead.
-
Material Substitution: Exploring alternative, lower-cost raw materials that do not compromise product quality can significantly reduce material costs.
-
Waste Reduction: Minimizing waste in production, whether it’s raw materials, energy, or labor time, directly lowers COGS. Implementing quality control measures can also reduce the cost of defective products.
-
Economies of Scale: As production volume increases, the fixed components of COGS (like certain manufacturing overheads) are spread over more units, reducing the per-unit COGS.
Managing Inventory Effectively
Inventory management plays a crucial role in COGS and, by extension, gross profit margin.
-
Just-in-Time (JIT) Inventory: For suitable businesses, adopting JIT principles can minimize inventory holding costs, reduce the risk of obsolescence, and free up capital, thereby reducing indirect costs that can indirectly impact the ability to invest in COGS improvements.
-
Inventory Turnover Optimization: Efficient inventory management ensures that capital isn’t tied up in slow-moving stock, allowing for more flexible purchasing and better negotiation power with suppliers.
-
Reducing Shrinkage: Minimizing losses due to theft, damage, or obsolescence prevents unnecessary additions to COGS.
Enhancing Product Value and Differentiation
Sometimes, rather than just cutting costs, enhancing the perceived value of your product or service can justify a higher selling price, leading to a better margin.
-
Innovation and Unique Features: Developing unique product features or innovative solutions that competitors cannot easily replicate allows for premium pricing.
-
Brand Building: A strong brand can command higher prices due to perceived quality, reliability, or status, even if the underlying COGS is similar to competitors.
-
Superior Customer Service: Excellent post-sale support or warranty services can add value, justifying a higher price point and enhancing customer loyalty.
Implementing these strategies requires careful analysis, consistent monitoring, and a willingness to adapt. A holistic approach, combining efforts to boost revenue and cut costs, offers the most robust path to sustainable gross profit margin improvement.
Gross Profit Margin vs. Other Profitability Metrics
While gross profit margin is a foundational indicator, it’s crucial to understand that it’s just one piece of the financial puzzle. To gain a truly comprehensive view of a company’s financial health and profitability, it must be considered alongside other critical profitability metrics. Each metric tells a different part of the story, revealing insights at various stages of a company’s income statement.
Gross vs. Operating Profit Margin
-
Gross Profit Margin (GPM): As we’ve extensively discussed, GPM focuses solely on the profitability of a company’s core product or service sales after accounting for direct production costs (COGS). It measures efficiency at the production level.
-
Operating Profit Margin (OPM): Operating profit margin takes a broader view. It measures the percentage of revenue left after deducting not only COGS but also all operating expenses (SG&A – Selling, General, and Administrative expenses). These expenses include salaries for administrative staff, rent, utilities for offices, marketing costs, research and development, and depreciation/amortization not directly tied to production.
The formula for Operating Profit Margin is:
Operating Profit Margin = (Operating Income / Net Sales Revenue) x 100%
Where Operating Income = Gross Profit – Operating Expenses.
Why the Distinction Matters: A high gross profit margin but a low operating profit margin suggests that while the company is efficient at making or acquiring its products, it’s struggling with its overheads and indirect costs. This could point to excessive marketing spend, high administrative salaries, or inefficient general operations. Conversely, a modest gross margin might be offset by very lean operating expenses, leading to a respectable operating margin. This distinction helps pinpoint where profitability issues lie – at the production level or in the broader operational management.
Gross vs. Net Profit Margin
-
Gross Profit Margin (GPM): Still focused on direct profitability from sales.
-
Net Profit Margin (NPM): Net profit margin is the ultimate measure of a company’s profitability. It represents the percentage of revenue left after all expenses, including COGS, operating expenses, interest expenses, and taxes, have been deducted. It tells you how much profit a company makes for every dollar of revenue after every single cost has been accounted for.
The formula for Net Profit Margin is:
Net Profit Margin = (Net Income / Net Sales Revenue) x 100%
Where Net Income = Operating Income – Interest Expense – Taxes.
Why the Distinction Matters: A strong gross profit margin is excellent, and a good operating profit margin is even better, but a low net profit margin can indicate problems with financial structure (high interest payments) or tax efficiency. For instance, a company could have strong gross and operating margins, but if it carries a heavy debt load (leading to high interest expenses) or faces a high effective tax rate, its net profit margin could be significantly lower. Net profit margin is what ultimately impacts shareholder returns and retained earnings for reinvestment.
The Holistic View of Business Health
Understanding the relationship between these three margins provides a layered perspective on a company’s financial health:
-
Gross Profit Margin assesses the efficiency of core production/procurement.
-
Operating Profit Margin assesses the efficiency of overall business operations.
-
Net Profit Margin assesses the efficiency of the entire business model, including financing and tax management.
By analyzing how these margins compare to each other, to industry benchmarks, and to their own historical trends, stakeholders can identify specific areas of strength and weakness. A consistent analysis of these metrics together provides a robust framework for financial decision-making, strategic planning, and performance evaluation, moving beyond a single number to reveal the full financial narrative of a business.
aViewFromTheCave is a participant in the Amazon Services LLC Associates Program, an affiliate advertising program designed to provide a means for sites to earn advertising fees by advertising and linking to Amazon.com. Amazon, the Amazon logo, AmazonSupply, and the AmazonSupply logo are trademarks of Amazon.com, Inc. or its affiliates. As an Amazon Associate we earn affiliate commissions from qualifying purchases.