In the rapidly evolving landscape of software development, the ability to deliver value quickly and reliably is the ultimate competitive advantage. For years, engineering leaders struggled to quantify “productivity.” Traditional metrics, such as lines of code written or the number of bugs fixed, often provided a skewed or even counterproductive view of a team’s health. Enter DORA metrics—the gold standard for measuring software delivery performance.
Developed by the DevOps Research and Assessment (DORA) team, these metrics are the result of over seven years of rigorous research and data collection from thousands of organizations worldwide. By focusing on outcomes rather than mere activity, DORA metrics provide a data-driven framework for understanding what makes a high-performing technology organization. This guide explores the intricacies of DORA metrics, how they are calculated, and how they can transform your engineering culture.
Understanding the Foundation of DORA Metrics
Before diving into the specific indicators, it is essential to understand where DORA metrics originated and why they have become the industry benchmark. The DORA group was founded by Dr. Nicole Forsgren, Jez Humble, and Gene Kim—pioneers in the DevOps movement. Their goal was to apply behavioral science and statistical analysis to determine which practices truly drive software delivery excellence.
The Origins: From the State of DevOps Report to Google Cloud
The research culminated in the annual “State of DevOps Report,” which categorized organizations into four clusters: Low, Medium, High, and Elite performers. In 2018, Google Cloud acquired DORA, integrating these insights into its broader ecosystem of cloud services and organizational transformation tools. The core philosophy of DORA is that software delivery performance is a leading indicator of overall business performance, including profitability, market share, and customer satisfaction.
Why Metrics Matter in the Modern Software Lifecycle
In the era of microservices, cloud-native infrastructure, and continuous integration/continuous deployment (CI/CD), software systems have become incredibly complex. Without a standardized way to measure throughput and stability, organizations often fall into the trap of “gut-feeling” management. DORA metrics remove the ambiguity by providing a common language for developers, operations, and business stakeholders. They shift the focus from “How many hours did the team work?” to “How effectively are we delivering value to the user?”
The Four Pillars: Breaking Down the DORA Metrics
DORA metrics are divided into two categories: Velocity (Speed) and Stability (Quality). A common misconception in software engineering is that speed and quality are a zero-sum game—that you must sacrifice one for the other. The DORA research proves the opposite: High-performing teams excel at both simultaneously.
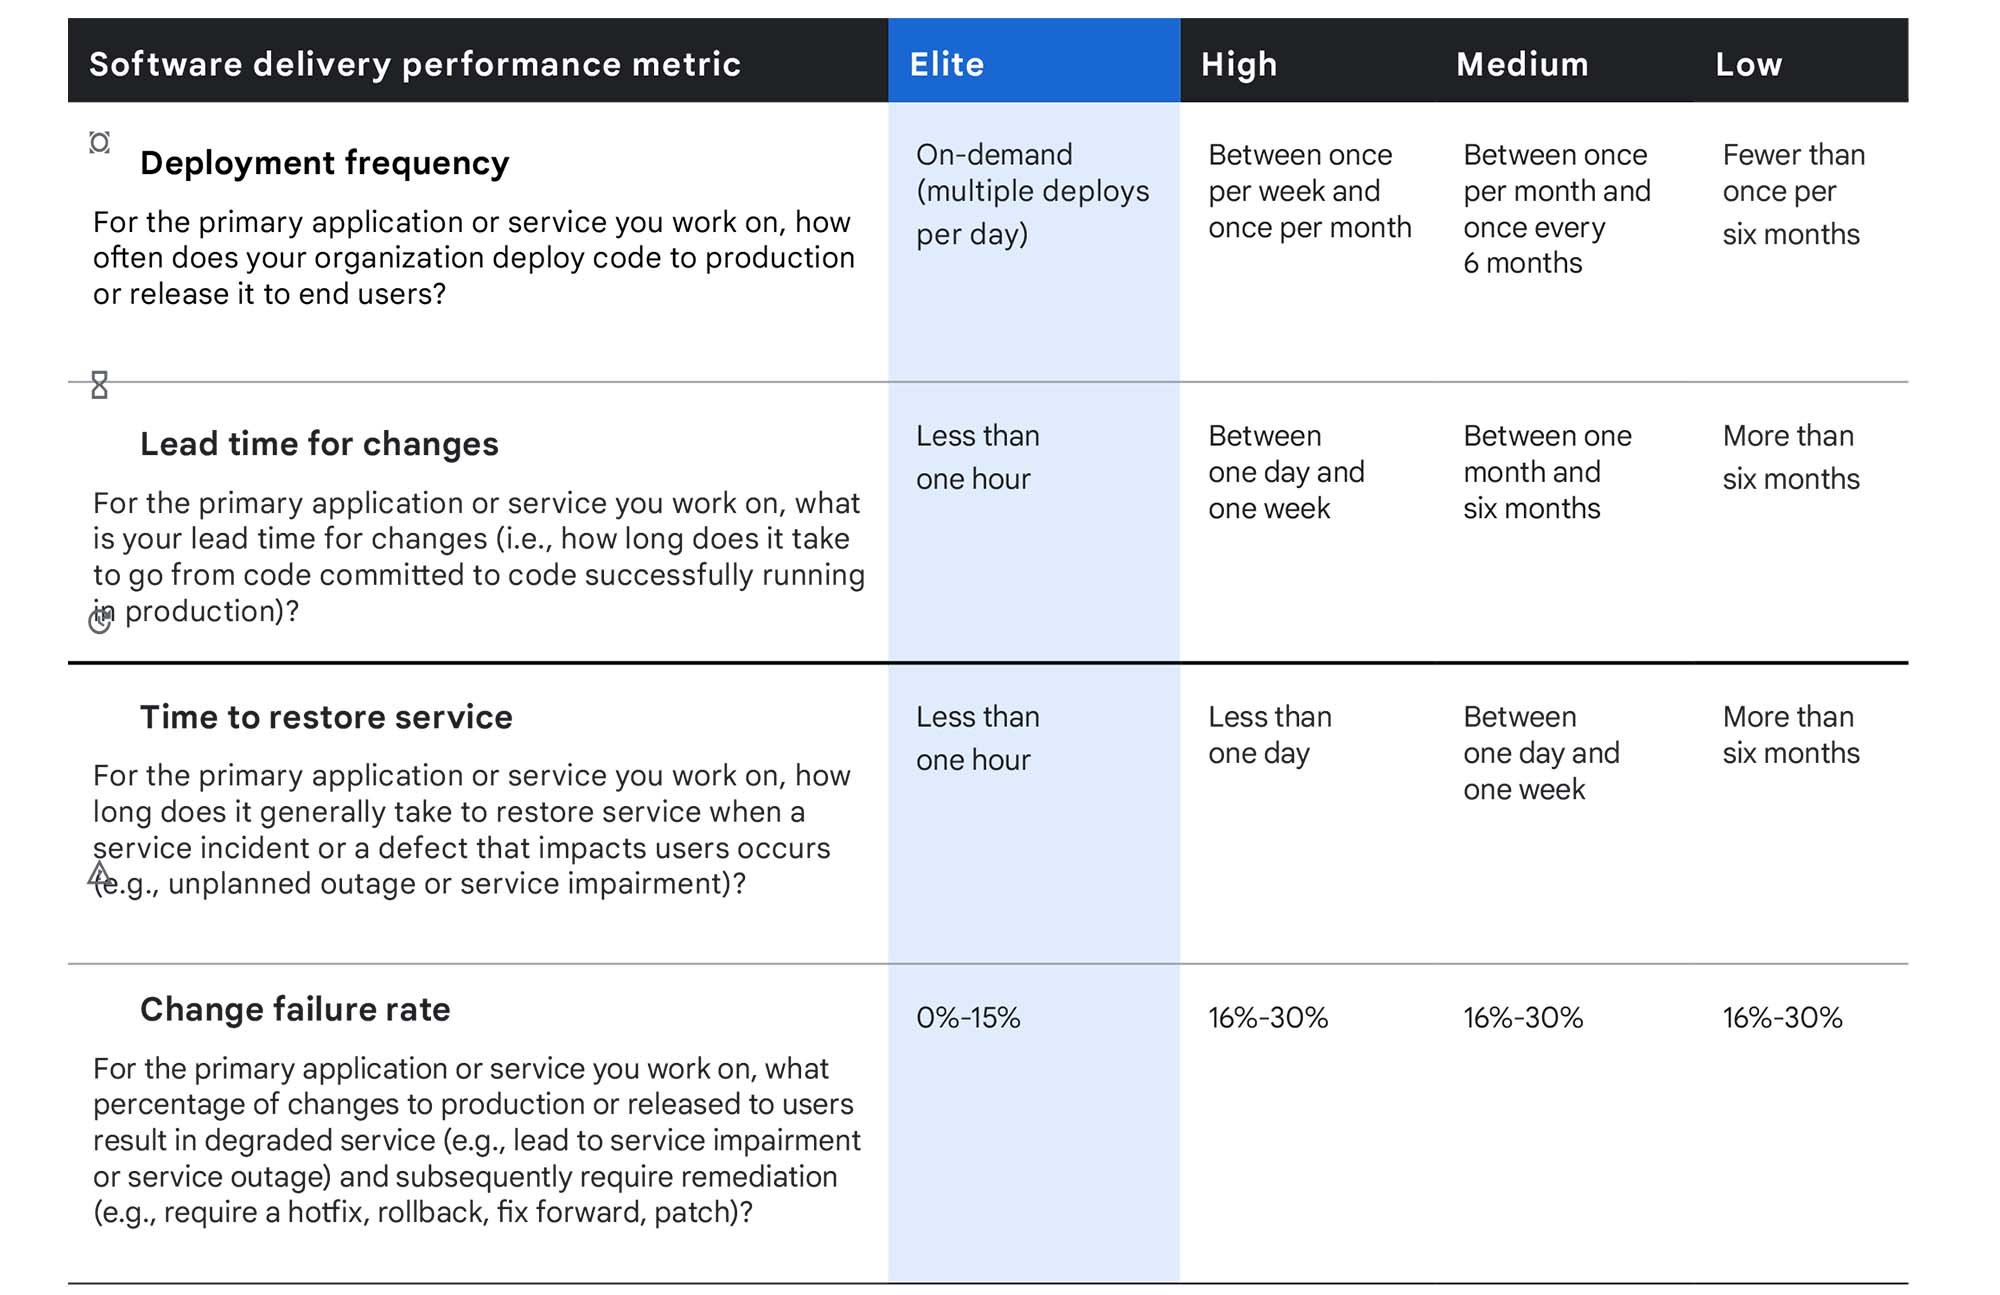
Deployment Frequency (DF) – Measuring Velocity
Deployment Frequency measures how often an organization successfully releases code to production. This is the primary indicator of team “throughput.”
- What it tracks: The cadence of deployments (e.g., daily, weekly, monthly).
- Why it matters: High deployment frequency indicates a mature CI/CD pipeline and a culture of small, manageable changes. Smaller changes are easier to test, easier to deploy, and significantly easier to roll back if something goes wrong.
Lead Time for Changes (LTTC) – Measuring Efficiency
Lead Time for Changes measures the amount of time it takes for a single commit to go from being “code complete” to running in production.
- What it tracks: The efficiency of the development process, including code reviews, automated testing, and the deployment pipeline.
- Why it matters: A short lead time allows teams to respond to market changes and user feedback rapidly. If it takes six months for a feature to reach a user, the market demand may have already shifted. Elite teams aim for a lead time of less than one day.
Change Failure Rate (CFR) – Measuring Quality
Change Failure Rate is the percentage of deployments that result in a failure in production, requiring a hotfix, roll-back, or patch.
- What it tracks: The reliability of the release process and the effectiveness of the testing environment.
- Why it matters: While Deployment Frequency measures how fast you move, CFR measures how often you stumble. A high CFR suggests that the team is prioritizing speed over quality, leading to technical debt and customer dissatisfaction.
Failed Deployment Recovery Time – Measuring Resilience
Formerly referred to as Mean Time to Recovery (MTTR), this metric measures how long it takes an organization to recover from a failure in production (e.g., a service outage or a critical bug).
- What it tracks: Observability, incident response efficiency, and the robustness of the infrastructure.
- Why it matters: Failures are inevitable in complex systems. The mark of a high-performing team is not the total absence of failure, but the ability to detect and resolve it almost instantly. In the modern tech world, downtime is expensive, making this a critical financial and operational metric.
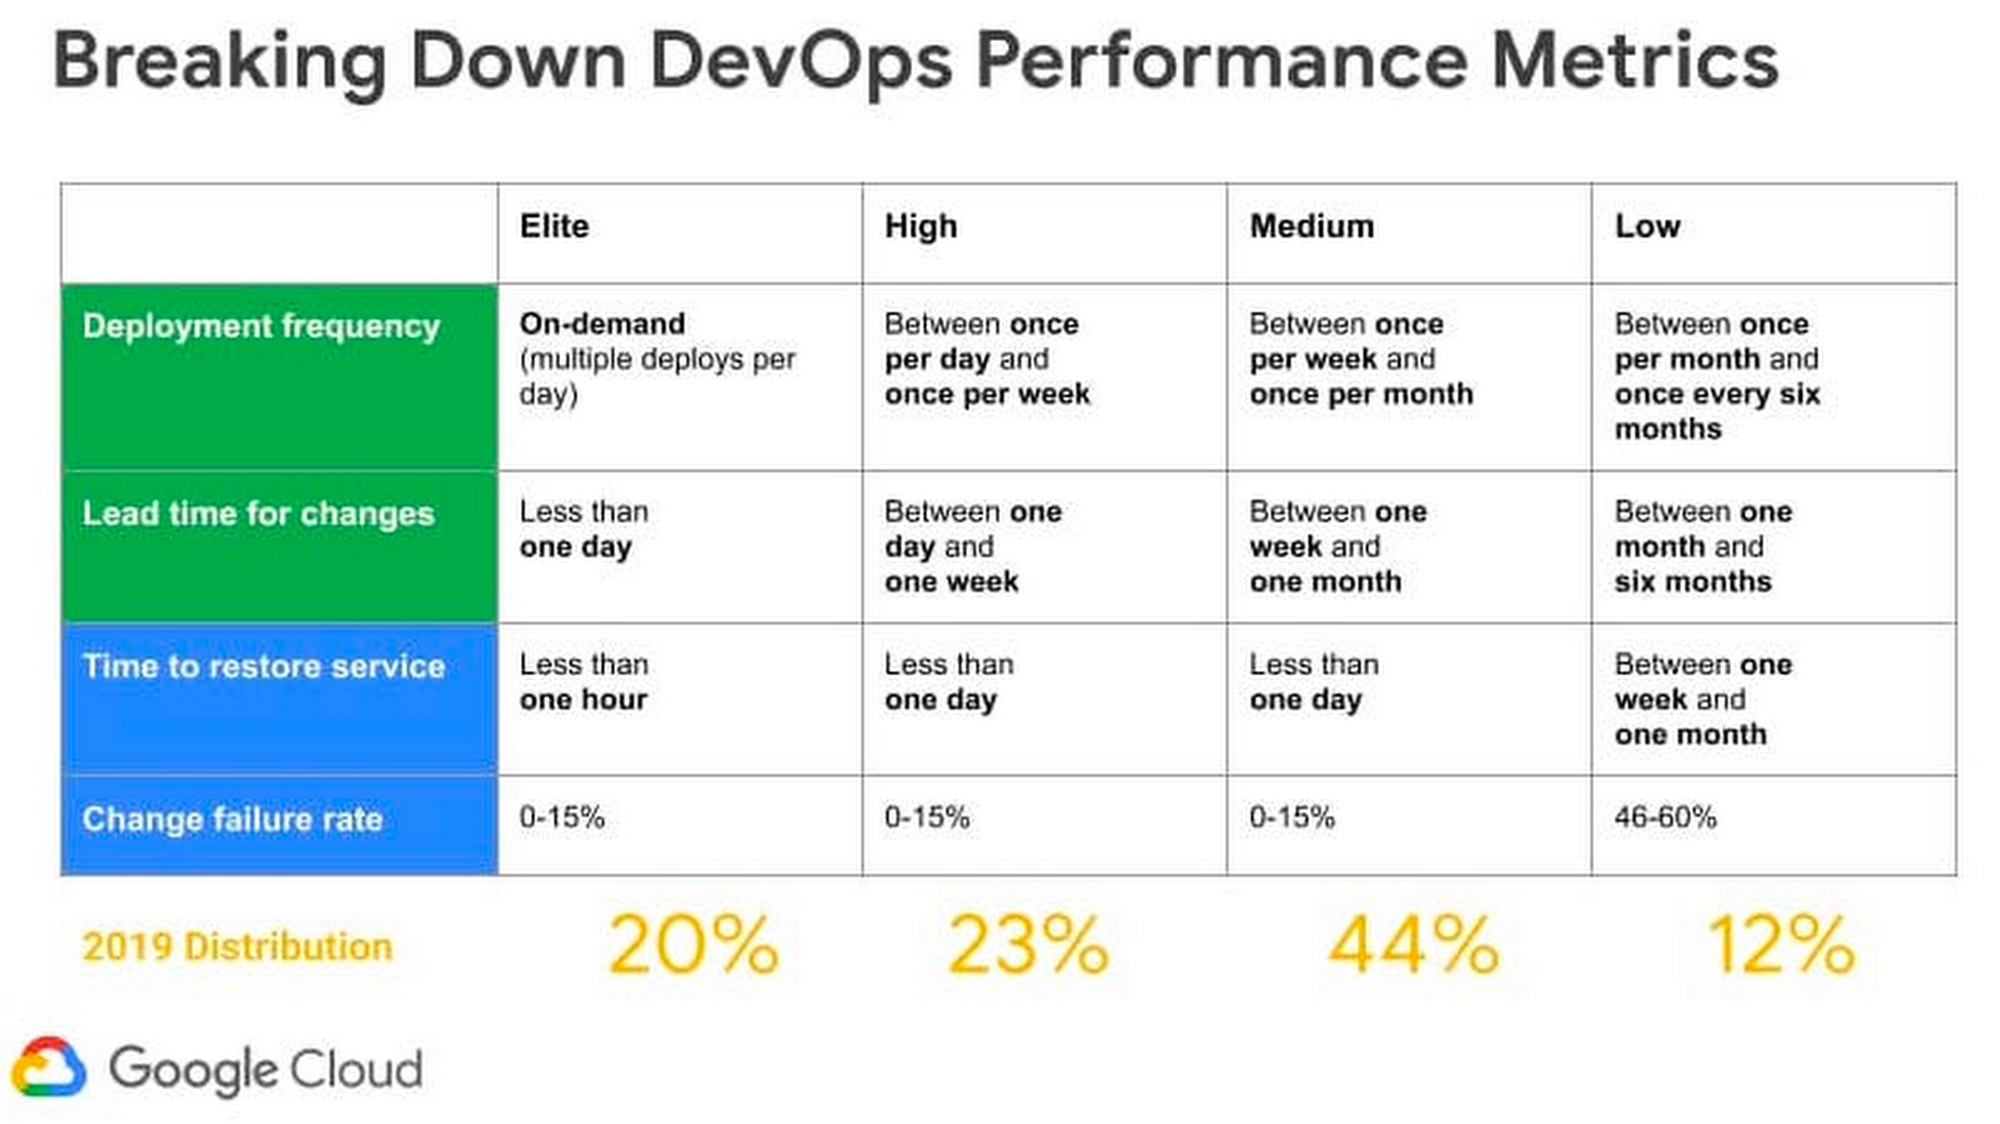
Categorizing Performance: From Low to Elite

One of the most valuable aspects of the DORA framework is the ability to benchmark your organization against industry standards. DORA research categorizes teams based on their performance across the four metrics.
Benchmarking Your Engineering Team
By analyzing the data, DORA provides a roadmap for improvement. For instance, a “Medium” performer might deploy once a week or once a month, with a lead time between one week and one month. Meanwhile, an “Elite” performer deploys multiple times per day and has a lead time of less than one hour. This benchmarking allows leadership to set realistic goals and justify investments in automation and infrastructure.
The “Elite Performer” Profile
Elite performers are the “unicorns” of the tech industry. They have mastered the art of balancing speed and stability. According to the research, Elite performers have:
- 208 times more frequent code deployments than low performers.
- 106 times faster lead time from commit to deploy.
- 2,604 times faster time to recover from incidents.
- 7 times lower change failure rate.
These statistics highlight the massive performance gap between those who embrace modern DevOps practices and those who stick to traditional, siloed methodologies.
How to Implement DORA Metrics in Your Organization
Implementing DORA metrics is not just about installing a dashboard; it requires a shift in technical practices and cultural mindset.
Data Collection and Automation Tools
To measure DORA metrics accurately, you need data from across your entire software delivery lifecycle (SDLC).
- Version Control (GitHub/GitLab): Provides data for Lead Time for Changes.
- CI/CD Pipelines (Jenkins, CircleCI, GitHub Actions): Provides data for Deployment Frequency and Change Failure Rate.
- Incident Management (PagerDuty, Opsgenie): Provides data for Recovery Time.
Modern tools like Google Cloud’s “Four Keys” project or specialized platforms like Sleuth or LinearB can automate the collection and visualization of this data, providing real-time dashboards for engineering teams.
Avoiding the Pitfalls of Misinterpretation
While DORA metrics are powerful, they can be misused.
- Don’t Weaponize Metrics: If developers feel that Deployment Frequency is being used to judge their individual performance, they may start making tiny, meaningless commits just to “pump up the numbers.”
- Context Matters: A team working on a legacy mainframe system will naturally have different metrics than a team building a greenfield serverless application. Use DORA metrics for internal improvement (tracking trends over time) rather than comparing disparate teams.
- Focus on Bottlenecks: Use the metrics to identify where the process is breaking down. If your Lead Time is high but your Deployment Frequency is also high, your bottleneck might be in the code review or QA stage.
The Future of DevOps Metrics and Value Stream Management
As the tech industry matures, DORA metrics are evolving into part of a larger ecosystem called Value Stream Management (VSM). While DORA focuses on the delivery of software, VSM looks at the entire flow of value from the initial customer request to the final delivery.
Beyond DORA: The SPACE Framework
Recently, some of the original DORA researchers introduced the SPACE framework (Satisfaction, Performance, Activity, Communication, Efficiency). While DORA is excellent for measuring technical delivery, SPACE adds a human element, acknowledging that developer well-being and collaboration are essential for long-term sustainability. Combining DORA’s technical precision with SPACE’s holistic approach provides the most complete picture of engineering health.
Integrating AI and Predictive Analytics into Performance Tracking
The next frontier for DORA metrics is the integration of Artificial Intelligence. AI can analyze historical DORA data to predict potential failures before they happen. For example, if an AI model detects that a specific type of code change has a historically high Change Failure Rate, it can trigger additional automated testing or flag the pull request for a more rigorous manual review. This proactive approach moves metrics from a retrospective reporting tool to a predictive operational asset.
In conclusion, DORA metrics are far more than just four data points. They are a philosophy of continuous improvement. By focusing on Deployment Frequency, Lead Time for Changes, Change Failure Rate, and Recovery Time, organizations can move away from guesswork and toward a disciplined, scientific approach to software engineering. Whether you are a startup looking to scale or an enterprise undergoing a digital transformation, DORA metrics provide the compass you need to navigate the complexities of the modern tech landscape.
aViewFromTheCave is a participant in the Amazon Services LLC Associates Program, an affiliate advertising program designed to provide a means for sites to earn advertising fees by advertising and linking to Amazon.com. Amazon, the Amazon logo, AmazonSupply, and the AmazonSupply logo are trademarks of Amazon.com, Inc. or its affiliates. As an Amazon Associate we earn affiliate commissions from qualifying purchases.