
In the realm of personal finance and professional investing, data is the currency of informed decision-making. Whether you are analyzing stock market fluctuations, evaluating the profitability of a side hustle, or simply trying to understand the housing market, you are constantly interacting with statistical concepts. At the heart of this data analysis lies “central tendency.” In mathematics, central tendency refers to a single value that attempts to describe a set of data by identifying the central position within that set.
For the modern investor and business owner, mastering central tendency is not just an academic exercise; it is a critical skill for cutting through the noise of raw numbers to find the underlying truth of a financial situation. By understanding the mean, median, and mode, you can better interpret economic reports, assess investment risks, and optimize your path toward financial independence.
The Three Pillars of Financial Data Analysis
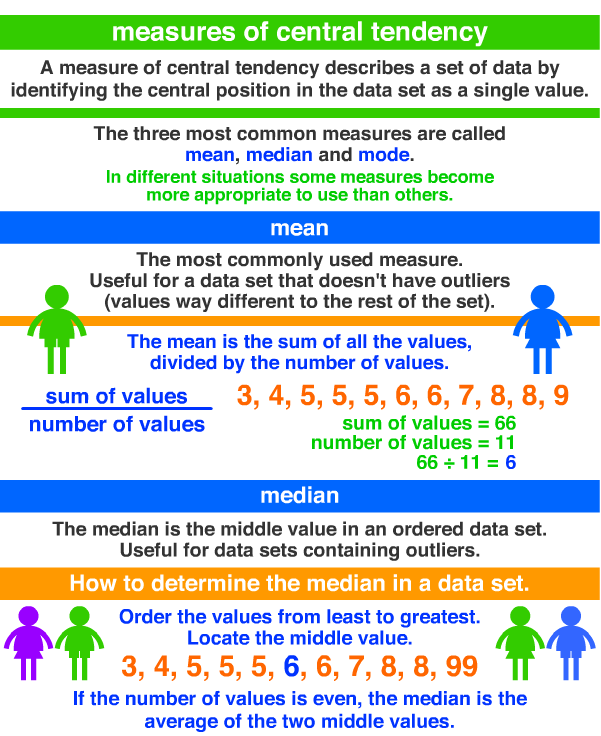
To understand central tendency in a financial context, we must break it down into its three primary measures: the mean, the median, and the mode. Each provides a different perspective on “average” and serves a unique purpose in financial planning and market analysis.
The Arithmetic Mean: Calculating Your Average Returns
The mean is the most common measure of central tendency. It is calculated by adding all the values in a data set and dividing the sum by the number of values. In the world of money, the mean is ubiquitous. If you are looking at the average annual return of the S&P 500 over the last 30 years, you are looking at a mean.
The mean is particularly useful when you want to understand the overall performance of an asset over time. For example, if a dividend-growth stock returns 5%, 7%, and 9% over three years, the mean return is 7%. This gives a clear, aggregated view of the investment’s trajectory. However, the mean is highly sensitive to “outliers”—extreme values that can pull the average in one direction or another. In finance, a single year of massive market gains or a sudden crash can significantly alter the mean, potentially providing a misleading picture of what a “normal” year looks like.
The Median: Finding the Middle Ground in Real Estate and Salaries
The median represents the middle value in a data set when the numbers are arranged in order from least to greatest. If there is an even number of observations, the median is the average of the two middle numbers. The median is arguably the most important metric for personal finance because it is “robust,” meaning it is not heavily influenced by outliers.
Consider real estate. When news outlets report on “median home prices,” they do so because the median is a much more accurate representation of the market than the mean. If a neighborhood has ten homes valued at $300,000 and one luxury mansion valued at $10 million, the mean price would be over $1 million, suggesting an unaffordable market. The median, however, would remain at $300,000, reflecting the reality for most buyers. The same principle applies to salaries; the median income is a better gauge of economic health for the general population than the mean, which can be skewed by a handful of billionaires.
The Mode: Identifying the Most Frequent Financial Occurrences
The mode is the value that appears most frequently in a data set. While less commonly discussed in high-level stock analysis, the mode is invaluable for business finance and retail-focused side hustles.
For an entrepreneur, the mode can help identify the “sweet spot” for pricing. If you sell a digital product at various price points through different promotions, the mode tells you which price point most customers are actually paying. In personal budgeting, the mode can help you identify recurring expenses or the most frequent category of spending, allowing you to target your most common habits for cost-cutting measures.
Navigating Market Volatility with Central Tendency
In the world of investing, central tendency is not just a static observation; it is a tool for predicting future movements and managing risk. Professional traders and long-term investors use these concepts to determine whether an asset is overvalued or undervalued.
Moving Averages and Trend Analysis
One of the most practical applications of central tendency in finance is the “Moving Average.” By calculating the mean price of a stock over a specific period—such as 50 days or 200 days—investors create a smoothed line that filters out daily volatility.
When a stock’s current price is significantly higher than its 200-day moving average, it may be considered overextended. Conversely, if it falls below that mean, it might be viewed as a buying opportunity. This is a direct application of central tendency to identify the “true” value of an asset amidst the chaos of market sentiment. It allows investors to make decisions based on the central trend rather than reactionary emotions triggered by short-term price swings.
Reversion to the Mean
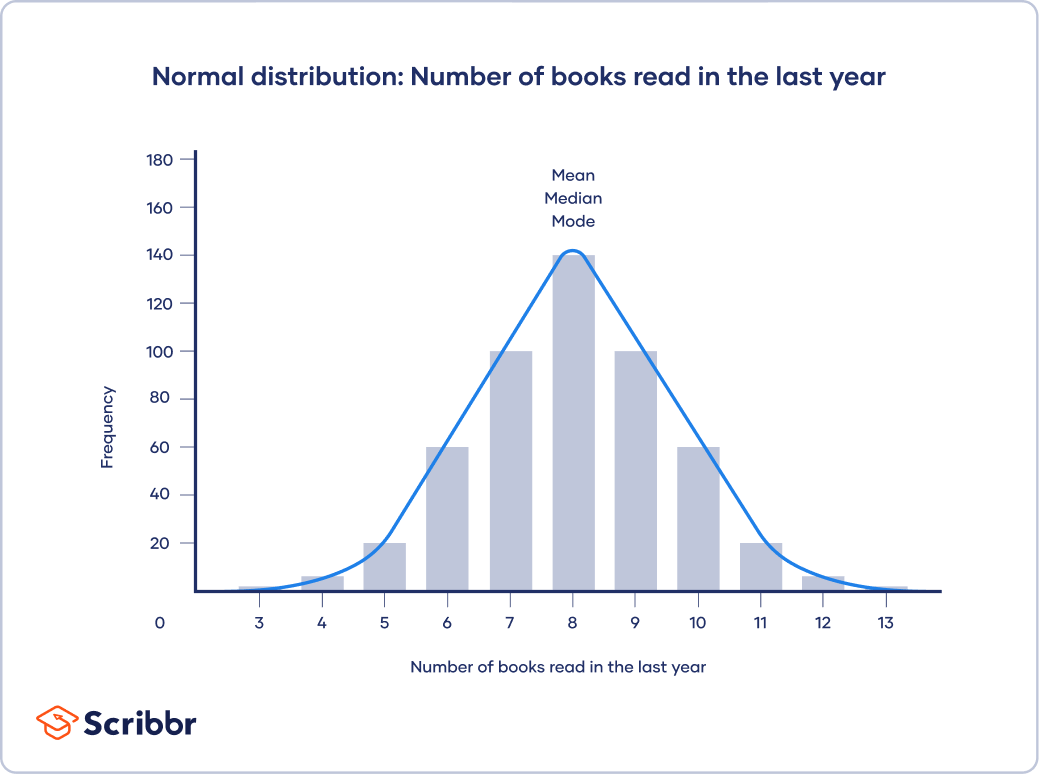
“Reversion to the mean” is a powerful theory in financial mathematics which suggests that asset prices and historical returns eventually return to their long-term average or mean level. For a value investor, this is a foundational concept. If a high-quality company’s profit margins or stock price deviate significantly from its historical mean due to temporary external factors, the savvy investor bets on a return to that central tendency.
Understanding this concept prevents the “recency bias” that leads many to buy at the peak and sell at the bottom. By recognizing that extreme performance—whether good or bad—is often temporary, you can maintain a disciplined approach to your portfolio, trusting that the central tendency will eventually reassert itself.
The Trap of the Average: Identifying Financial Outliers
While central tendency provides a useful summary, the “trap of the average” is a common pitfall for those who do not dig deeper into the data. Relying solely on the mean can lead to disastrous financial planning if you do not account for the distribution of the data.
How Wealth Concentration Skews the Mean
In macroeconomics and personal finance, the mean often paints a rosier picture than reality. This is particularly evident in discussions of national wealth or retirement savings. If you hear that the “average” retirement account balance for a certain age group is $200,000, but the median is only $50,000, it tells you that a small percentage of individuals have very large balances, while the majority are lagging far behind.
For your own financial planning, comparing yourself to the mean can be discouraging or misleading. If you are analyzing a potential investment in a specific sector, a high “average” growth rate might be driven by a single outlier company, while the rest of the industry struggles. Always look for the median alongside the mean to understand the concentration of success.
Choosing the Right Metric for Budgeting
When managing your household or business budget, choosing the wrong measure of central tendency can lead to cash flow issues. For example, if your utility bills fluctuate wildly (low in spring, high in summer), the mean monthly cost might help you calculate your total annual budget, but the mode or a “worst-case” outlier analysis might be better for ensuring you have enough liquidity during the peak months.
Successful financial management requires knowing when to use the mean for long-term projection and when to use the median or mode for daily operational stability.
Practical Applications in Business Finance and Side Hustles
For those looking to grow their income through business ventures or side hustles, central tendency is an essential metric for optimization and scaling.
Inventory Management and Sales Trends
If you run an e-commerce store or a physical retail business, the mode is your best friend for inventory management. By identifying the mode—the most frequently sold item or size—you can allocate your capital more efficiently. You wouldn’t want to buy stock based on a “mean” size that no one actually wears; you buy the mode because it represents the highest probability of a sale.
Furthermore, analyzing the median transaction value can help you understand the typical customer’s spending power. If your mean transaction is high because of one or two “whale” customers, but your median is low, your business model may be more fragile than it appears. Diversifying your offerings to raise the median transaction value can lead to more stable, predictable growth.
Cost Analysis and Profitability Margins
When calculating the cost of goods sold (COGS) or service delivery, using a weighted mean is often necessary. This involves giving more weight to the costs that occur more frequently or in larger volumes. In business finance, understanding the central tendency of your margins allows you to set prices that ensure long-term viability. If your profit margins have a low median, even a high mean (driven by a few high-ticket projects) might not be enough to sustain your business during slow periods.

Leveraging Statistical Clarity for Better Financial Decisions
Ultimately, central tendency is about finding the “signal” within the “noise.” The world of finance is overflowing with data points, and it is easy to become overwhelmed by the sheer volume of information. By applying the mathematical principles of mean, median, and mode, you gain a framework for interpreting that information with professional-grade clarity.
To achieve financial success, you must look beyond the surface-level numbers. Ask yourself: Is this “average” being skewed by outliers? What is the most frequent outcome I can expect? Where does the middle of this data set truly lie?
By incorporating these measures of central tendency into your financial toolkit, you can assess investment opportunities more accurately, manage your business more efficiently, and build a personal wealth strategy that is grounded in mathematical reality rather than speculative hope. Whether you are a seasoned investor or just starting your journey toward financial literacy, the center of your data is often where you will find the most valuable truths about your money.
aViewFromTheCave is a participant in the Amazon Services LLC Associates Program, an affiliate advertising program designed to provide a means for sites to earn advertising fees by advertising and linking to Amazon.com. Amazon, the Amazon logo, AmazonSupply, and the AmazonSupply logo are trademarks of Amazon.com, Inc. or its affiliates. As an Amazon Associate we earn affiliate commissions from qualifying purchases.