
Body Mass Index (BMI) is a widely recognized metric used to assess an individual’s weight relative to their height. A BMI chart, often presented as a graph or table, is a visual tool that helps individuals and healthcare professionals interpret BMI scores and categorize them into different weight status groups. Understanding what a BMI chart is and how to use it can provide valuable insights into personal health and potential health risks. This article delves into the intricacies of BMI charts, their components, applications, and limitations, offering a comprehensive guide to this common health assessment tool.
The Fundamentals of Body Mass Index (BMI)
At its core, BMI is a simple calculation that serves as a screening tool, not a definitive diagnostic measure. It’s designed to provide a quick and easy way to gauge whether your weight falls within a healthy range for your height. This concept, while straightforward, has been instrumental in public health initiatives and individual health monitoring for decades.
Calculating Your BMI
The calculation of BMI is based on a straightforward formula. It can be determined in two primary ways:
-
Metric System:
BMI = weight (kg) / [height (m)]²
For example, if an individual weighs 70 kilograms and is 1.75 meters tall, their BMI would be:
70 / (1.75 * 1.75) = 70 / 3.0625 = 22.86 (rounded) -
Imperial System:
BMI = [weight (lb) / height (in)²] * 703
The factor 703 is used to convert the units from pounds and inches to kilograms and meters. For instance, if an individual weighs 154 pounds and is 69 inches tall:
[154 / (69 * 69)] * 703 = [154 / 4761] * 703 = 0.032346 * 703 = 22.74 (rounded)
While these formulas are accurate, the advent of online BMI calculators and smartphone apps has made obtaining one’s BMI score incredibly accessible. These tools remove the need for manual calculation and often present the result alongside its corresponding category.
The Weight Status Categories
The calculated BMI score is then compared against a standardized scale to place an individual into one of several weight status categories. These categories are crucial for understanding the implications of a given BMI score.
-
Underweight: A BMI below 18.5. This category suggests that an individual may not be consuming enough calories to maintain a healthy weight, potentially leading to nutritional deficiencies and other health issues.
-
Normal or Healthy Weight: A BMI between 18.5 and 24.9. This is considered the ideal range, associated with the lowest risk of developing weight-related health problems.
-
Overweight: A BMI between 25.0 and 29.9. Individuals in this range are at an increased risk for certain health conditions compared to those in the healthy weight category.
-
Obese: A BMI of 30.0 or higher. This category is further subdivided into classes indicating increasing levels of health risk:
- Class I Obesity: BMI of 30.0 to 34.9
- Class II Obesity: BMI of 35.0 to 39.9
- Class III Obesity (Morbid Obesity): BMI of 40.0 or higher. This carries a significantly elevated risk for severe health complications.
These categories are not rigid definitions but rather guidelines that help identify potential health concerns.
Visualizing BMI: The BMI Chart and Its Components
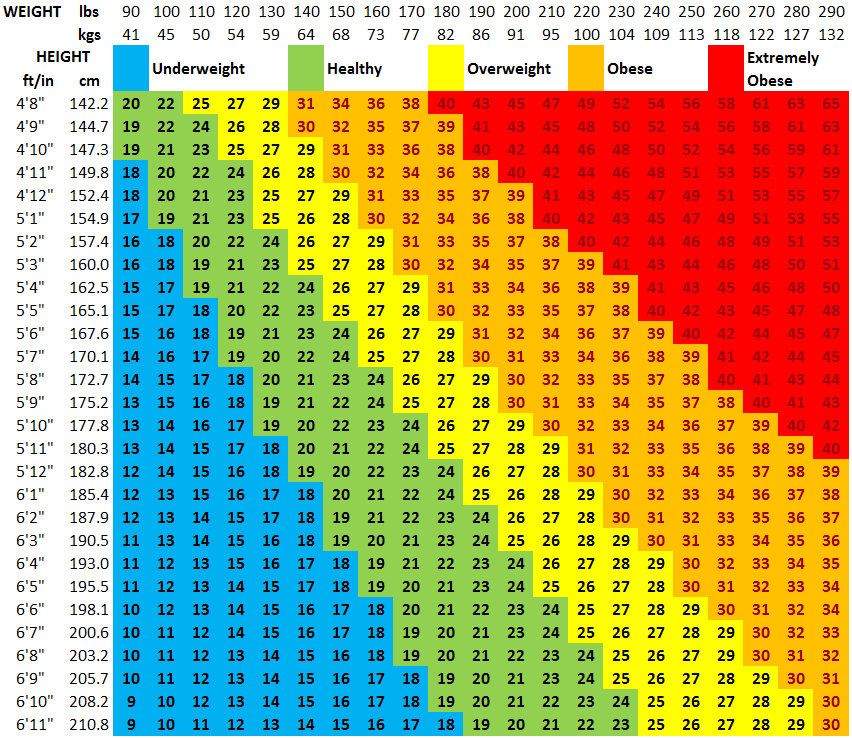
A BMI chart serves as a graphical representation of these categories, making it easier to visualize where an individual’s BMI score falls. These charts typically come in two main formats: tables and graphs.
The BMI Table
A BMI table is a straightforward two-dimensional grid. One axis usually represents height (either in inches or centimeters), and the other axis represents weight (in pounds or kilograms). Within the cells of the table, BMI values are pre-calculated and color-coded or labeled according to the weight status categories.
- How to Read a BMI Table: To use a BMI table, you locate your height on one axis and your weight on the other. Where these two points intersect, you’ll find your BMI value and its corresponding weight category. This method is particularly useful for quick reference without the need for any calculation. For instance, a table might show that for a person of a specific height, a weight of X pounds falls into the “Overweight” category, while a weight of Y pounds falls into the “Normal” category.
The BMI Graph (Nomogram)
A BMI graph, often referred to as a nomogram, offers a more dynamic visual representation. It typically features three parallel axes: height, weight, and BMI. A straight line is drawn connecting a person’s height and weight on their respective axes. The point where this line intersects the BMI axis provides the calculated BMI score. Additionally, the graph is usually overlaid with shaded regions or colored bands corresponding to the different BMI categories.
- Interpreting the BMI Graph: The advantage of a graph is that it can quickly show the range of weights that fall into each BMI category for a given height. If you’re using a nomogram, you place a ruler across your height and weight, and the BMI is read where the ruler crosses the middle scale. This visual approach can be very intuitive for understanding the relationship between height, weight, and BMI.
Both tables and graphs are invaluable tools for educational purposes and for individuals to self-monitor their weight status. They translate numerical data into easily digestible visual information.
Applications and Significance of BMI Charts
BMI charts are not merely academic tools; they have practical applications across various domains, particularly in healthcare and public health. Their widespread use stems from their simplicity and their ability to identify potential health risks associated with weight.
Healthcare and Clinical Settings
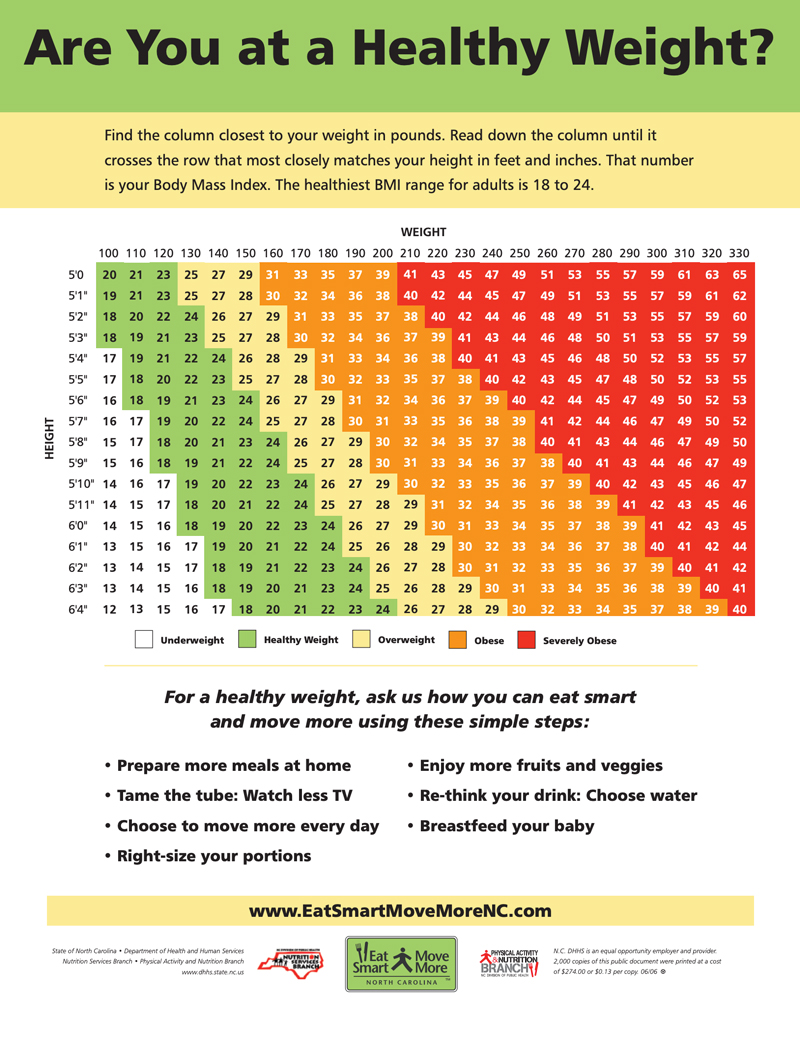
Healthcare professionals utilize BMI charts as a foundational screening tool during routine check-ups.
-
Initial Health Assessment: When a patient presents for an appointment, their height and weight are typically measured. This data is then used to calculate their BMI, which is plotted on a chart or compared against standardized values. This initial assessment helps physicians identify individuals who may be at risk for overweight or obesity-related health problems.
-
Monitoring Weight Changes: For individuals undergoing weight management programs, whether for weight loss or gain, BMI charts provide a clear visual representation of progress over time. Tracking BMI alongside other health markers can help assess the effectiveness of interventions.
-
Identifying Risk Factors: A BMI outside the healthy range can prompt further investigation into potential health issues. For example, elevated BMI is associated with an increased risk of:
- Cardiovascular diseases (heart disease, stroke)
- Type 2 diabetes
- Certain types of cancer
- Sleep apnea
- Osteoarthritis
- High blood pressure (hypertension)
- High cholesterol
Conversely, being underweight can indicate malnutrition, osteoporosis, or other health concerns.
Public Health and Epidemiology
On a larger scale, BMI charts and their underlying data are crucial for public health initiatives and epidemiological research.
-
Tracking Population Health Trends: By analyzing BMI data from large populations, public health organizations can identify trends in overweight and obesity rates. This information is vital for developing targeted prevention and intervention strategies to address public health crises like the obesity epidemic.
-
Informing Policy Decisions: Understanding the prevalence of different BMI categories within a population can inform government policies related to nutrition, physical activity, and healthcare resource allocation. For example, if a region shows a high prevalence of childhood obesity, policies might focus on improving school lunch programs or increasing access to safe recreational spaces.
-
Research and Education: BMI data is a common variable in many health research studies. BMI charts also serve as educational tools for the public, raising awareness about healthy weight ranges and the importance of maintaining a balanced lifestyle.
Limitations and Considerations of BMI
While BMI charts are incredibly useful, it is crucial to acknowledge their limitations. BMI is a screening tool, and it does not provide a complete picture of an individual’s health or body composition.
Muscle Mass vs. Fat Mass
One of the most significant limitations of BMI is its inability to distinguish between lean body mass (muscle) and fat mass.
-
Athletes and Muscular Individuals: Highly muscular individuals, such as athletes or bodybuilders, may have a high BMI because muscle is denser than fat. This could incorrectly place them in the overweight or obese categories, even if they have a very low percentage of body fat and are in excellent health. For these individuals, BMI is not an accurate indicator of their health status.
-
Body Composition: BMI does not account for where fat is distributed on the body. Visceral fat, the fat that surrounds internal organs, is particularly dangerous and is a strong predictor of metabolic and cardiovascular diseases. Someone with a “normal” BMI but a high amount of visceral fat could be at greater health risk than someone with a slightly higher BMI but less visceral fat.
Other Factors Not Accounted For
Beyond body composition, BMI overlooks several other factors that contribute to overall health.
-
Age: Muscle mass tends to decrease and fat mass tends to increase with age. Therefore, a BMI that is considered healthy for a younger adult might be less so for an older adult.
-
Sex: Men and women tend to have different body compositions, with women typically having a higher percentage of body fat than men, even at the same BMI.
-
Ethnicity: Some research suggests that certain ethnic groups may have different risks associated with specific BMI ranges. For example, individuals of South Asian descent may have a higher risk of developing type 2 diabetes at a lower BMI compared to individuals of European descent.
-
Bone Density: Individuals with very dense bones might have a higher weight that isn’t necessarily indicative of excess fat.
-
Hydration Levels: Temporary fluctuations in body water can affect weight and, consequently, BMI.

BMI as a Starting Point, Not an End Point
Given these limitations, it’s essential to view BMI and BMI charts as a starting point for discussion about health rather than a definitive diagnosis.
-
Complementary Assessments: Healthcare professionals often use BMI in conjunction with other assessments, such as waist circumference measurements (which can indicate visceral fat), blood pressure, cholesterol levels, blood sugar tests, and a physical examination.
-
Individualized Approach: The interpretation of BMI should always be individualized, taking into account a person’s unique physiology, lifestyle, and medical history. A high or low BMI should prompt a conversation with a doctor to determine the appropriate next steps for health assessment and management.
In conclusion, a BMI chart is a valuable tool for understanding weight status relative to height. By visually representing BMI categories, these charts facilitate easy interpretation of calculated BMI scores. While BMI offers a simple and accessible method for screening and public health monitoring, it’s crucial to use it alongside other health indicators and professional medical advice for a comprehensive assessment of an individual’s well-being.
aViewFromTheCave is a participant in the Amazon Services LLC Associates Program, an affiliate advertising program designed to provide a means for sites to earn advertising fees by advertising and linking to Amazon.com. Amazon, the Amazon logo, AmazonSupply, and the AmazonSupply logo are trademarks of Amazon.com, Inc. or its affiliates. As an Amazon Associate we earn affiliate commissions from qualifying purchases.