
In today’s hyper-digital world, software applications are the lifeblood of almost every business. From e-commerce platforms and banking apps to internal enterprise systems and SaaS products, their performance directly impacts user satisfaction, operational efficiency, and ultimately, the bottom line. A slow loading page, a glitchy checkout process, or an unresponsive backend can lead to lost revenue, damaged reputation, and frustrated customers. This escalating reliance on faultless digital experiences has given rise to an indispensable technology: Application Performance Monitoring, or APM.
APM monitoring isn’t merely a diagnostic tool; it’s a strategic imperative that provides deep visibility into the intricate workings of modern applications. It transforms reactive problem-solving into proactive optimization, ensuring that applications not only function but thrive under real-world conditions. Understanding what APM monitoring entails, why it’s crucial, and how it operates is fundamental for any organization navigating the complexities of the digital landscape.
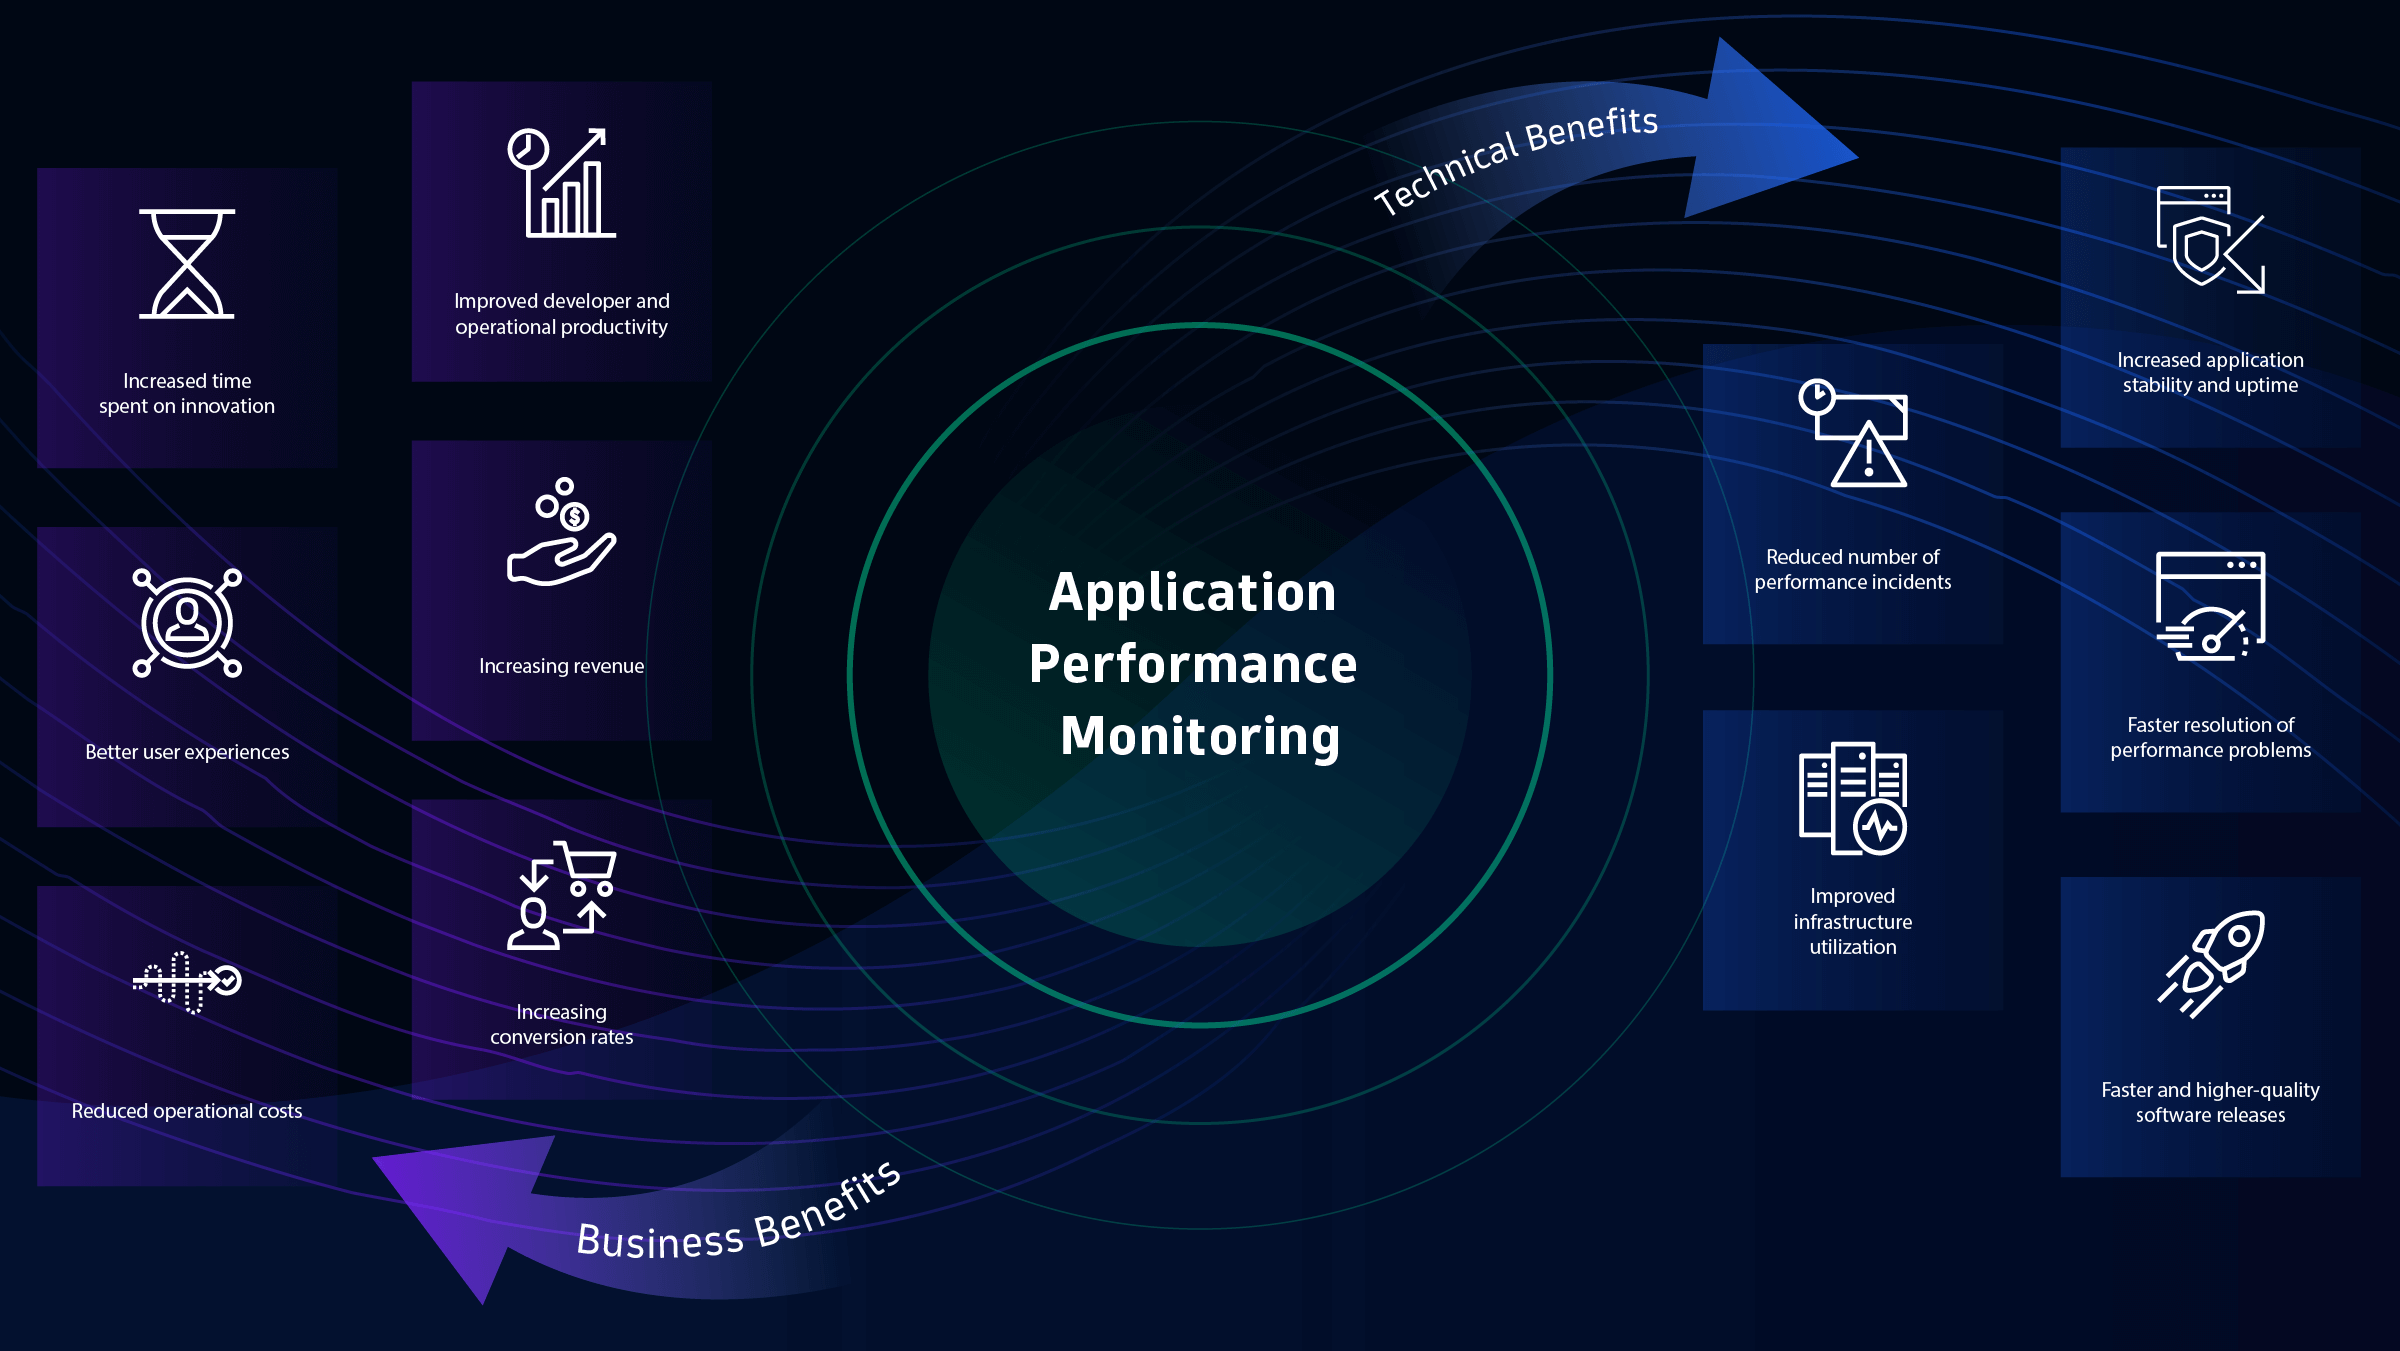
The Core Concept: Understanding Application Performance Monitoring
At its heart, APM is about understanding the health, availability, and performance of software applications from the end-user’s perspective, through the application code, and down into the underlying infrastructure. It’s the eyes and ears of your application ecosystem, constantly vigilant to potential issues.
Defining APM
Application Performance Monitoring (APM) refers to the tools and processes used to observe, track, manage, and analyze the performance metrics of software applications. Its primary goal is to ensure that applications meet expected levels of availability, responsiveness, and functionality, ultimately delivering a seamless experience for end-users and achieving business objectives.
An APM solution collects a vast array of data points, including:
-
End-user experience metrics: How fast pages load, how quickly transactions complete, user journeys.
-
Application runtime metrics: CPU usage, memory consumption, garbage collection rates, thread activity within the application servers.
-
Code-level performance: Identifying slow database queries, inefficient API calls, or problematic code blocks.
-
Infrastructure performance: Monitoring servers, databases, containers, virtual machines, and network components supporting the application.
-
Dependency mapping: Understanding how different services and components interact and depend on each other.
By aggregating and correlating this data, APM provides a comprehensive picture of an application’s health, allowing teams to identify and resolve performance bottlenecks before they escalate into critical issues.
Why APM is Crucial in Today’s Digital Landscape
The necessity for robust APM has never been greater, driven by several converging trends:
-
Exploding User Expectations: Modern users expect applications to be fast, reliable, and available 24/7. Any deviation from this standard can lead to immediate abandonment and a switch to competitors. Studies consistently show that even a few seconds of delay can significantly increase bounce rates and decrease conversions.
-
Complexity of Modern Architectures: The monolithic applications of yesteryear have largely given way to highly distributed systems, microservices architectures, serverless functions, and cloud-native deployments. These complex environments, often spanning multiple cloud providers and hybrid infrastructures, make manual troubleshooting virtually impossible. Pinpointing the root cause of a performance issue in a system with hundreds of interconnected services requires sophisticated tooling.
-
Impact on Business Outcomes: Application performance directly translates to business success or failure. Slow e-commerce sites lose sales; unreliable banking apps erode trust; inefficient internal tools reduce employee productivity. APM directly mitigates these risks by safeguarding revenue, protecting brand reputation, and ensuring operational continuity.
-
Rapid Development Cycles (DevOps): With the prevalence of Agile and DevOps methodologies, applications are constantly being updated and deployed. APM integrates into the CI/CD pipeline, providing immediate feedback on performance impacts of new code, enabling developers to catch and fix issues early in the development lifecycle rather than in production.
Key Pillars of APM: What Does It Monitor?
A robust APM solution offers a multi-faceted approach to monitoring, typically encompassing several core functional areas that provide a holistic view of application health.
End-User Experience Monitoring (EUM)
EUM focuses on the application’s performance as perceived by the actual users. This is paramount because, regardless of how well the backend performs, if the user experience is poor, the application is failing. EUM is typically achieved through:
-
Real User Monitoring (RUM): Collects data from actual user interactions within the browser or mobile application. It tracks metrics like page load times, AJAX request times, geographical performance, and user click paths, providing insights into real-world performance issues.
-
Synthetic Monitoring: Involves scripting automated transactions or user journeys that are run at regular intervals from various global locations. This proactive approach helps establish a performance baseline, test application availability, and identify issues before real users encounter them.
Application Runtime & Infrastructure Monitoring
This pillar delves into the performance of the application’s internal workings and the resources it consumes. It’s about understanding the “engine” powering the application.
-
Code-Level Monitoring: Tracks the execution of application code, including methods, classes, and function calls. It can identify bottlenecks within the code itself, such as inefficient algorithms or excessive database calls.
-
Server and Host Monitoring: Gathers metrics from the underlying physical or virtual servers (CPU, memory, disk I/O, network usage) to ensure infrastructure health and adequate resource provisioning.
-
Database Monitoring: Observes database performance, including query execution times, connection pools, deadlocks, and overall database health, which are common sources of application slowdowns.
-
Container and Orchestration Monitoring: For modern cloud-native applications, APM tools monitor container platforms (e.g., Docker, Kubernetes) to track resource utilization, pod health, and service mesh performance.
Transaction Tracing & Code-Level Diagnostics
One of the most powerful features of modern APM is distributed transaction tracing. In a microservices architecture, a single user request might traverse dozens of different services and components. Transaction tracing follows a request from its initiation (e.g., a user clicking a button) through every service, database query, and external API call it makes, providing a complete “trace” of its journey.
This allows developers and operations teams to:
-
Pinpoint Bottlenecks: Instantly identify exactly which service, method, or database call is causing a delay within a complex transaction.
-
Map Dependencies: Understand the intricate web of dependencies between services, crucial for troubleshooting and impact analysis.
-
Analyze Errors: See the full context of an error, including the stack trace and all preceding operations, making debugging much faster.
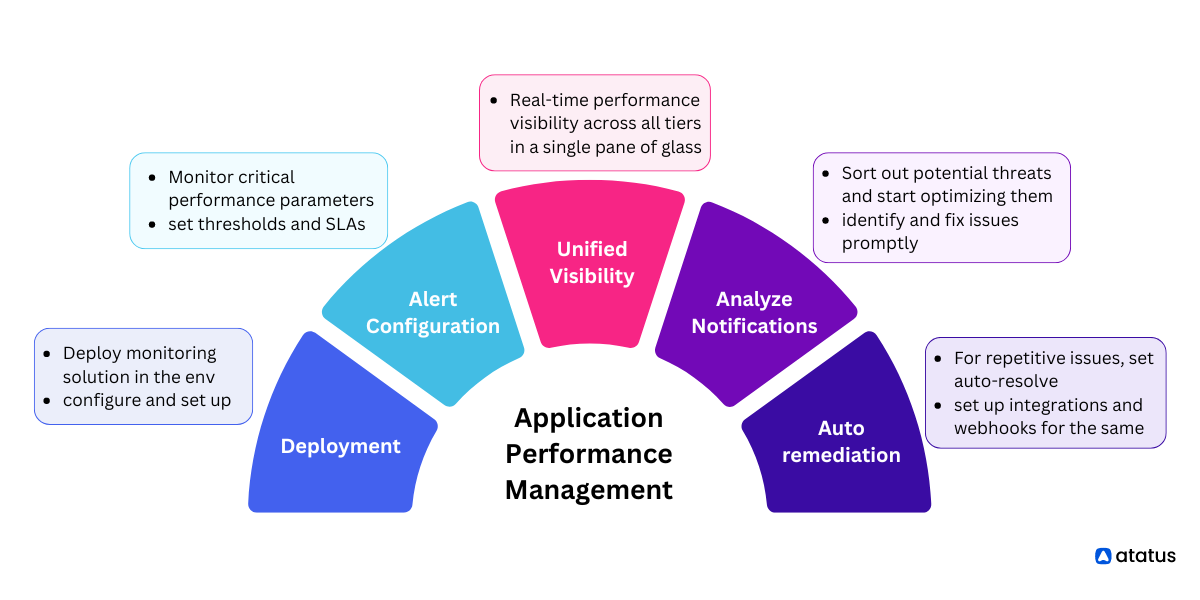
Root Cause Analysis & Alerting
Beyond merely collecting data, APM solutions excel at helping teams quickly understand why a problem occurred and alerting them to it.
-
Automated Root Cause Analysis (RCA): Leveraging AI and machine learning, advanced APM tools can automatically correlate disparate metrics (e.g., a spike in CPU usage, a corresponding increase in database errors, and a drop in user transaction speed) to suggest the most probable root cause of an issue.
-
Intelligent Alerting: Rather than overwhelming teams with generic alerts, APM provides context-rich notifications based on predefined thresholds, anomaly detection, or business impact. Alerts can be customized to trigger based on specific performance degradation, error rates, or availability issues, delivered via various channels (email, Slack, PagerDuty, etc.).
The Benefits of Implementing APM
The adoption of APM delivers a multitude of tangible benefits that extend across technical teams, business stakeholders, and, most importantly, end-users.
Enhanced User Experience (UX)
By providing deep insights into real and synthetic user interactions, APM empowers organizations to deliver applications that are consistently fast, responsive, and available. This directly translates to higher user satisfaction, increased engagement, and improved customer loyalty. A smooth UX reduces abandonment rates and strengthens brand perception.
Proactive Issue Resolution & Reduced Downtime
APM’s ability to monitor applications continuously and detect anomalies means that issues can often be identified and addressed before they significantly impact users. This shift from reactive firefighting to proactive problem-solving drastically reduces Mean Time To Resolution (MTTR) and minimizes costly downtime, safeguarding revenue and productivity.
Optimized Resource Utilization & Cost Savings
Through detailed performance metrics, APM highlights areas of inefficiency, such as over-provisioned infrastructure or poorly optimized code. This allows teams to make data-driven decisions about resource allocation, whether it’s scaling cloud instances down, optimizing database queries, or refactoring inefficient code, leading to significant cost savings, especially in cloud environments.
Improved Development & Operations Collaboration (DevOps)
APM serves as a shared source of truth for both development and operations teams. Developers gain visibility into how their code performs in production, enabling faster debugging and more effective code optimization. Operations teams can quickly identify application-specific issues versus infrastructure problems. This shared understanding fosters a culture of collaboration, accelerates release cycles, and improves overall product quality.
Data-Driven Decision Making
Beyond troubleshooting, APM data provides invaluable insights for strategic decision-making. Performance trends can inform capacity planning, guide future architecture choices, and even help prioritize new features based on their potential impact on performance and user experience. It turns abstract performance goals into measurable objectives.
Choosing the Right APM Solution
Selecting an APM solution is a significant investment that requires careful consideration. The market is robust, with numerous vendors offering varying capabilities and features.
Key Considerations
When evaluating APM tools, organizations should consider:
-
Full-Stack Visibility: Does the solution offer end-to-end monitoring from the user’s browser down to the underlying infrastructure, including cloud services, containers, and serverless functions?
-
Scalability: Can the solution handle the current and future growth of your application ecosystem, including increasing data volumes and application complexity?
-
Integration: Does it integrate seamlessly with your existing tech stack, including logging tools, CI/CD pipelines, incident management systems, and cloud providers?
-
Ease of Use & Dashboards: Is the user interface intuitive? Does it provide customizable dashboards and reports that are easy to understand for different stakeholders?
-
Alerting & AI Capabilities: How sophisticated are its anomaly detection and root cause analysis capabilities? Can alerts be finely tuned to avoid alert fatigue?
-
Deployment Options: Is it available as SaaS, on-premise, or a hybrid model that fits your security and compliance requirements?
-
Cost & Licensing: Understand the pricing model (e.g., per host, per transaction, per data ingested) and calculate the total cost of ownership.
-
Vendor Support & Community: Evaluate the vendor’s reputation, support quality, documentation, and the availability of a vibrant user community.
Leading APM Vendors
The APM market features several prominent players, each with its strengths and focus areas. Companies like Dynatrace, New Relic, Datadog, AppDynamics (Cisco), and Splunk (with its Observability Cloud) offer comprehensive APM suites that cater to a wide range of enterprise needs, from cloud-native startups to large legacy systems. The best choice often depends on an organization’s specific architecture, budget, and desired feature set.

Conclusion
In an era where every second of application performance counts, APM monitoring has evolved from a niche IT tool to an indispensable strategic asset. It demystifies the complex inner workings of modern applications, providing the clarity and insights needed to ensure optimal user experiences, drive business continuity, and foster innovation. By embracing APM, organizations move beyond merely reacting to problems; they proactively sculpt a resilient, high-performing digital future. It is not just about observing; it is about understanding, optimizing, and ultimately, succeeding in the digital age.
aViewFromTheCave is a participant in the Amazon Services LLC Associates Program, an affiliate advertising program designed to provide a means for sites to earn advertising fees by advertising and linking to Amazon.com. Amazon, the Amazon logo, AmazonSupply, and the AmazonSupply logo are trademarks of Amazon.com, Inc. or its affiliates. As an Amazon Associate we earn affiliate commissions from qualifying purchases.