In the realm of statistical hypothesis testing, understanding the nuances of potential errors is crucial for drawing accurate conclusions. While the concept of a Type I error often takes center stage, its counterpart, the Type II error, carries significant implications that can shape research outcomes, product development, and even financial decisions. This article delves into the nature of Type II errors, exploring their definition, implications, and strategies for mitigation within the context of technology.
Understanding Hypothesis Testing and Errors
Hypothesis testing is a cornerstone of scientific inquiry and technological development. It’s a formal procedure used to evaluate a claim or hypothesis about a population based on sample data. The process typically involves setting up two competing hypotheses: the null hypothesis ($H0$) and the alternative hypothesis ($Ha$).
- Null Hypothesis ($H0$): This is a statement of no effect or no difference. It represents the status quo or the default assumption. For example, in A/B testing a new software feature, $H0$ might state that the new feature has no impact on user engagement.
- Alternative Hypothesis ($Ha$): This is the statement that contradicts the null hypothesis. It represents what the researcher or developer is trying to find evidence for. In the A/B testing example, $Ha$ would state that the new feature does have an impact on user engagement.
The goal of hypothesis testing is to determine whether there is enough statistical evidence in the sample data to reject the null hypothesis in favor of the alternative hypothesis. However, because we are working with samples and not the entire population, there’s always a chance of making an incorrect decision. These potential errors are categorized into two types:
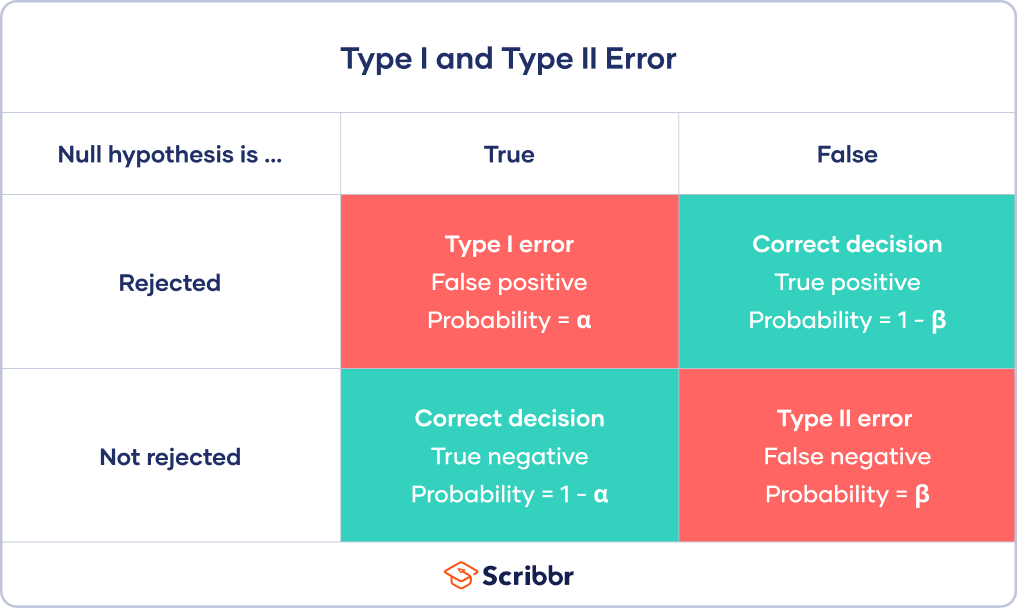
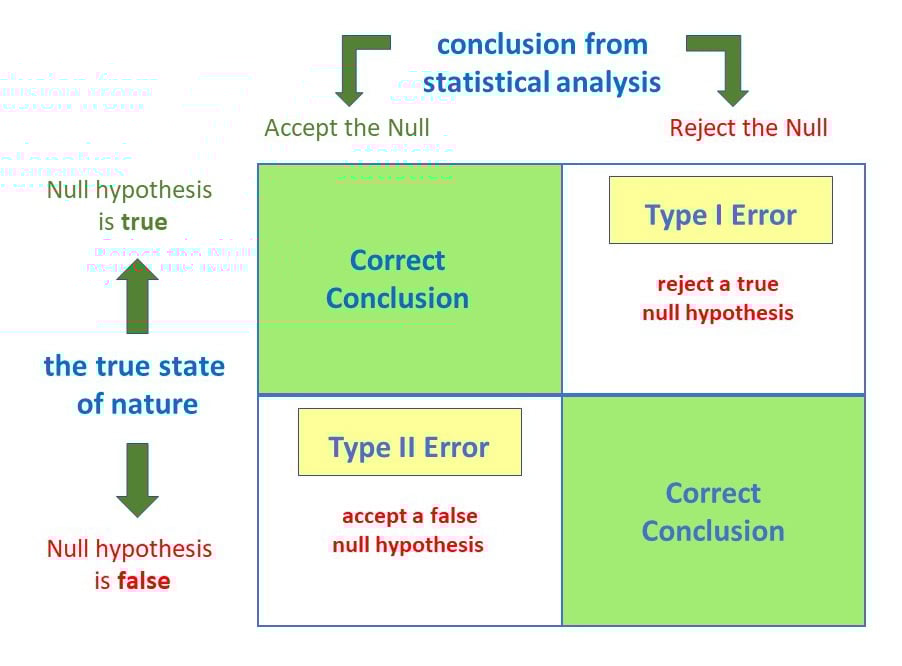
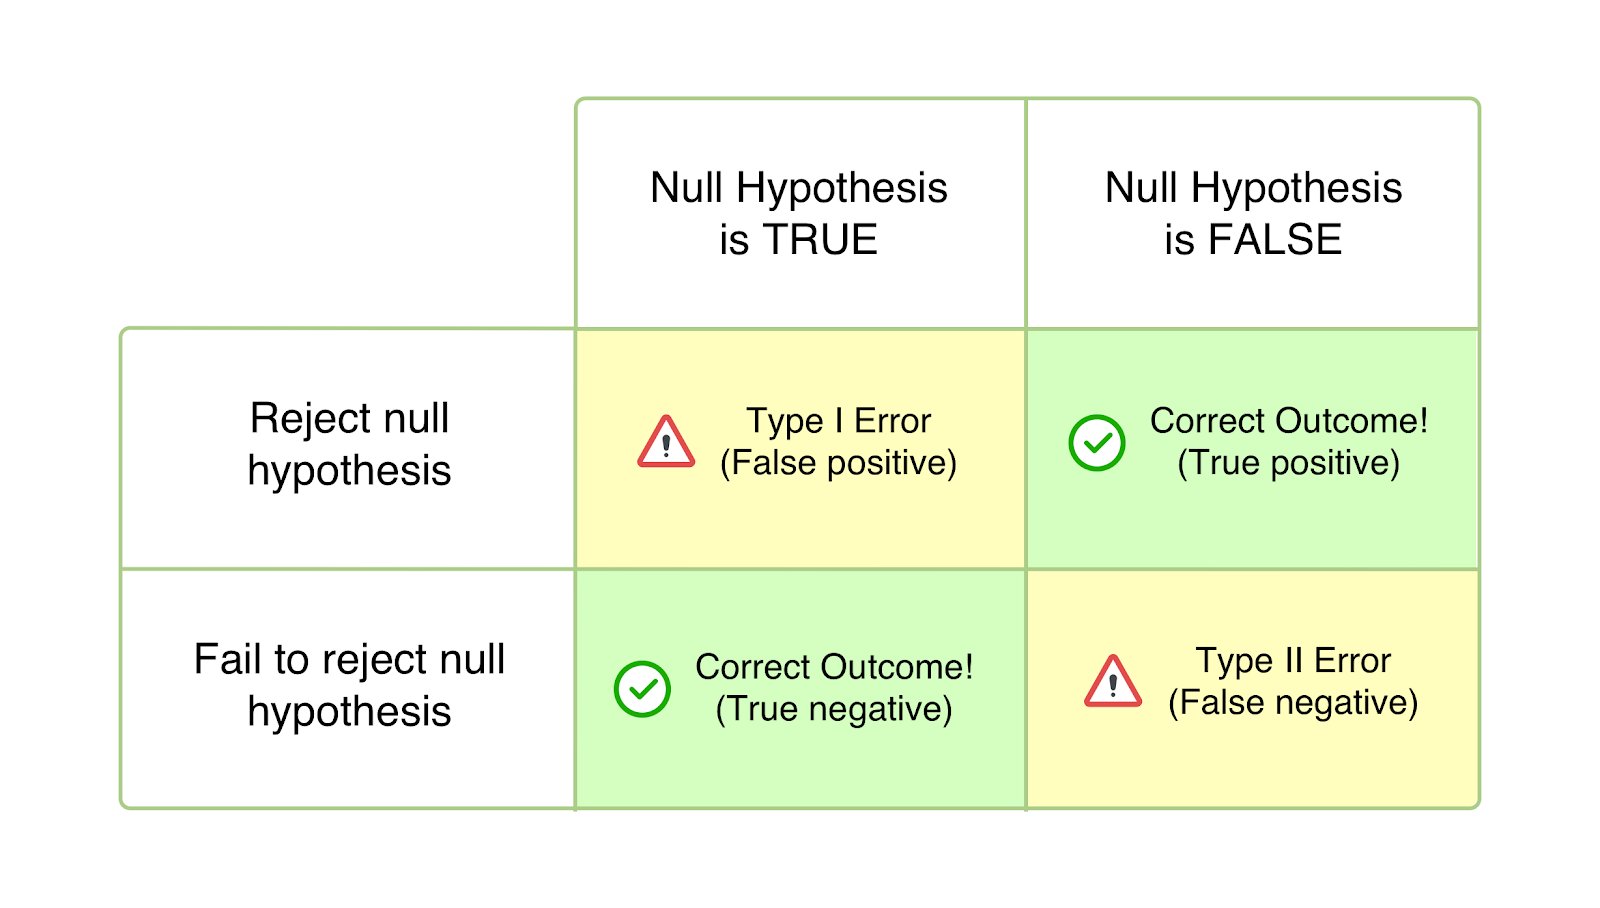
- Type I Error (False Positive): This occurs when we reject the null hypothesis ($H_0$) when it is actually true. In simpler terms, we conclude there is a significant effect or difference when there isn’t one. The probability of making a Type I error is denoted by $alpha$ (alpha), which is often set as the significance level (e.g., 0.05).
- Type II Error (False Negative): This occurs when we fail to reject the null hypothesis ($H_0$) when it is actually false. In other words, we conclude there is no significant effect or difference when there actually is one. The probability of making a Type II error is denoted by $beta$ (beta).
The Relationship Between Type I and Type II Errors
It’s important to recognize that Type I and Type II errors are inversely related. Decreasing the probability of one type of error generally increases the probability of the other, assuming other factors remain constant. This trade-off is a fundamental consideration in designing and interpreting statistical tests.
For instance, if we set a very strict significance level ($alpha$ very low) to minimize Type I errors, we might increase the chance of missing a real effect, thereby increasing $beta$ (the probability of a Type II error). Conversely, a more lenient $alpha$ increases the risk of a Type I error but can decrease the risk of a Type II error.
The Nature and Impact of Type II Errors in Technology
A Type II error, or a false negative, in the context of technology can have profound consequences, often leading to missed opportunities, delayed innovation, and a failure to address critical issues. Unlike a Type I error where a false alarm might lead to unnecessary action, a Type II error means a real problem or benefit goes unnoticed.
Common Scenarios for Type II Errors in Tech
Consider the following scenarios where a Type II error could occur:
False Negatives in Bug Detection
When developing new software, automated testing suites are crucial for identifying bugs. A null hypothesis might be “The new code contains no critical bugs.” A Type II error here would mean the testing suite fails to detect a genuine bug. The consequence? The buggy software is released to users, leading to frustration, potential data loss, and reputational damage for the company.
Overlooking Performance Improvements
Imagine a company testing a new algorithm to optimize server response times. The null hypothesis could be “The new algorithm does not significantly improve response times.” A Type II error would occur if the algorithm actually improves response times, but the statistical test fails to detect this improvement. This means the company misses out on a real performance boost, potentially impacting user experience and operational costs.
Misjudging User Engagement for New Features
When launching a new feature in an app or website, developers often run A/B tests to see if it increases user engagement. If the null hypothesis is “The new feature does not increase user engagement,” a Type II error means that the feature is indeed engaging for users, but the test concludes there’s no significant difference. This could lead to the feature being discarded or de-prioritized, despite its potential to drive user retention and satisfaction.
Ineffective Security Measures
In cybersecurity, a null hypothesis could be “This network traffic is not malicious.” A Type II error would occur if a security system fails to flag genuinely malicious network activity. This could lead to a data breach, system compromise, and significant financial and reputational damage.
Consequences of Ignoring Type II Errors
The implications of overlooking a Type II error can be far-reaching:
- Missed Innovation: Failing to detect a beneficial feature or improvement can stall product development and prevent a company from gaining a competitive edge.
- Suboptimal User Experience: Bugs or performance issues that are not detected can lead to user dissatisfaction, churn, and negative reviews.
- Security Vulnerabilities: In cybersecurity, a missed threat can have catastrophic consequences, including financial loss, intellectual property theft, and regulatory penalties.
- Wasted Resources: If a real problem is not identified, resources might be allocated to less critical areas, while the actual issue festers.
- Erosion of Trust: Repeatedly releasing faulty products or failing to address user concerns can damage a company’s reputation and erode customer trust.
Factors Influencing the Probability of a Type II Error ($beta$)
Several factors contribute to the likelihood of committing a Type II error. Understanding these factors is key to implementing strategies that reduce $beta$.
Sample Size
This is arguably the most critical factor. A larger sample size provides more information about the population, reducing the uncertainty inherent in statistical estimates. With a larger sample, it becomes easier to detect even small but real effects. Conversely, a small sample size can mask a genuine difference or effect, leading to a Type II error.
- Example: Imagine testing a new recommendation algorithm. If you only test it on 10 users, you might miss subtle improvements in click-through rates that would be apparent with 1,000 users.
Effect Size
The effect size refers to the magnitude of the difference or relationship between variables that the hypothesis test is designed to detect. A larger effect size is generally easier to detect. If the true effect is small, you’ll need a larger sample size or a more sensitive test to have a good chance of rejecting the null hypothesis.
- Example: If a new UI change is expected to increase conversion rates by 50% (large effect size), it’s easier to detect than a change expected to increase conversion rates by 1% (small effect size). Detecting smaller effects requires more statistical power.
Significance Level ($alpha$)
As discussed earlier, there’s an inverse relationship between $alpha$ and $beta$. A higher $alpha$ (e.g., 0.10 instead of 0.05) makes it easier to reject the null hypothesis, thus reducing $beta$. However, this comes at the cost of increasing the probability of a Type I error. The choice of $alpha$ is a strategic decision based on the relative costs of each type of error.
Variability in the Data
The more variability or “noise” there is in the data, the harder it is to detect a true signal. High variability can obscure real effects, increasing the chance of a Type II error. Techniques to reduce variability, such as standardizing measurement procedures or using more precise instruments, can help.
- Example: If user response times vary wildly due to network issues, it becomes harder to detect a consistent improvement from a new optimization technique.
Statistical Power
Statistical power is defined as the probability of correctly rejecting a false null hypothesis. It is equal to $1 – beta$. Therefore, high power means a low probability of a Type II error. Researchers and developers aim for high statistical power in their tests.
Mitigating Type II Errors in Technological Applications
Given the significant consequences of Type II errors, proactive strategies are essential to minimize their occurrence in technology development and deployment.
Increasing Sample Size
This is often the most straightforward and effective method. When planning an experiment or test, carefully determine the sample size required to achieve a desired level of statistical power. Tools and formulas exist for power analysis, which help in calculating the necessary sample size based on the expected effect size, significance level, and desired power.
- Practical Application: Before launching a new feature to all users, conduct a well-powered A/B test with a sufficiently large segment of the user base.
Increasing the Effect Size
While often not directly controllable, sometimes the design of an experiment or the magnitude of a change can influence the effect size. When possible, aim for interventions or features that are expected to have a substantial impact.
- Practical Application: Focus on developing features that address major pain points or offer significant improvements rather than marginal tweaks, as larger potential effects are easier to detect.
Choosing an Appropriate Significance Level ($alpha$)
The choice of $alpha$ should reflect the relative consequences of Type I versus Type II errors in a specific context. In scenarios where missing a real effect is more detrimental (e.g., missing a critical security threat), a slightly higher $alpha$ might be considered, carefully balancing it against the increased risk of a Type I error.
- Practical Application: In a system designed to detect critical system failures, the cost of missing a failure (Type II error) might outweigh the cost of a false alarm (Type I error), influencing the choice of $alpha$.
Improving Measurement Precision and Reducing Variability
Invest in robust data collection methods and tools. Standardize testing protocols to ensure consistency. Employ techniques that can reduce random noise in the data.
- Practical Application: Utilize precise logging mechanisms for user behavior, ensure consistent environmental conditions for performance tests, and consider data cleaning techniques to remove outliers that might distort results.
Utilizing More Powerful Statistical Tests
Different statistical tests have varying levels of power. Choose tests that are most appropriate for your data and research question. Non-parametric tests, for example, might be less powerful than parametric tests when assumptions are met, but they can be valuable when data violates parametric assumptions.
- Practical Application: Select the most sensitive statistical methods available for analyzing A/B test results, ensuring they align with the data’s distribution.
Conducting Sequential Testing or Adaptive Designs
In some cases, especially with large datasets or long-running experiments, sequential testing can be more efficient. This involves analyzing data as it accumulates and potentially stopping the experiment early if a significant result is found or if it becomes clear that no significant result will emerge. Adaptive designs allow for modifications to the experiment based on interim results.
- Practical Application: For ongoing product monitoring, adaptive sampling or analysis can allow for quicker detection of emerging issues or benefits without waiting for a fixed experimental period.
Conclusion
The Type II error, or false negative, is a critical consideration in the dynamic field of technology. It represents the failure to detect a real phenomenon – be it a critical bug, a beneficial feature, or a security threat. By understanding the factors that influence the probability of Type II errors, such as sample size, effect size, and data variability, technologists can implement robust strategies to mitigate their occurrence. Prioritizing well-designed experiments, adequate sample sizes, and appropriate statistical methods is not just about avoiding errors; it’s about maximizing innovation, ensuring user satisfaction, and maintaining the integrity and security of technological systems. The pursuit of accuracy in statistical inference, and the diligent avoidance of both Type I and Type II errors, remains paramount for driving progress and making sound decisions in the ever-evolving tech landscape.
aViewFromTheCave is a participant in the Amazon Services LLC Associates Program, an affiliate advertising program designed to provide a means for sites to earn advertising fees by advertising and linking to Amazon.com. Amazon, the Amazon logo, AmazonSupply, and the AmazonSupply logo are trademarks of Amazon.com, Inc. or its affiliates. As an Amazon Associate we earn affiliate commissions from qualifying purchases.