
In the vast landscape of medical diagnostics, certain tools stand out for their elegant simplicity combined with profound diagnostic power. The tympanogram is one such marvel, often overshadowed by more visibly complex imaging techniques, yet absolutely indispensable in assessing the health and function of the middle ear. At its core, a tympanogram is not merely a test; it is a sophisticated application of acoustic engineering and digital processing, a testament to how technology can illuminate the unseen intricacies of human physiology. It provides an objective, non-invasive window into the delicate mechanics of the eardrum and the tiny bones behind it, offering critical insights for audiologists, otolaryngologists, and general practitioners alike.

To truly understand “what is a tympanogram,” we must delve beyond its clinical application and appreciate the technological ingenuity that underpins its operation. It represents a synergy of precise sensor technology, real-time data acquisition, and intelligent software interpretation, all working in concert to translate complex acoustic impedance measurements into easily interpretable graphical representations. This article will explore the technical underpinnings of tympanometry, examining the devices, the principles, the data processing, and the evolving future of this critical diagnostic technology within the broader healthcare ecosystem.
The Core Technology: How a Tympanometer Works
The magic of a tympanogram lies squarely in the device that performs it: the tympanometer. Far from a simple gadget, a modern tympanometer is a marvel of miniaturized engineering and acoustic precision, designed to meticulously measure the mechanical properties of the middle ear system. Its ability to provide objective data on eardrum mobility and middle ear pressure makes it an invaluable diagnostic tool, particularly when dealing with conditions that might not be easily observed or when subjective patient feedback is unreliable.
Anatomy of the Tympanometer: Components and Design
A typical tympanometer consists of several critical components, each playing a vital role in the test procedure. The most recognizable part is the probe tip, which is designed to create an airtight seal in the patient’s ear canal. This seal is paramount, as it allows the device to precisely control the air pressure within the enclosed canal.
Within this probe, or connected directly to it via fine tubing, are three primary technological elements:
-
A Miniature Loudspeaker (Oscillator): This component emits a low-frequency tone, typically 226 Hz for adults and 1000 Hz for infants. The exact frequency is chosen to maximize sensitivity to middle ear changes without causing discomfort. The speaker’s design ensures a stable and precise sound output.
-
A Miniature Microphone: Positioned strategically, this microphone continuously monitors the sound pressure level within the ear canal. It measures the amount of the emitted sound that is reflected off the eardrum.
-
An Air Pump: This electronically controlled pump systematically changes the air pressure within the sealed ear canal. It can either increase pressure (positive pressure) or decrease it (negative pressure) relative to atmospheric pressure, often sweeping through a range from +200 daPa to -400 daPa. The pump’s precision ensures a smooth and controlled pressure sweep, which is essential for accurate measurements.
The robust design of these components, often made from high-grade, biocompatible materials, ensures both accuracy and patient safety. Modern tympanometers are engineered for portability, durability, and ease of sterilization, making them suitable for diverse clinical environments, from bustling hospitals to remote field clinics.
Principles of Operation: Sound Waves and Pressure Dynamics
The operational principles of a tympanometer are rooted in fundamental physics, specifically acoustics and mechanics. When the probe forms an airtight seal, the air pump begins its sweep, systematically changing the pressure in the ear canal. Simultaneously, the loudspeaker emits its tone.
Here’s where the magic happens:
-
Acoustic Impedance: The eardrum and middle ear system have a characteristic acoustic impedance, which is essentially its resistance to the flow of sound energy. This impedance is influenced by the stiffness and mass of the eardrum and the ossicles (the tiny bones in the middle ear).
-
Pressure-Dependent Mobility: The eardrum is most mobile (and therefore transmits sound most efficiently into the middle ear) when the air pressure on both sides of it is equal. As the air pressure in the ear canal changes, the eardrum’s mobility changes. If the pressure in the canal is very high or very low compared to the middle ear pressure, the eardrum becomes stiff, and less sound energy is transmitted. This means more sound energy is reflected back into the ear canal.
-
Measuring Reflection: The microphone continuously measures the intensity of the reflected sound wave. When the eardrum is stiff, more sound is reflected, and the microphone detects a higher sound pressure level. When the eardrum is most mobile (i.e., when the canal pressure equals the middle ear pressure), more sound is absorbed and transmitted, meaning less is reflected, and the microphone detects a lower sound pressure level.
The tympanometer’s internal processor records these changes in reflected sound intensity as a function of the applied air pressure. This raw data is the foundation upon which the tympanogram graph is built.
Data Collection, Processing, and Interpretation
The brilliance of tympanometry lies not just in its ability to generate raw data, but in how sophisticated algorithms and software transform that data into a coherent, clinically meaningful visual representation. Without this layer of digital processing, the raw measurements of reflected sound at varying pressures would be indecipherable to the human eye.
Capturing the Acoustic Reflex: Raw Data to Meaningful Curves
As the tympanometer sweeps through its pressure range, the microphone diligently records the changes in sound reflection. This forms a series of data points: for each pressure level applied, there’s a corresponding measurement of acoustic admittance (the inverse of impedance, representing how easily sound energy flows through the system).
These individual data points, once collected, are not immediately useful. Their true value emerges when they are plotted against each other. The system plots acoustic admittance (or compliance, a measure of mobility) on the Y-axis and ear canal pressure on the X-axis. The resulting curve, the tympanogram, visually represents the eardrum’s mobility across the pressure range. The peak of this curve typically indicates the pressure at which the eardrum is most compliant, which ideally corresponds to the middle ear pressure.
Software at the Helm: From Raw Signal to Diagnostic Graph
The transition from raw acoustic signals to a diagnostic graph is orchestrated by the tympanometer’s integrated software. This software performs several crucial functions:
-
Signal Filtering and Amplification: Raw microphone signals are often noisy. The software applies digital filters to remove unwanted frequencies and amplifies the relevant acoustic data to ensure clarity and accuracy.
-
Calibration: Regular calibration routines, often automated or semi-automated, ensure the tympanometer provides consistent and accurate measurements, compensating for environmental factors or minor hardware drift.
-
Data Transformation and Plotting: The software converts the raw reflected sound measurements into units of acoustic admittance (e.g., milliliters or cubic centimeters) and plots this against the corresponding ear canal pressure. This involves complex algorithms that translate impedance changes into a visually understandable curve.
-
Curve Analysis and Classification: Advanced tympanometry software can automatically analyze the generated curve, identify key parameters (peak compliance, peak pressure, ear canal volume), and even classify the tympanogram into common types (Type A, B, C, Ad, As). This pre-analysis aids clinicians in rapid interpretation and can highlight potential issues.
-
User Interface and Reporting: Modern tympanometers feature intuitive graphical user interfaces (GUIs) that display the tympanogram in real-time, allow for easy patient data entry, and facilitate storage and retrieval of results. Many systems can also generate professional reports, often integrated with electronic health records (EHRs), streamlining documentation and information sharing.
The precision and reliability of this software are critical. Errors in signal processing or plotting can lead to misdiagnosis, emphasizing the need for rigorous software development and testing in medical device technology.
The Diagnostic Power: Unlocking Middle Ear Health
The technologically generated tympanogram curve offers powerful diagnostic insights, providing objective evidence for various middle ear conditions:
-
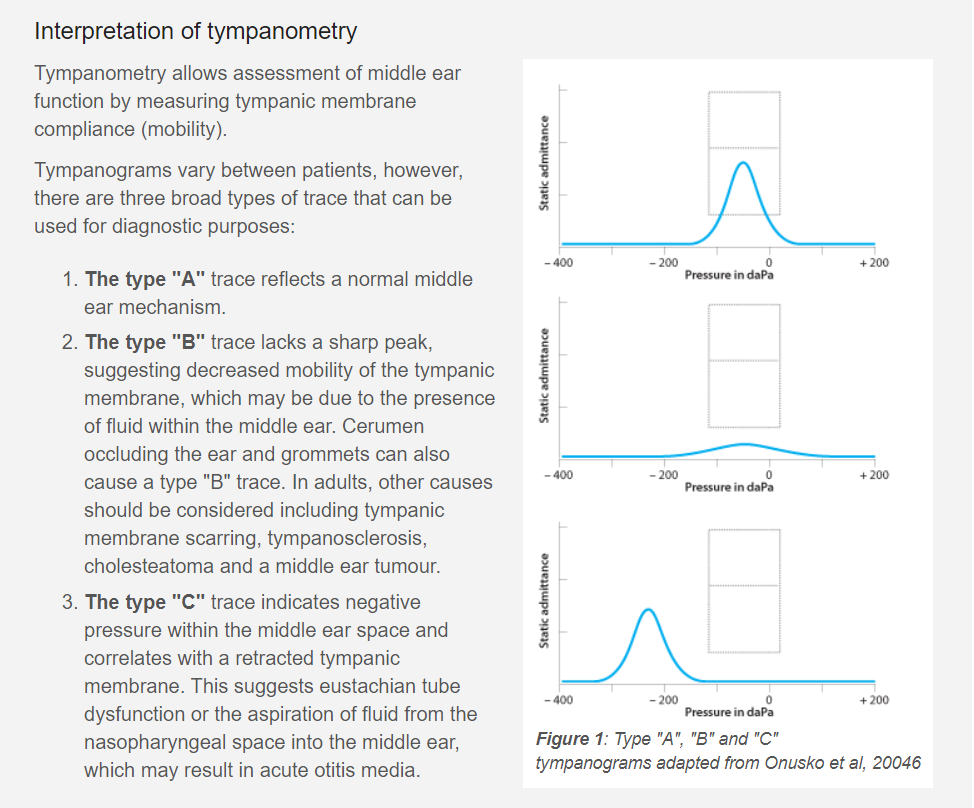
Type A: A normal tympanogram, characterized by a distinct peak near 0 daPa, indicates healthy middle ear function and normal eardrum mobility.
-
Type B: A flat curve with no distinct peak suggests reduced eardrum mobility, often indicative of middle ear fluid (otitis media with effusion) or a perforated eardrum. The ear canal volume helps differentiate these two.
-
Type C: A curve with a peak shifted to the negative pressure range (e.g., -100 daPa or more negative) suggests negative middle ear pressure, often associated with Eustachian tube dysfunction or resolving middle ear infection.
-
Type Ad (Deep): A Type A curve with an exceptionally high peak, suggesting a hypermobile eardrum, potentially due to ossicular discontinuity (a break in the middle ear bones).
-
Type As (Shallow): A Type A curve with a very shallow peak, indicating reduced eardrum mobility, often seen in otosclerosis (stiffening of the ossicles).
By analyzing these characteristics—peak pressure, compliance, and ear canal volume—clinicians can accurately diagnose middle ear pathologies, guiding appropriate treatment plans and monitoring disease progression or resolution. The objective nature of this technological output is invaluable, especially when examining infants or non-cooperative patients where subjective audiometry is challenging.
Evolution and Future of Tympanometric Technology
The journey of tympanometry from its conceptualization to its current sophisticated form reflects broader trends in medical device technology: a drive towards greater accuracy, portability, and integration with digital health ecosystems.
From Analog to Digital: Advancements in Accuracy and Portability
Early tympanometers were bulky, often analog devices, requiring manual calibration and graphical interpretation. The transition to digital electronics marked a significant leap forward. Digital signal processing enhanced accuracy, reduced noise, and allowed for more complex algorithms to be implemented. Microprocessor control led to greater automation of the test procedure, improving repeatability and reducing operator variability.
Key advancements include:
-
Miniaturization: Modern tympanometers range from compact, handheld units ideal for screening, to robust clinical devices, all significantly smaller and lighter than their predecessors. This portability is crucial for expanding diagnostic reach.
-
Improved User Interfaces: Touchscreens, intuitive software, and immediate graphical display of results have made tympanometers easier to operate and interpret, even for less specialized personnel.
-
Enhanced Data Management: Digital storage capabilities, USB connectivity, and wireless integration with Electronic Health Records (EHRs) have streamlined data management, reducing paperwork and improving the accessibility of patient data.
-
Higher-Frequency Probes: The development of 1000 Hz probe tones has dramatically improved the accuracy of tympanometry in neonates and young infants, whose middle ear mechanics respond differently to lower frequencies. This technological adaptation has made tympanometry a universal tool across age groups.
Emerging Trends: AI, Telehealth, and Enhanced Diagnostics
The future of tympanometric technology is poised for even more transformative changes, driven by advancements in artificial intelligence and the expanding reach of telehealth.
-
AI and Machine Learning for Automated Interpretation: One of the most promising areas is the application of AI and machine learning algorithms to automatically interpret tympanogram curves. AI could potentially analyze subtle patterns that human eyes might miss, offer diagnostic probabilities, or even predict the likelihood of certain conditions based on patient demographics and past medical history. This could assist clinicians, particularly in high-volume settings or for less experienced users, and reduce inter-observer variability.
-
Integration with Telehealth Platforms: Portable tympanometers with integrated cameras (oto-endoscopes) are already being used in remote settings. Future developments will likely see more seamless integration of tympanometry data into telehealth platforms, allowing for remote diagnostics and monitoring by specialists situated miles away. Patients could perform self-tests or be guided by remote practitioners, expanding access to care in underserved areas.
-
Multi-Modal Diagnostics: Tympanometry is rarely used in isolation. It’s often paired with audiometry (hearing tests) and otoacoustic emissions (OAEs). Future technological advancements will likely lead to integrated devices that can perform multiple diagnostic tests simultaneously, offering a more comprehensive picture of auditory health in a single, streamlined process. This integration, powered by robust data analytics, could lead to more nuanced and precise diagnoses.
-
Wearable and Home-Use Devices: While still in nascent stages, the concept of wearable or home-use tympanometers for chronic condition monitoring (e.g., recurrent otitis media in children) is gaining traction. Such devices, leveraging smartphone connectivity and cloud-based analytics, could empower parents and patients to track middle ear health proactively.
The Impact of Tympanogram Technology on Patient Care
The evolution and refinement of tympanometric technology have had a profound and positive impact on patient care, fundamentally changing how middle ear health is assessed and managed.
Non-Invasive and Objective Assessment
One of the greatest benefits of the tympanogram is its non-invasive nature. The test involves placing a soft probe tip in the ear canal and lasts only a few seconds, causing minimal discomfort. This makes it ideal for patients of all ages, from newborns to the elderly, particularly those who cannot or will not cooperate with subjective hearing tests. For instance, testing an infant’s hearing often involves OAEs and tympanometry, as these objective measures do not require the child’s active participation or response. The objective data it provides removes the guesswork inherent in relying solely on patient symptoms or a visual examination, especially in ambiguous cases.
Precision in Diagnosis and Treatment Planning
The detailed, quantitative data derived from a tympanogram allows for highly precise diagnoses. Knowing the exact middle ear pressure, the degree of eardrum mobility, and the ear canal volume provides critical information that guides treatment decisions. For example, distinguishing between a blocked Eustachian tube, middle ear fluid, or a perforated eardrum dictates vastly different clinical approaches, from watchful waiting to medication or surgical intervention. Moreover, tympanometry allows clinicians to monitor the effectiveness of treatments, observing the return to normal middle ear function over time, thus optimizing patient outcomes.

Accessibility and Global Health Implications
As tympanometric technology becomes more portable, affordable, and user-friendly, its reach extends beyond well-equipped audiology clinics. Handheld versions and those integrated with smartphones are enabling healthcare workers in remote or underserved areas to perform essential middle ear screenings. This increased accessibility is vital for early detection of hearing impairments and middle ear infections, particularly in pediatric populations where untreated conditions can lead to significant developmental delays. By democratizing access to this critical diagnostic tool, technology empowers global health initiatives, bringing fundamental healthcare closer to those who need it most.
In conclusion, the tympanogram is far more than a simple medical test. It stands as a powerful testament to technological innovation in healthcare, seamlessly blending principles of acoustics, engineering, and digital processing. From the sophisticated mechanics of the tympanometer to the intricate software that translates raw data into actionable insights, every aspect of tympanometry underscores its vital role in modern audiology. As we look to the future, the ongoing evolution of this technology, driven by AI and telehealth, promises to further enhance its precision, accessibility, and ultimately, its profound impact on patient care worldwide.
aViewFromTheCave is a participant in the Amazon Services LLC Associates Program, an affiliate advertising program designed to provide a means for sites to earn advertising fees by advertising and linking to Amazon.com. Amazon, the Amazon logo, AmazonSupply, and the AmazonSupply logo are trademarks of Amazon.com, Inc. or its affiliates. As an Amazon Associate we earn affiliate commissions from qualifying purchases.