
In the dynamic world of financial markets, understanding the basic building blocks is crucial for anyone looking to invest, whether for long-term wealth building or short-term trading. At the heart of this understanding lies the “stock quote.” Far more than just a simple number, a stock quote is a real-time snapshot of a company’s shares in the marketplace, packed with essential data points that convey its value, recent trading activity, and prevailing market sentiment. For the uninitiated, it might appear as a bewildering array of digits and abbreviations. However, for the astute investor, it is a concise, data-rich report, an indispensable tool for making informed decisions.
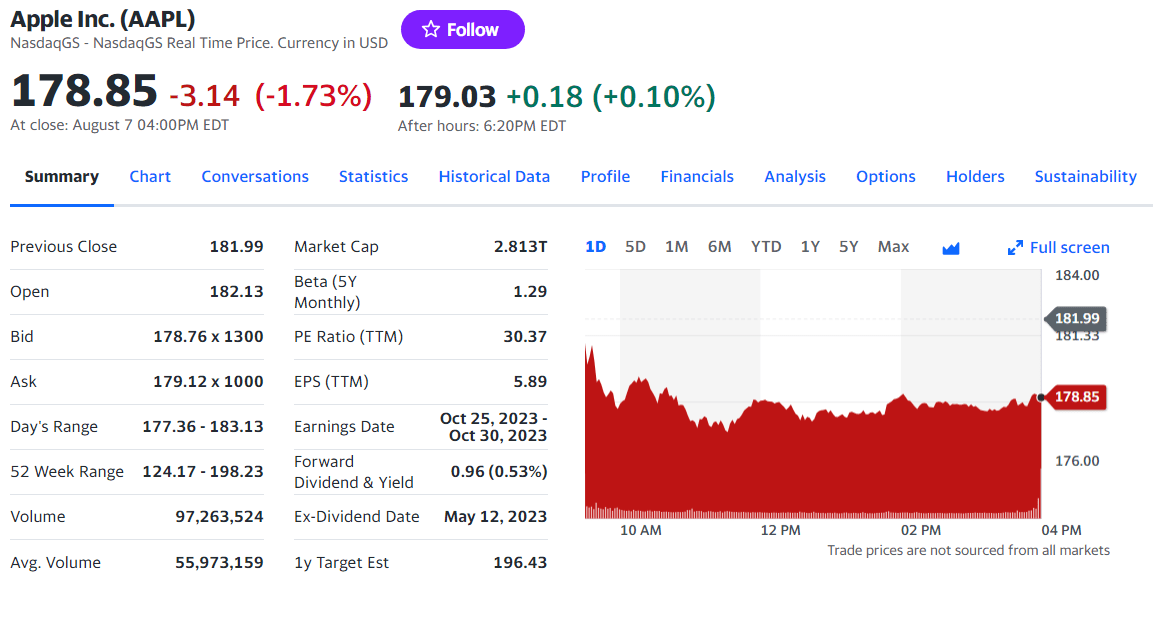
A stock quote acts as a primary communication channel between a company’s performance, investor interest, and the broader economic landscape. It reflects the constant interplay of supply and demand, influenced by everything from company earnings reports and industry trends to global economic shifts and geopolitical events. Mastering the art of reading and interpreting a stock quote is not merely about deciphering numbers; it’s about gaining a deeper insight into the pulse of the market and the potential trajectory of your investments. This comprehensive guide will demystify the stock quote, breaking down its various components, explaining where to find them, and illuminating how to use this vital information to navigate your financial journey with greater confidence and insight.
The Anatomy of a Stock Quote: Decoding the Data
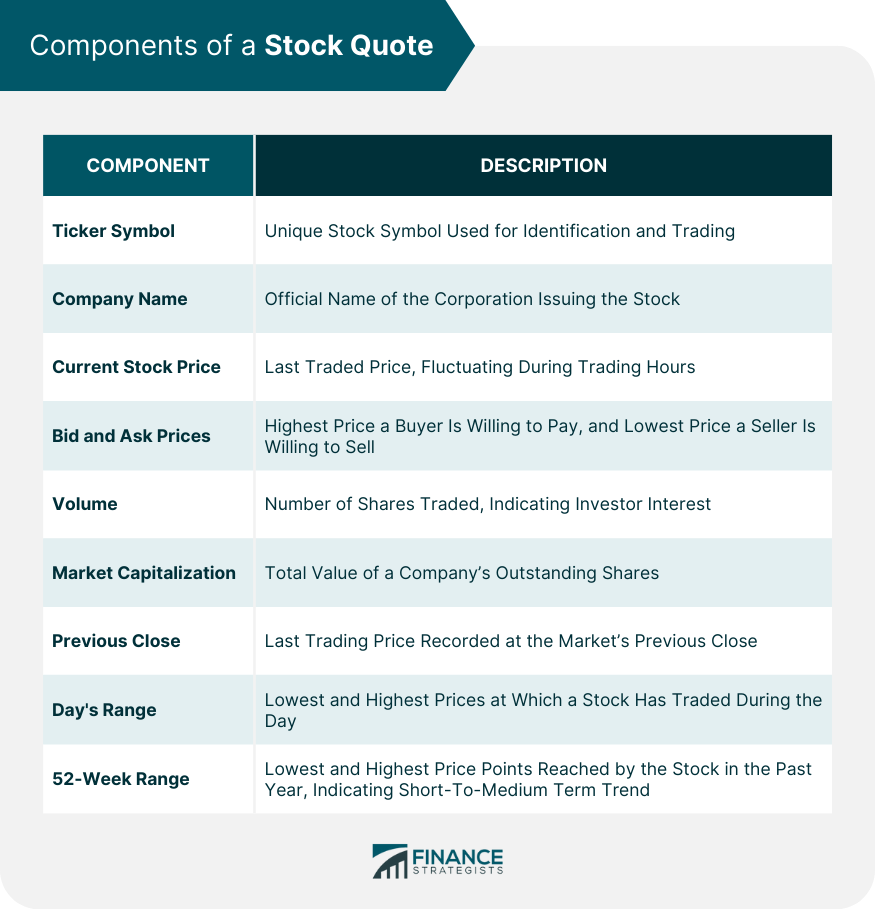
A stock quote is a sophisticated aggregation of real-time and historical data that provides a comprehensive overview of a security’s trading activity and valuation. Each component serves a distinct purpose, collectively painting a detailed picture for investors. Understanding these elements is the first step towards intelligent investing.
Ticker Symbol
Every publicly traded company is assigned a unique, abbreviated identifier known as a ticker symbol. This 1-5 character code (e.g., AAPL for Apple Inc., MSFT for Microsoft Corp., TSLA for Tesla Inc.) is universally recognized and allows investors to quickly locate specific stocks across various trading platforms and financial news sites. It’s the stock’s fingerprint in the market, making it easy to track and trade.
Last Price (Current Price)
This is perhaps the most prominent number on any stock quote. The “last price” represents the price at which the most recent trade for that particular stock was executed. It is the immediate reference point for a stock’s value, constantly fluctuating throughout the trading day as buy and sell orders are matched. For long-term investors, it indicates the current market valuation; for day traders, it’s a critical real-time data point for entry and exit strategies.
Bid and Ask Prices
The bid and ask prices offer a glimpse into the immediate supply and demand dynamics for a stock.
-
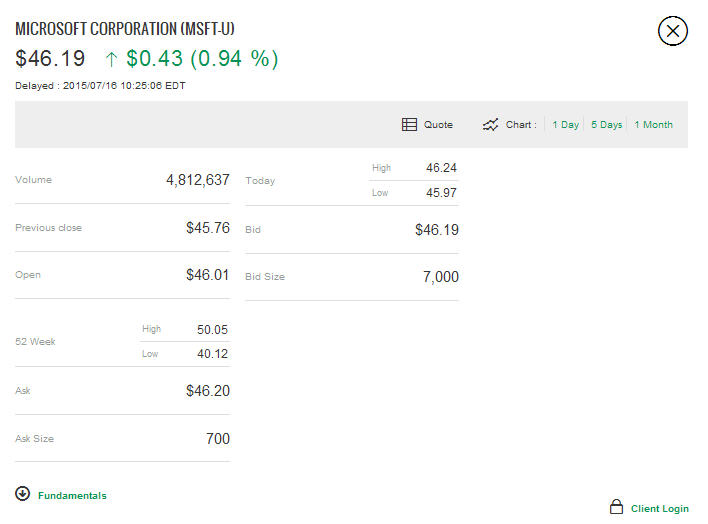
Bid Price: This is the highest price a buyer is currently willing to pay for a stock.
-
Ask Price (Offer Price): This is the lowest price a seller is currently willing to accept for a stock.
The difference between the bid and ask price is known as the “spread,” which represents the profit margin for market makers and a cost of trading for investors. A narrow spread generally indicates a highly liquid stock, while a wide spread can suggest lower liquidity or higher volatility.
Daily High and Low
These two figures represent the highest and lowest prices at which a stock has traded during the current trading day. They provide context for the day’s trading range, indicating the stock’s volatility and how much its price has fluctuated within a 24-hour period. A wide range might suggest significant investor interest or reaction to news, while a narrow range indicates stability.
Volume
Volume refers to the total number of shares of a particular stock that have been traded during the current trading day. High trading volume often signifies strong investor interest and liquidity, meaning it’s easier to buy or sell shares without significantly impacting the price. Conversely, low volume might suggest less interest or difficulty in executing large orders. Volume is often analyzed in conjunction with price movements to confirm trends.
Open and Close Prices
-
Open Price: The price at which a stock begins trading at the start of the trading day. This can be influenced by pre-market trading activity and any news released before the market officially opens.
-
Previous Close: The final price at which a stock traded at the end of the prior trading day. This serves as a crucial benchmark for evaluating the current day’s performance.
Change and Percentage Change
These figures illustrate how much a stock’s price has moved since the previous closing price.
-
Change: The absolute dollar amount of the price increase or decrease.
-
Percentage Change: The percentage equivalent of the price change, often a more useful metric for comparing performance across different stocks, regardless of their absolute price.
Market Capitalization
Market capitalization, or “market cap,” is the total value of a company’s outstanding shares. It’s calculated by multiplying the current share price by the total number of shares outstanding. This metric helps categorize companies into large-cap, mid-cap, and small-cap, influencing investment strategies and risk profiles. A large market cap often suggests a stable, established company, while smaller caps can offer higher growth potential but also higher risk.
P/E Ratio (Price-to-Earnings Ratio)
The P/E ratio is a fundamental valuation metric, calculated by dividing the current share price by the company’s earnings per share (EPS) over a specific period (usually the last 12 months). It indicates how much investors are willing to pay for each dollar of a company’s earnings. A high P/E ratio might suggest investors expect high future growth, while a low P/E might indicate a company is undervalued or has limited growth prospects. It’s best used when comparing companies within the same industry.
Dividend Yield
For income-focused investors, the dividend yield is a critical component. It represents the annual dividend payment per share as a percentage of the current share price. A higher dividend yield indicates a greater return on investment from dividends alone, though it’s important to consider the sustainability of those dividends.
Where to Find and How to Interpret Stock Quotes
Accessing and understanding stock quotes is easier than ever, thanks to a plethora of digital tools and resources. However, merely looking at the numbers isn’t enough; true insight comes from interpreting them within a broader context.
Financial Websites and Platforms
The most common places to find stock quotes are leading financial websites and brokerage platforms. Services like Google Finance, Yahoo Finance, Bloomberg, Reuters, and dedicated sections of major news outlets (e.g., The Wall Street Journal, Financial Times) offer real-time or slightly delayed quotes. Brokerage platforms (e.g., Fidelity, Schwab, E*TRADE) provide seamless access to quotes directly within their trading interfaces, often with advanced charting and analytical tools. Mobile apps from these providers also make monitoring quotes on the go highly convenient.
Real-Time vs. Delayed Quotes
It’s crucial for investors to distinguish between real-time and delayed quotes.
-
Real-Time Quotes: These display prices as trades happen, typically available through brokerage accounts or premium financial data services. They are essential for active traders who need instantaneous information to execute timely trades.
-
Delayed Quotes: Often found on free financial websites, these quotes typically have a delay of 15-20 minutes. While sufficient for long-term investors who aren’t making split-second decisions, they can be misleading for those attempting to trade based on current market conditions. Always check the timestamp associated with a quote to ascertain its timeliness.
Using Quotes for Investment Decisions
A stock quote is a rich tapestry of data that, when woven together, tells a story about a company and its stock.
-
Identifying Trends: Observing the daily high/low, change, and volume over several days or weeks can help identify price trends (upward, downward, or sideways consolidation).
-
Assessing Volatility: The daily range and historical volatility indicators can help gauge how much a stock’s price typically fluctuates. This is crucial for understanding risk.
-
Valuation Comparison: Using metrics like P/E ratio and dividend yield, investors can compare a stock against its industry peers or its historical averages to determine if it’s potentially undervalued or overvalued.
-
Liquidity Check: High volume signals good liquidity, meaning you can generally buy or sell shares without causing a significant price impact. This is important for larger investments or for situations where you might need to exit a position quickly.
The Role of News and Events
Stock quotes are highly reactive to news and events. An unexpected earnings beat or miss, a major product launch, a leadership change, regulatory announcements, or even broader economic data (like inflation reports or interest rate decisions) can cause significant, immediate shifts in a stock’s price and volume. Savvy investors don’t just look at the numbers; they connect those numbers to the narratives unfolding around the company and the market. Integrating news analysis with quote interpretation provides a more holistic view of a stock’s short-term movements and long-term potential.
Beyond the Basics: Advanced Metrics and Their Significance
While the core components of a stock quote provide a solid foundation, several other advanced metrics offer deeper insights, allowing for more nuanced analysis and informed investment strategies.
52-Week High/Low
This pair of figures represents the highest and lowest prices at which a stock has traded over the past 52 weeks (one year). The 52-week high/low offers a broad perspective on a stock’s long-term price range and helps gauge its historical volatility and perceived value. A stock trading near its 52-week high might indicate strong positive momentum, while one near its 52-week low could signal a significant downturn or a potential buying opportunity if fundamentals remain strong.
Beta
Beta is a measure of a stock’s volatility relative to the overall market. The market (typically represented by an index like the S&P 500) has a beta of 1.0.
-
A stock with a beta greater than 1.0 (e.g., 1.5) is considered more volatile than the market, meaning its price tends to move 1.5 times as much as the market.
-
A stock with a beta less than 1.0 (e.g., 0.7) is considered less volatile, moving 0.7 times as much as the market.
Beta is a useful tool for portfolio diversification and risk management, helping investors understand how a particular stock might contribute to the overall risk profile of their holdings.
Earnings Per Share (EPS)
EPS is a key profitability metric, calculated by dividing a company’s net earnings by its number of outstanding shares. It indicates how much profit a company makes for each share of its stock. Strong and consistently growing EPS is often a hallmark of a healthy and profitable company. Investors frequently compare current EPS with historical EPS and analyst estimates to gauge a company’s financial performance and future prospects.
Analyst Ratings
Many financial platforms include analyst ratings, which are recommendations (e.g., Buy, Hold, Sell, Outperform) from professional financial analysts who cover the stock. These ratings are based on extensive research into the company’s financials, industry outlook, and management. While they can offer valuable insights, investors should treat analyst ratings as just one data point among many, conducting their own due diligence, as analysts’ opinions can differ and are not infallible.
Ex-Dividend Date and Record Date
For investors focused on dividends, these dates are crucial:
-
Ex-Dividend Date: This is the date on or after which a stock trades without the right to its next dividend payment. If you buy the stock on or after the ex-dividend date, you will not receive the upcoming dividend.
-
Record Date: This is the date on which a company determines which shareholders are eligible to receive the dividend. To receive the dividend, you must be a shareholder of record as of this date.
Understanding these dates is essential for timing dividend-related trades and ensuring you receive anticipated income.
The Psychology and Dynamics Behind Stock Price Fluctuations
Stock quotes are not static; they are in constant motion, reflecting a complex interplay of quantifiable data and intangible human factors. Understanding these underlying dynamics is crucial for discerning the true narrative behind the numbers.
Supply and Demand
At its core, a stock’s price is determined by the fundamental economic principles of supply and demand. When more investors want to buy a stock than sell it, demand exceeds supply, driving the price up. Conversely, when more investors want to sell than buy, supply outweighs demand, pushing the price down. All other factors, from company news to economic data, ultimately filter down to influence this delicate balance.
Investor Sentiment
Human emotions, particularly fear and greed, play a significant role in short-term price movements. Optimistic sentiment (greed) can lead to speculative buying, driving prices beyond fundamental value, while pessimistic sentiment (fear) can trigger panic selling, causing sharp declines. Technical analysts often study patterns in stock quotes and trading volumes to gauge investor sentiment and predict potential shifts.
Economic Indicators
Broader macroeconomic conditions heavily influence stock prices. Indicators such as Gross Domestic Product (GDP) growth, inflation rates, employment figures, and interest rate decisions by central banks can affect corporate profitability, consumer spending, and investor confidence, thereby impacting stock valuations across the board. For instance, rising interest rates can make bonds more attractive relative to stocks, or increase borrowing costs for companies, potentially leading to lower stock prices.
Company-Specific News
Individual company performance and news releases are powerful drivers of a stock’s quote. Quarterly earnings reports, product innovation announcements, mergers and acquisitions, changes in leadership, legal battles, or even a sudden shift in regulatory policy can cause dramatic price swings. The market reacts swiftly to new information, repricing the stock based on its perceived impact on future earnings and growth.
Market Efficiency and Random Walk Theory
Academic theories like the Efficient Market Hypothesis (EMH) suggest that all available information is already reflected in stock prices, making it impossible to consistently “beat” the market through fundamental or technical analysis. The Random Walk Theory, often associated with EMH, posits that stock price changes are random and unpredictable. While these theories spark debate, they highlight the challenge of short-term prediction and underscore the importance of long-term fundamental analysis for many investors. Stock quotes, in this context, are a reflection of the market’s collective, instantaneous judgment on all known information.
Leveraging Stock Quotes for Informed Investing
Mastering the intricacies of a stock quote is not an end in itself, but a powerful means to an end: making more informed and ultimately more successful investment decisions. The data embedded within these quotes can be leveraged in various strategic ways.
Setting Up Watchlists
One of the simplest yet most effective uses of stock quotes is to create and maintain watchlists. A watchlist is a curated list of stocks you are interested in tracking, allowing you to monitor their price movements, volume, and other key metrics without committing capital. This practice helps you identify potential investment opportunities, observe how stocks react to news, and develop a deeper understanding of specific companies or industries over time. Most brokerage platforms and financial websites offer robust watchlist functionalities.
Technical Analysis Basics
While a deep dive into technical analysis is beyond the scope of merely reading a stock quote, understanding the basics can be immensely helpful. Technical analysts primarily use historical price and volume data, as found in stock quotes, to identify patterns and predict future price movements. Concepts like support and resistance levels (price points where buying or selling pressure is expected to be strong), moving averages (average price over a set period), and trend lines are all derived from the data within stock quotes. Even for fundamental investors, a basic understanding of these technical indicators can provide context for current price action.
Fundamental Analysis Insights
Stock quotes provide critical data points for fundamental analysis, which involves evaluating a company’s intrinsic value by examining its financial statements, management, industry, and economic health. Metrics like the P/E ratio, EPS, dividend yield, and market capitalization, all directly available or derivable from a stock quote, are cornerstone elements of fundamental analysis. By comparing these figures against industry averages, historical trends, and competitor data, investors can assess whether a stock is trading at a fair value, is overvalued, or presents an attractive buying opportunity based on its underlying business strength.
Risk Management
Understanding the components of a stock quote also plays a vital role in risk management. Beta helps assess a stock’s volatility relative to the market, allowing you to balance your portfolio with less volatile assets if you are risk-averse. Observing the daily high/low and the 52-week range provides a sense of a stock’s historical price fluctuations, helping investors gauge the potential downside risk. Volume data can indicate liquidity risk – if a stock has very low volume, it might be difficult to sell a large position quickly without impacting the price significantly. Integrating these insights into your investment strategy helps mitigate potential losses and align your holdings with your personal risk tolerance.
In conclusion, a stock quote is far more than a fleeting numerical display; it is a compact, information-rich dashboard for any investor. From the simple ticker symbol to advanced metrics like beta and P/E ratios, each element contributes to a comprehensive picture of a company’s market standing and future prospects. By diligently learning to read, interpret, and leverage these quotes, investors gain a powerful tool for navigating the complex financial landscape, enabling them to make more educated decisions, manage risk effectively, and ultimately work towards achieving their financial goals with greater confidence. The journey to becoming a savvy investor begins with understanding this fundamental unit of market information.
aViewFromTheCave is a participant in the Amazon Services LLC Associates Program, an affiliate advertising program designed to provide a means for sites to earn advertising fees by advertising and linking to Amazon.com. Amazon, the Amazon logo, AmazonSupply, and the AmazonSupply logo are trademarks of Amazon.com, Inc. or its affiliates. As an Amazon Associate we earn affiliate commissions from qualifying purchases.