
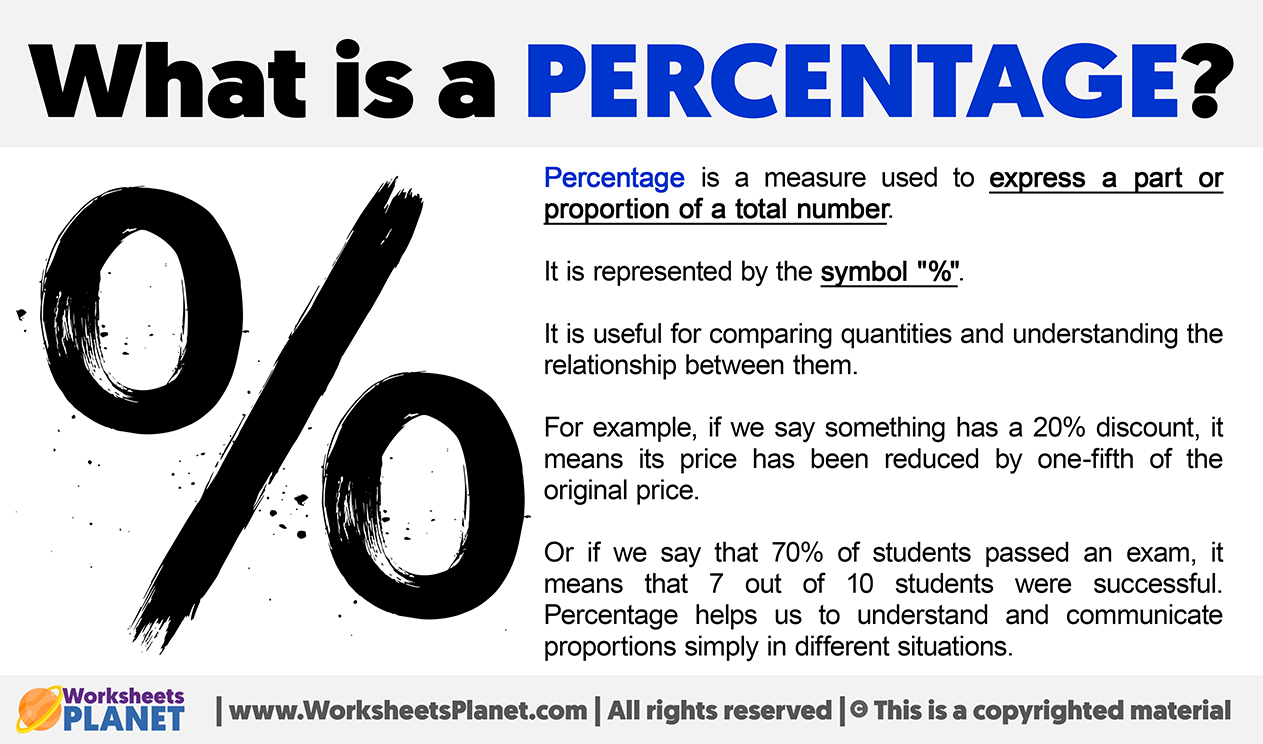
In the intricate world of money, numbers tell a story, but percentages provide the crucial context. Understanding “what is a percentage of what” is not merely a mathematical exercise; it’s a fundamental pillar of financial literacy, enabling individuals and businesses alike to make informed decisions, assess performance, and strategize for the future. At its core, a percentage is a way to express a number as a fraction of 100, effectively defining a specific portion relative to a whole. This simple yet powerful concept allows for standardized comparisons across vastly different financial scales, from personal budgets to multi-billion-dollar investment portfolios. Without this tool, the true impact of an interest rate, a sales discount, a profit margin, or a market share would remain obscure, hindering effective financial management and strategic planning.
The Foundational Role of Percentages in Financial Comprehension
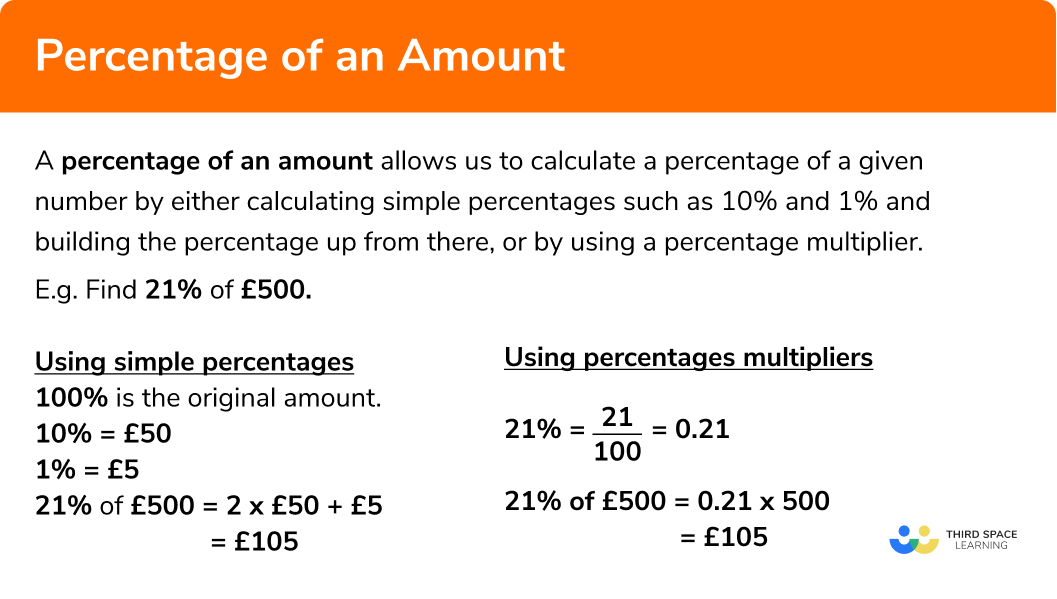
To grasp any financial scenario involving percentages, one must first identify two critical components: the “part” and the “whole.” A percentage calculation always asks, “What fraction of this total (the whole) does this specific amount (the part) represent?” This relationship, expressed as (Part / Whole) * 100, unlocks a universal language for comparing and analyzing financial data.
Deciphering the Basics: Part, Whole, and Rate
Consider a simple example: if you spend $500 on rent from a monthly income of $2,500, the rent is the “part,” and your income is the “whole.” The percentage calculation ($500 / $2,500) * 100 = 20% immediately tells you that 20% of your income is allocated to rent. This “rate” of 20% is more insightful than just knowing the absolute dollar amount, as it provides a proportional understanding regardless of your income level. It allows for quick comparisons to financial benchmarks or personal spending goals.
Why 100? The Universal Standard
The choice of 100 as the denominator is what makes percentages so powerful. By standardizing every comparison to a base of 100, percentages eliminate the need to grapple with unwieldy fractions or disparate totals. Whether comparing a 5% return on a $1,000 investment to a 5% return on a $100,000 investment, the proportional increase is immediately clear. This universality simplifies complex financial data, making it accessible and actionable for a broader audience, from seasoned investors to first-time budgeters.
Percentages in Personal Finance: Steering Your Economic Ship
For individuals, percentages are the compass and map for navigating daily financial decisions. They are crucial for budgeting, managing debt, growing savings, and making everyday purchasing choices. Mastering “what percentage of what” in personal finance empowers better control over one’s financial destiny.
Budgeting and Expense Tracking: The 50/30/20 Rule and Beyond
A cornerstone of personal finance is budgeting, where percentages shine. Popular frameworks like the 50/30/20 rule (50% of income for needs, 30% for wants, 20% for savings and debt repayment) are entirely built on percentage allocations. Here, your net income is the “whole,” and each spending category is a “part.” By tracking what percentage of your income goes to housing, groceries, entertainment, or debt, you gain a clear picture of your financial habits. If housing consumes 40% of your income, you immediately know it’s a significant slice of your financial pie, prompting potential adjustments to align with your financial goals or industry benchmarks for affordability.
Understanding Loan Interest and Savings Growth
Loans and savings accounts heavily rely on percentages. An Annual Percentage Rate (APR) on a loan or a credit card represents the annual cost of borrowing money as a percentage of the principal (the “whole”). Conversely, an Annual Percentage Yield (APY) on a savings account or certificate of deposit (CD) tells you the annual rate of return on your deposits, including the effect of compounding interest. Knowing that your loan has an APR of 15% means you’ll pay 15% of your outstanding balance in interest over a year, significantly impacting the total cost of borrowing. Similarly, a savings account with a 2% APY means your money will grow by 2% of its total balance each year, highlighting the power of compounding over time.
Discounts, Sales Tax, and Tips: Everyday Calculations
From the checkout line to dining out, percentages are omnipresent. A 25% discount means you save 25% of the original price (the “whole”). Sales tax, often expressed as a percentage, is added to the purchase price. When tipping, you typically calculate a percentage (e.g., 15-20%) of the total bill. These daily calculations reinforce the practical application of percentages in managing your spending and ensuring you pay the correct amount.
Percentages in Investing: Evaluating Opportunities and Risks
For investors, percentages are indispensable tools for analyzing performance, allocating assets, and understanding the cost associated with various investment vehicles. They provide a standardized metric to compare apples and oranges across diverse investment types and timeframes.
Return on Investment (ROI) and Capital Gains
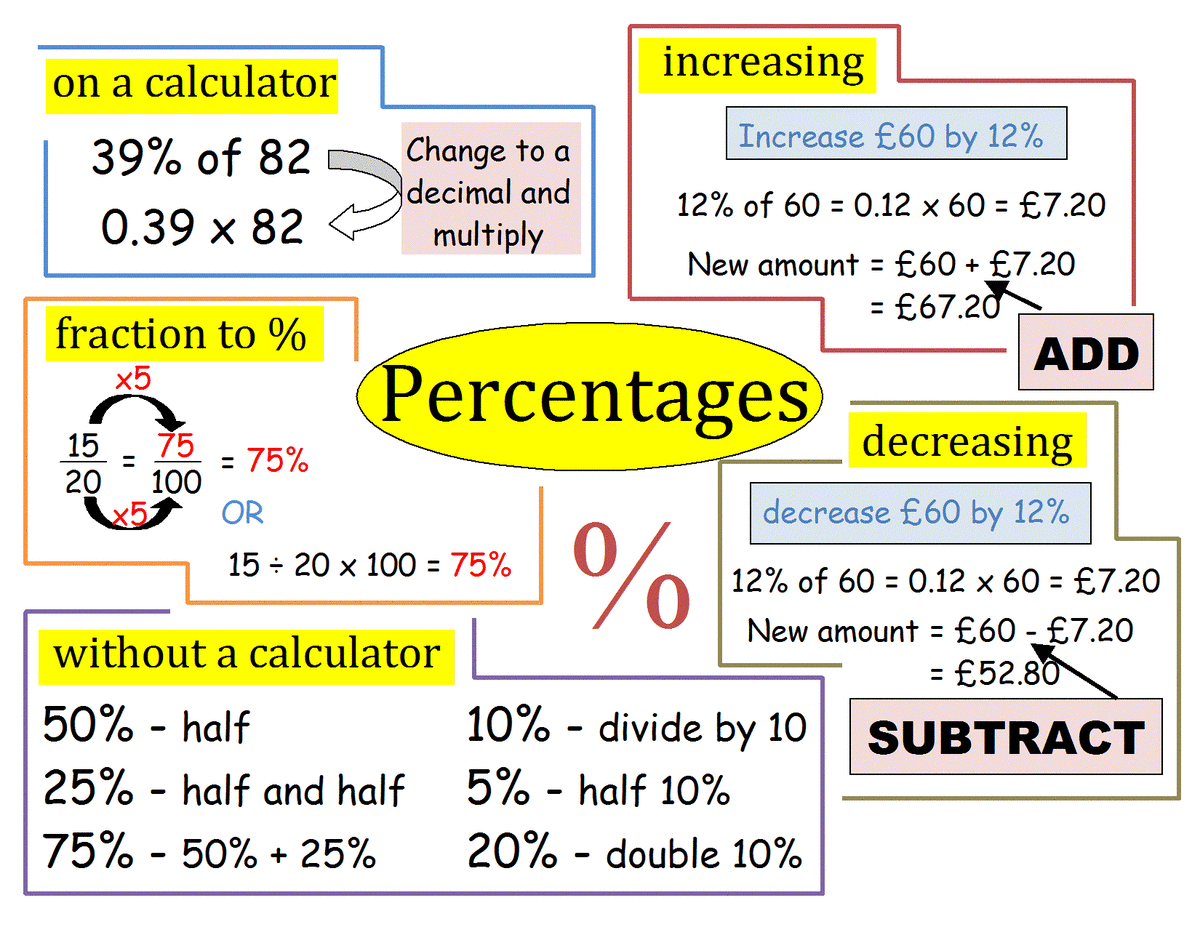
Perhaps the most critical percentage for investors is Return on Investment (ROI). ROI quantifies the profitability of an investment as a percentage of its initial cost. If you invest $1,000 (the “whole”) and it grows to $1,200, your gain is $200 (the “part”). Your ROI is ($200 / $1,000) * 100 = 20%. This metric allows investors to compare the effectiveness of different investments regardless of their absolute dollar value. Capital gains, often taxed at different rates, are also calculated as a percentage increase in an asset’s value from its purchase price.
Portfolio Allocation and Diversification
Diversification is key to managing investment risk, and percentages guide this strategy. Investors allocate their portfolio across different asset classes (e.g., stocks, bonds, real estate) or geographies using percentages. A common strategy might be 60% stocks and 40% bonds. Here, the total value of your portfolio is the “whole,” and the value of each asset class is a “part.” These percentages help maintain a desired risk profile and ensure that no single investment constitutes an overly dominant portion of the overall portfolio, thereby spreading risk.
Understanding Yields, Dividends, and Expense Ratios
Various other percentages are critical in investing:
-
Dividend Yield: The annual dividend payments per share divided by the share’s current price, expressed as a percentage. It tells investors what percentage of a stock’s price they receive back in dividends annually.
-
Bond Yield: The annual interest payment relative to the bond’s current market price. This percentage helps compare the income-generating potential of different bonds.
-
Expense Ratios: For mutual funds and ETFs, this is the annual percentage of your investment that goes towards operating expenses. A 0.5% expense ratio means 0.5% of your fund’s value is deducted annually to cover management and administrative costs, directly impacting your net returns.
Percentages in Business Finance: Driving Growth and Profitability
For businesses, from startups to multinational corporations, percentages are vital for measuring operational efficiency, financial health, market position, and strategic performance. They enable stakeholders to quickly ascertain the story behind the numbers.
Profit Margins and Revenue Growth
Key performance indicators (KPIs) in business often revolve around percentages. Profit margins—gross profit margin, operating profit margin, and net profit margin—express profit as a percentage of revenue (the “whole”). A company with a 15% net profit margin retains 15 cents of profit for every dollar of revenue, signaling its efficiency and profitability. Revenue growth, calculated as the percentage increase in revenue over a period, indicates a company’s ability to expand its sales. If revenue grew from $1 million to $1.2 million, that’s a 20% growth rate ($200,000 / $1,000,000 * 100), a clear indicator of market traction and success.
Market Share and Competitive Analysis
Understanding a business’s position within its industry is often done through market share, expressed as a percentage. If a company’s sales account for $10 million in an industry with $100 million in total sales, its market share is 10%. This percentage is crucial for competitive analysis, strategic planning, and understanding a company’s influence and potential for expansion. Similarly, customer retention rates (percentage of customers retained over a period) and customer acquisition costs (often relative to customer lifetime value) are critical percentage-based metrics.
Debt-to-Equity Ratios and Financial Health
Financial ratios, almost universally expressed as percentages or decimals that can be converted to percentages, provide insights into a company’s financial health and risk profile. The debt-to-equity ratio, for instance, compares a company’s total liabilities to its shareholder equity. While not always a percentage directly, its interpretation often involves understanding what percentage of funding comes from debt versus equity. Banks and investors use these ratios to assess a company’s ability to meet its obligations and its overall financial stability.
The Pitfalls and Power of Percentage Interpretation
While percentages are incredibly powerful, their misinterpretation can lead to flawed conclusions. It’s crucial to understand the nuances, especially when comparing changes or evaluating different bases.
Percentage Points vs. Percentage Change
One of the most common pitfalls is confusing “percentage points” with “percentage change.” If an interest rate increases from 4% to 5%, that is an increase of 1 percentage point. However, the percentage change in the interest rate is (5-4)/4 * 100 = 25%. This distinction is vital in finance, as a small percentage point change can represent a significant percentage change in the underlying quantity, leading to vastly different impacts on costs or returns.
Context is King: What Numbers Are Being Compared?
Always ask, “a percentage of what?” The denominator (the “whole”) defines the context and meaning of the percentage. A 10% increase in a small base amount might be negligible, while a 1% increase in a massive base amount could represent billions of dollars. For example, a country’s national debt might increase by 2%, but if the initial debt was trillions, that 2% is a substantial figure. Conversely, a startup might boast 100% revenue growth, but if its initial revenue was minimal, the absolute dollar increase might still be modest. Without understanding the base, percentages can be misleading.
In conclusion, “what is a percentage of what” is the foundational question underpinning virtually every financial calculation and analysis. From the personal budget you set for groceries to the intricate financial statements of a Fortune 500 company, percentages provide the necessary context, comparability, and clarity to make sense of the monetary world. Mastering this concept is not just about crunching numbers; it’s about gaining a deeper understanding of financial relationships, enabling better decision-making, and ultimately fostering greater financial wisdom.
aViewFromTheCave is a participant in the Amazon Services LLC Associates Program, an affiliate advertising program designed to provide a means for sites to earn advertising fees by advertising and linking to Amazon.com. Amazon, the Amazon logo, AmazonSupply, and the AmazonSupply logo are trademarks of Amazon.com, Inc. or its affiliates. As an Amazon Associate we earn affiliate commissions from qualifying purchases.