In the vast landscape of data-driven technology, understanding the distribution and central tendencies of datasets is paramount. While mean and median often take center stage, the mode offers a unique perspective, identifying the most frequently occurring value or category within a dataset. When data is grouped into intervals or classes, this concept extends to the “modal class” – the class interval that contains the highest frequency of data points. For tech professionals, from data scientists and software engineers to product managers and UX designers, grasping the implications of the modal class is crucial for making informed decisions, optimizing systems, and developing more intelligent applications.

Foundations of Data Understanding: The Mode and Modal Class
To appreciate the significance of a modal class, one must first understand its statistical roots. Data, in its rawest form, often presents a chaotic picture. Statistical measures like measures of central tendency (mean, median, mode) and dispersion (range, variance, standard deviation) help bring order, revealing patterns and insights that drive technological innovation.
Beyond the Average: Why the Mode Matters
The mean (average) is susceptible to outliers, while the median represents the middle value, robust against extreme values. The mode, however, tells a different story: it identifies the peak of the data distribution, highlighting the most common or popular occurrence. In technology, this translates directly to understanding prevalence—what is the most common operating system used by an app’s users? What is the most frequently triggered error code in a server log? What is the typical age range of users interacting with a specific feature? These insights, not always obvious from an average, are critical for focused development and targeted problem-solving.
Grouping Data: The Role of Class Intervals
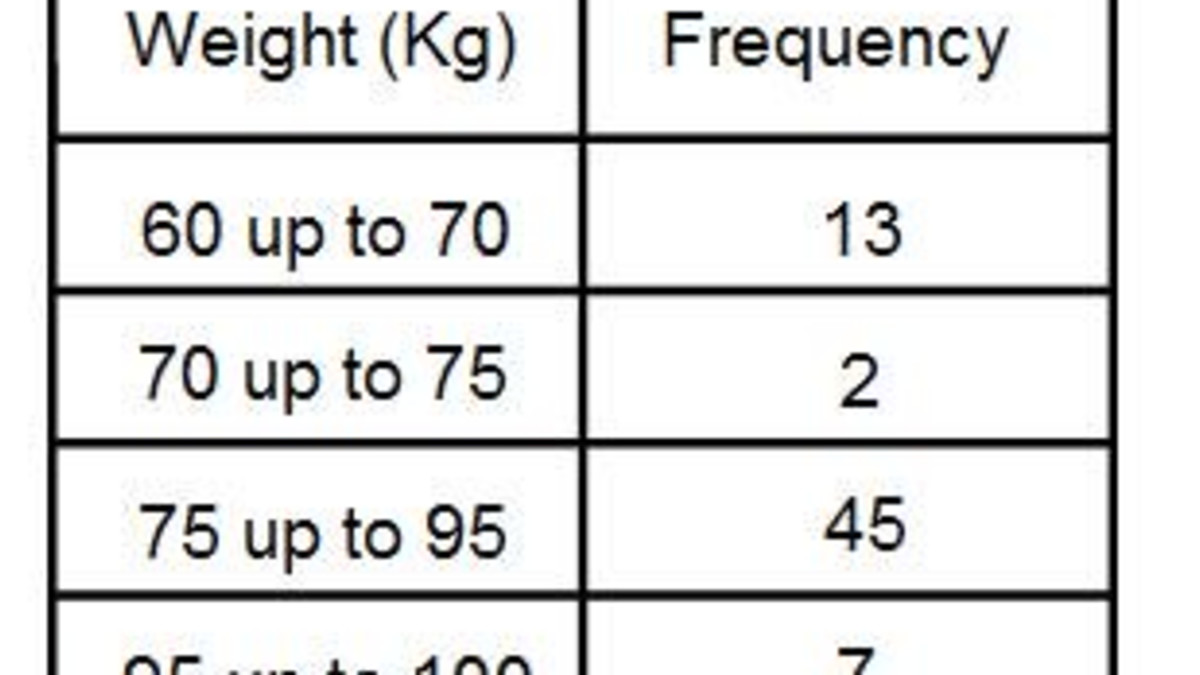
When dealing with large datasets, especially those with continuous numerical values (like response times in milliseconds, user session durations, or CPU temperature readings), individual modes can become less meaningful due to the sheer diversity of precise values. This is where grouped data and class intervals come into play. Data is partitioned into ranges (e.g., 0-10ms, 11-20ms, etc.), and the frequency of data points falling into each range is counted. The modal class is simply the class interval that possesses the highest frequency, indicating the most common range within which data points fall. This abstraction provides a clearer, more actionable understanding of where the bulk of the data lies. For instance, knowing the modal class of server response times (e.g., 50-75ms) is more informative than an average if the distribution is skewed, or if many individual response times are unique.
Identifying the Modal Class in Tech Analytics
Pinpointing the modal class is a straightforward process, whether dealing with raw data or grouped data, and is a fundamental step in various tech analytical workflows.
Raw Data vs. Grouped Data Modality
For raw, discrete data (e.g., types of user devices), the mode is simply the value that appears most often. If we count occurrences of “iOS,” “Android,” “Web,” and find “Android” with the highest count, “Android” is the mode.
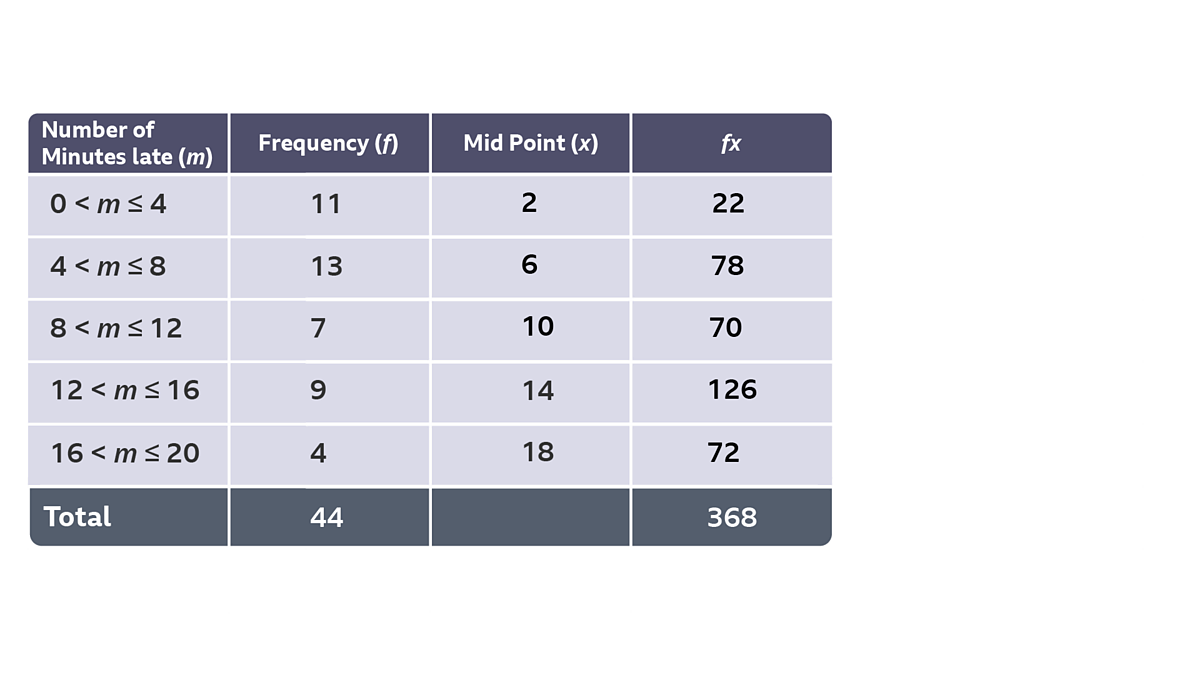
For grouped data, the process involves:
- Creating Class Intervals: Define appropriate ranges for your continuous data. The choice of interval width can influence the perceived mode, so it requires careful consideration based on the data’s nature and the insights sought.
- Tallying Frequencies: Count how many data points fall into each class interval.
- Identifying the Highest Frequency: The class interval with the largest count is the modal class.
Sometimes, a dataset might have more than one mode (bimodal or multimodal), indicating multiple peaks in the distribution, which can signify distinct subgroups or behaviors within the data. Recognizing this is crucial, as a single modal class might oversimplify a complex reality.
Practical Steps for Tech Professionals
In a practical tech environment, identifying the modal class often involves leveraging analytical tools and programming languages:
- Spreadsheets (Excel, Google Sheets): Functions like
MODE.SNGLfor raw data, or manually creating frequency distributions usingCOUNTIFSand pivot tables for grouped data. - Database Queries (SQL): Using
GROUP BYclauses withCOUNT()to find the mode of categorical data, or creating custom binning logic for numerical data. - Programming Languages (Python, R):
- Python: Libraries like
pandasandnumpyare indispensable. For a Series/DataFrame column,.mode()directly finds the mode. For grouped data,pd.cut()ornp.histogramcan create bins, and then frequency counts identify the modal class. - R: Functions like
table()orcut()combined withwhich.max()are used to determine modes and modal classes.
- Python: Libraries like
- Data Visualization Tools (Tableau, Power BI, Matplotlib, Seaborn): Histograms are the go-to visualization for identifying modal classes. The tallest bar in a histogram directly represents the modal class.
Applications of Modal Class in Technology and Data Science
The ability to identify the most frequent occurrences or ranges within a dataset unlocks a multitude of applications across various tech domains.
Enhancing User Experience (UX) and Software Design
Understanding user behavior is at the core of effective UX and software design. The modal class provides clear signals:
- Feature Prioritization: If telemetry data shows a modal class of users heavily engaging with a specific feature, it signals where development resources should be focused for improvement or expansion. Conversely, features with low usage might be candidates for deprecation.
- User Flow Optimization: Identifying the modal path users take through an application can help streamline workflows, reducing friction points for the majority.
- Interface Design: When designing layouts, understanding the modal screen resolution or device type used by the majority of users (the modal class) ensures optimal display and interaction for the broadest audience.
- Error Analysis: Pinpointing the modal class of error messages in logs can reveal systemic issues affecting a large segment of users, guiding targeted bug fixes.
Informing AI and Machine Learning Models
In the realm of AI and machine learning, the modal class plays a foundational, albeit often implicit, role in several areas:
- Data Preprocessing and Feature Engineering: Understanding modal values for categorical features can inform strategies for handling missing data (e.g., imputing with the mode). For numerical data, the distribution revealed by modal classes can guide feature transformations.
- Classification Tasks: In scenarios where a classifier needs to predict a categorical outcome, the modal class of the target variable in the training data provides a baseline “most likely” outcome. For example, if “not spam” is the modal class for emails, a simple classifier could achieve decent accuracy by always predicting “not spam.”
- Anomaly Detection: Deviations from the modal behavior or presence within the modal class can signal anomalies. For instance, a network packet size far outside the modal class might indicate suspicious activity.
- Recommendation Systems: While more complex algorithms are used, the fundamental idea of recommending “what most people like” (i.e., the modal preference) forms a basic layer in some recommendation logic.
Optimizing System Performance and Resource Allocation
For infrastructure, DevOps, and backend engineering teams, modal class analysis helps in resource management and performance tuning:
- Server Load Balancing: Identifying the modal class of concurrent user sessions or request types can help in provisioning resources optimally, ensuring the most common load scenarios are handled efficiently without over-provisioning for rare peaks.
- Database Indexing: If certain query patterns or data access types fall into a modal class, appropriate indexing strategies can be developed to speed up the most frequent operations.
- Cache Management: Caching strategies can be optimized by identifying the modal class of frequently accessed data, ensuring that the most requested items are readily available.
- Network Latency Analysis: Pinpointing the modal class of network latency values can help identify the typical performance profile, guiding network infrastructure upgrades or routing adjustments.
Driving Business Intelligence and Product Strategy
Product managers and business intelligence analysts leverage modal class insights to steer strategic decisions:
- Market Segmentation: Identifying the modal demographic or behavioral characteristics of a user base can inform targeted marketing campaigns and product positioning.
- Pricing Strategies: For subscription models or product tiers, understanding the modal consumption patterns can help tailor pricing to meet the needs of the largest segment of users.
- Content Strategy: For platforms with user-generated content, knowing the modal type or topic of content engagement can guide content creation efforts and platform features.
- A/B Testing Analysis: When evaluating A/B test results, identifying if a new feature leads to a shift in the modal behavior (e.g., modal click-through rate class) can be more insightful than just comparing means, especially for non-normal distributions.
Tools and Techniques for Modal Class Analysis
Modern tech stacks offer powerful tools to perform modal class analysis efficiently.
Leveraging Programming Languages (Python, R)
Python, with its rich ecosystem of data science libraries, is a popular choice:
pandas: Essential for data manipulation.df['column'].value_counts()directly gives frequencies for discrete data, anddf['column'].mode()returns the mode(s). For binning,pd.cut(df['column'], bins=[0, 10, 20, 30])creates categories from numerical data, which can then be analyzed withvalue_counts().numpy: Providesnp.histogramfor creating frequency distributions for numerical data.scipy.stats: Offers statistical functions, though basic mode/modal class often doesn’t require complex statistical inference.
R is equally capable, with table() for frequencies, cut() for binning, and comprehensive packages for statistical analysis and visualization.
Visualization for Insight
While numerical outputs are critical, visualizing data distributions makes modal classes immediately apparent and more intuitive:
- Histograms: The primary tool for visualizing the distribution of continuous numerical data. The tallest bar(s) directly indicate the modal class(es).
- Bar Charts: Ideal for visualizing the frequencies of discrete or categorical data, where the tallest bar represents the mode.
- Density Plots: Provide a smoothed representation of the data distribution, visually highlighting peaks (modes) more fluidly than histograms.
Challenges and Nuances in Modal Class Interpretation
Despite its utility, interpreting modal classes requires awareness of certain challenges.
Multimodal Distributions
A dataset can exhibit multiple modes, meaning there are several class intervals with similarly high frequencies. This isn’t a problem but an insight: it suggests the presence of distinct subgroups or phenomena within the data. For example, a bimodal distribution of user session lengths might indicate two primary user types: those who quickly complete a task and those who engage in longer browsing sessions. Ignoring multimodality and reporting only one modal class can lead to an incomplete or misleading understanding.
Dealing with Continuous Data
The choice of class interval width for continuous data significantly impacts the resulting modal class. Too narrow, and the distribution might appear too noisy, with no clear mode. Too wide, and important nuances in the distribution could be obscured. Determining the optimal bin width often involves experimentation, domain knowledge, and sometimes statistical rules of thumb (e.g., Freedman-Diaconis rule, Scott’s rule) that aim to reveal the underlying structure of the data without over-smoothing or over-fragmenting it.
Ultimately, the modal class is more than just a statistical curiosity; it’s a powerful tool for revealing the “most common” realities within data. In a world increasingly driven by data, the tech industry’s ability to identify and act upon these commonalities directly translates into more robust software, more intelligent AI, better user experiences, and more impactful business strategies.
aViewFromTheCave is a participant in the Amazon Services LLC Associates Program, an affiliate advertising program designed to provide a means for sites to earn advertising fees by advertising and linking to Amazon.com. Amazon, the Amazon logo, AmazonSupply, and the AmazonSupply logo are trademarks of Amazon.com, Inc. or its affiliates. As an Amazon Associate we earn affiliate commissions from qualifying purchases.