
In the world of finance, the difference between a successful investor and an unsuccessful one often boils down to a single concept: the ability to quantify uncertainty. While many retail investors focus exclusively on “returns”—the percentage gain at the end of the year—professional fund managers, quantitative analysts, and institutional traders look at a different metric first. That metric is Standard Deviation (SD).
When you see the term “1 SD,” you are looking at the foundational building block of risk management. In financial terms, 1 SD (one standard deviation) represents the most common range of price fluctuations an asset experiences. Understanding this measurement is not just a mathematical exercise; it is the key to surviving market volatility and building a portfolio that can withstand the unpredictable nature of global markets.
Decoding the Math: What 1 SD Means for Your Portfolio
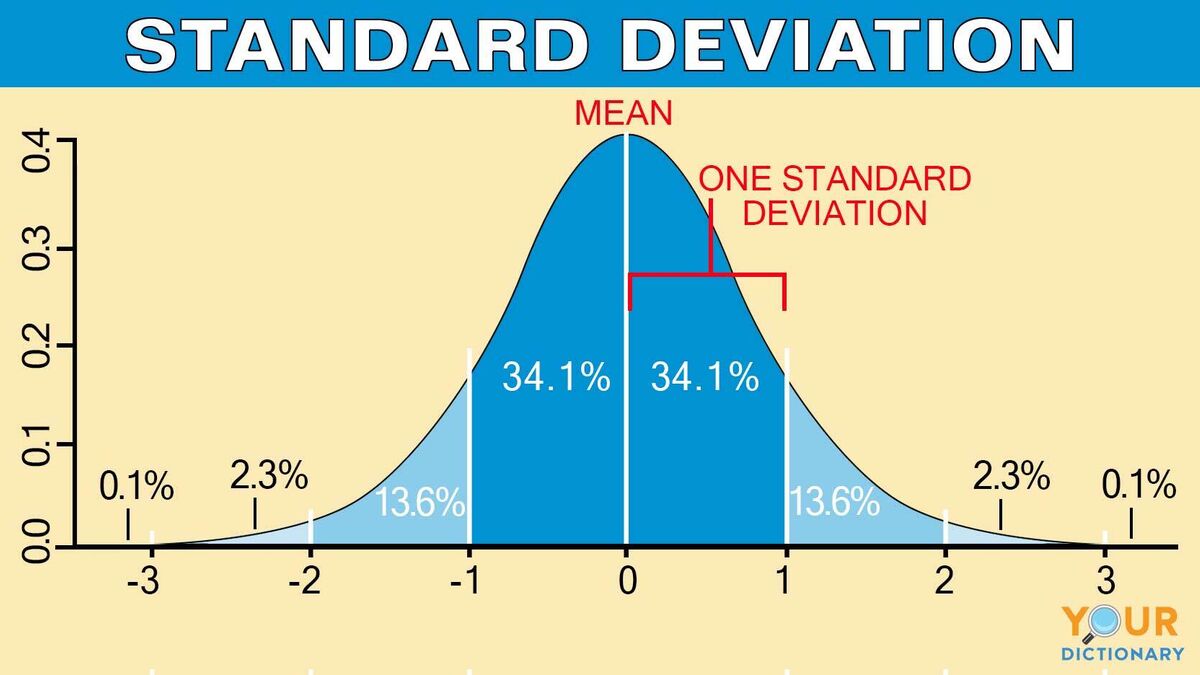
To understand 1 SD in a financial context, we must first look at the “Normal Distribution,” often referred to as the Bell Curve. In finance, we assume (though not always perfectly) that the returns of an asset class over time will cluster around an average.
The Bell Curve and Financial Probabilities
Standard deviation measures the “spread” of data around the mean (the average). If a stock has an average annual return of 8% and a standard deviation of 15%, the “1 SD” range tells us where the stock’s price is likely to land most of the time.
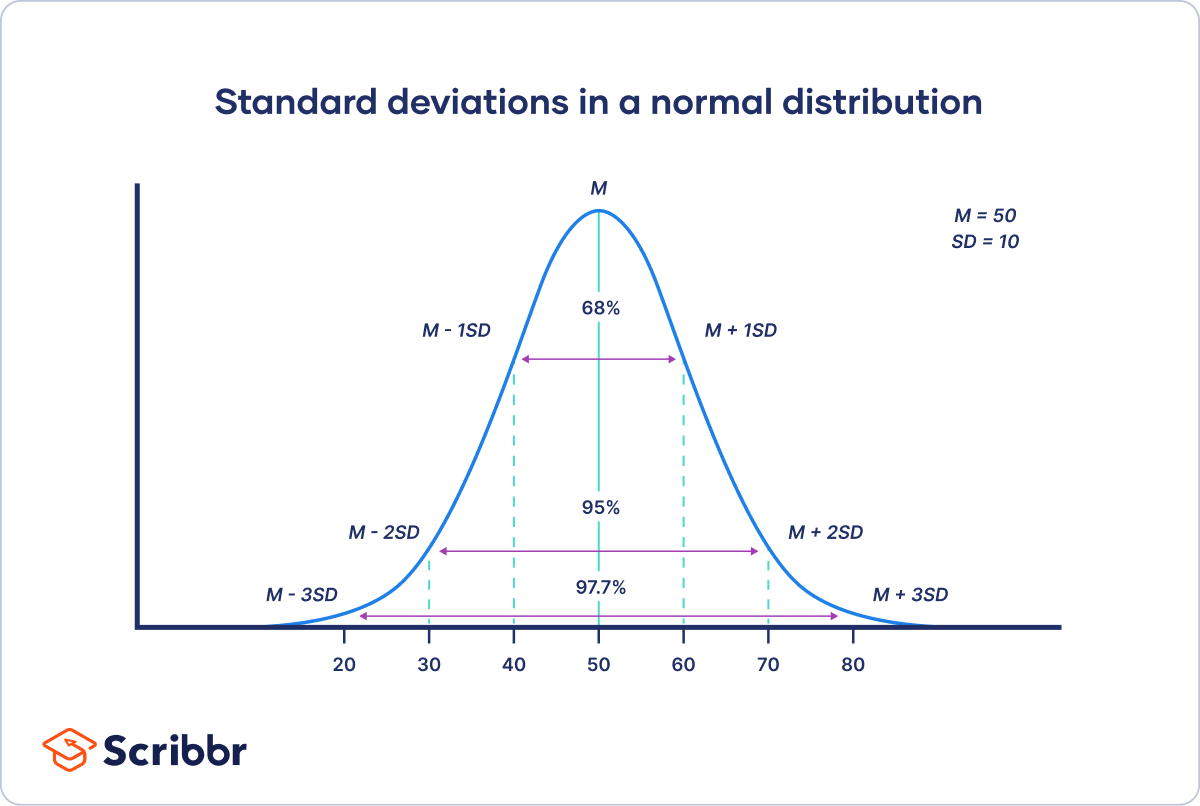
Mathematically, in a normal distribution, approximately 68.2% of all outcomes fall within one standard deviation of the mean. This is the “inner circle” of volatility. When an analyst says a move is “within 1 SD,” they are saying that the price action is perfectly normal and statistically expected. It is the “noise” of the market that investors should generally ignore.
Why 68% Matters to Your Wealth
For an investor, the 68% probability associated with 1 SD provides a comfort zone. If you are invested in an index fund with a historical 1 SD of 15%, you should psychologically and financially prepare for your returns to fluctuate within that range in any given year.
Understanding 1 SD helps prevent “panic selling.” If the market drops by 10% but the 1 SD threshold is 15%, the disciplined investor knows that this move is statistically routine. It is not a “crash”; it is simply the asset breathing within its expected parameters. By focusing on 1 SD, you shift your mindset from emotional reacting to statistical monitoring.
Measuring Risk: The Practical Application of Standard Deviation
In the niche of personal finance and investing, standard deviation is the most widely accepted proxy for risk. However, risk is not just the possibility of losing money; it is the uncertainty of the outcome.
Assessing Stock Volatility
Individual stocks vary wildly in their 1 SD values. A blue-chip utility company might have a low standard deviation (perhaps 5–8%), meaning its price is relatively stable and predictable. Conversely, a high-growth tech startup or a biotech firm might have a 1 SD of 30% or more.
When building a portfolio, looking at the 1 SD of each asset allows you to balance your “Risk Budget.” If you hold too many assets with high standard deviations, your portfolio’s 1 SD will expand, leading to massive swings in your net worth that might exceed your emotional risk tolerance. By checking the 1 SD of a potential investment, you are essentially asking: “How much ‘heartburn’ is this stock likely to give me in a typical year?”
Evaluating Fund Performance and the Sharpe Ratio
Standard deviation is also a critical component in evaluating professional money managers. It is easy to generate high returns by taking massive risks. The real skill lies in generating returns relative to the risk taken.
This is where the Sharpe Ratio comes in. The Sharpe Ratio is calculated by taking the excess return of an investment (above the risk-free rate) and dividing it by the standard deviation. If two funds both return 10%, but Fund A has a 1 SD of 5% and Fund B has a 1 SD of 20%, Fund A is vastly superior. It achieved the same result with significantly less “zig-zagging.” For the savvy investor, 1 SD is the denominator that reveals the truth behind the returns.
Strategic Asset Allocation Using 1 SD
Successful wealth management requires a strategic approach to how different assets interact. Standard deviation is the primary tool used in Modern Portfolio Theory (MPT) to create the “Efficient Frontier”—the point where you get the maximum return for a specific level of risk.
Diversification and the Standard Deviation Metric
The goal of diversification is not just to “own many things,” but to own things whose prices do not move in perfect unison. When you combine assets with different 1 SD profiles—such as stocks, bonds, and gold—the standard deviation of the total portfolio is often lower than the standard deviation of the individual parts.
For example, during a market correction, the 1 SD move for stocks might be a 15% drop. However, if your portfolio includes government bonds (which often have a lower SD and move inversely to stocks), your total portfolio’s 1 SD might only be 6%. By understanding the 1 SD of different asset classes, you can engineer a “smoother ride,” which is essential for long-term compounding.
Tail Risk and the Limitations of 1 SD
While 1 SD covers 68% of outcomes, and 2 SD covers roughly 95%, investors must be aware of “Tail Risk”—the events that happen in the remaining small percentages. In finance, we often see “Fat Tails,” where extreme events (3 SD or higher) happen more frequently than standard math would suggest.
The 2008 financial crisis and the 2020 COVID-19 crash were “6 SD” events—statistically impossible according to simple models, yet they happened. Therefore, while 1 SD is your guide for daily and yearly expectations, your financial plan should also include “black swan” protections for those moments when the market moves far beyond the 1 SD boundary.
Tools and Techniques for Monitoring Volatility
In the modern digital era, you don’t need a PhD in statistics to utilize 1 SD in your financial planning. Numerous tools and platforms integrate these metrics to help you make informed decisions.
Using Financial Software to Track SD
Retail platforms like Morningstar, Yahoo Finance, and specialized tools like Portfolio Visualizer provide the standard deviation for almost every ticker symbol. When researching an ETF or Mutual Fund, look for the “Risk” tab. There, you will find the 3-year or 5-year annualized standard deviation.
If you manage your own spreadsheets, the =STDEV() function in Excel or Google Sheets allows you to calculate the volatility of your personal holdings over any period. By calculating the 1 SD of your monthly returns, you can establish your own “Normal Range.” If your portfolio moves more than 1 SD in a single month, it serves as a signal to investigate whether the underlying fundamentals of your investments have changed.
Historical vs. Implied Volatility
In more advanced financial circles, specifically in options trading, 1 SD is used to determine “Implied Volatility” (IV). While historical SD looks at the past, IV looks at what the market expects in the future.
The VIX Index, often called the “Fear Gauge,” is essentially a measure of the expected 1 SD move for the S&P 500 over the next 30 days. When the VIX is high, the market is pricing in a larger 1 SD, meaning wider price swings are expected. Monitoring these tools allows an investor to see if they are being “paid” enough (in the form of higher potential returns) to take on the increased volatility that a rising SD represents.
Conclusion: The Power of 1 SD in Financial Discipline
Understanding “what is 1 SD” is a rite of passage for any serious investor. It represents the shift from gambling—where one hopes for the best—to investing, where one manages the probable.
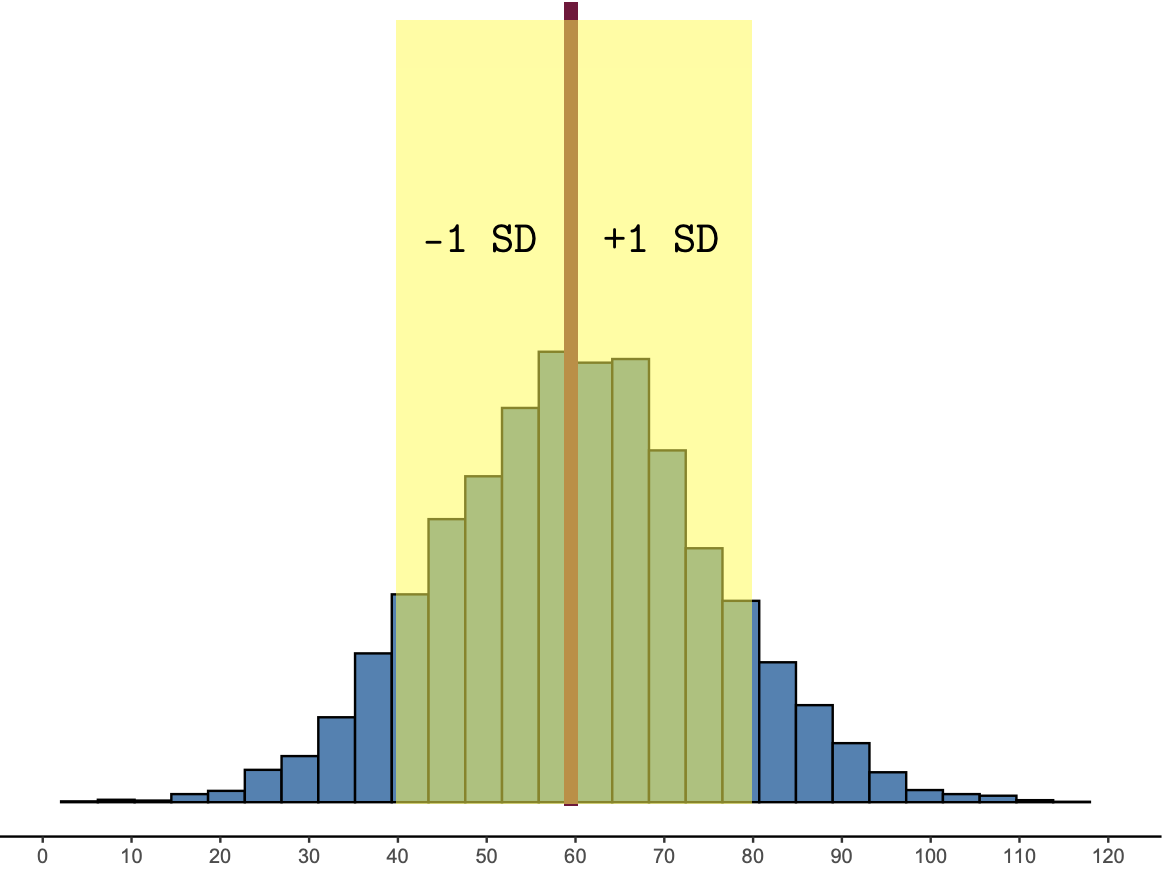
By recognizing that 1 SD encompasses 68% of market movement, you gain a powerful psychological edge. You learn to embrace the inherent “wiggle” of the market as a natural statistical occurrence rather than a personal threat to your wealth. Whether you are assessing a new stock, rebalancing your retirement account, or evaluating a fund manager, always look past the raw returns and ask: “What is the 1 SD?”
In the long run, the investors who win are not those who chase the highest peaks, but those who understand the depth of the valleys and build a portfolio that can navigate them with calculated precision. Knowledge of standard deviation is the map that helps you stay the course, ensuring that market “noise” never distracts you from your long-term financial goals.
aViewFromTheCave is a participant in the Amazon Services LLC Associates Program, an affiliate advertising program designed to provide a means for sites to earn advertising fees by advertising and linking to Amazon.com. Amazon, the Amazon logo, AmazonSupply, and the AmazonSupply logo are trademarks of Amazon.com, Inc. or its affiliates. As an Amazon Associate we earn affiliate commissions from qualifying purchases.