
The Allure of Hindsight: Why We Look Back at Missed Opportunities
The human mind is a fascinating arena where regret and curiosity often intertwine, especially when it comes to financial decisions. How many times have you heard or uttered the phrase, “If only I had bought shares in [company X] back then…”? This sentiment isn’t just idle daydreaming; it stems from a deep-seated desire to quantify missed opportunities and understand the tangible impact of past choices. The stock market, with its exponential growth stories and widely publicized success, is a prime catalyst for this financial introspection.

The Psychology of “What If”: Navigating FOMO and Regret
At the heart of the “what if” phenomenon lies FOMO – the Fear Of Missing Out. This psychological bias pushes individuals to constantly compare their outcomes with potential alternative realities. When a company like Apple, Amazon, or Tesla skyrockes, the collective consciousness fills with stories of early investors who became millionaires. For those who observed from the sidelines, the natural response is to wonder, “What if I had been one of them?” This isn’t just about wishing for wealth; it’s about understanding the mechanics of that wealth creation and perhaps identifying patterns that could lead to future success. While regret itself is a counterproductive emotion if it leads to paralysis, the analysis of regret, when channeled constructively, can be a powerful learning tool. It highlights the perceived cost of inaction and the immense potential of strategic, early investment.
Learning from the Past, Planning for the Future
Beyond the emotional aspect, the “what if I had invested” stock calculator serves a crucial educational purpose. It transforms vague notions of missed gains into concrete figures. By inputting hypothetical scenarios, users can objectively see how different investment decisions, made at different times, would have played out. This analytical approach moves beyond mere lamentation, shifting the focus from “I should have” to “What can I learn?” By understanding the drivers of past performance – be it sustained growth, dividend reinvestment, or market timing – investors can refine their strategies for the future. It’s a simulation laboratory for financial education, allowing individuals to test hypotheses and observe outcomes without risking a single dollar.
Demystifying the “What If I Had Invested” Stock Calculator
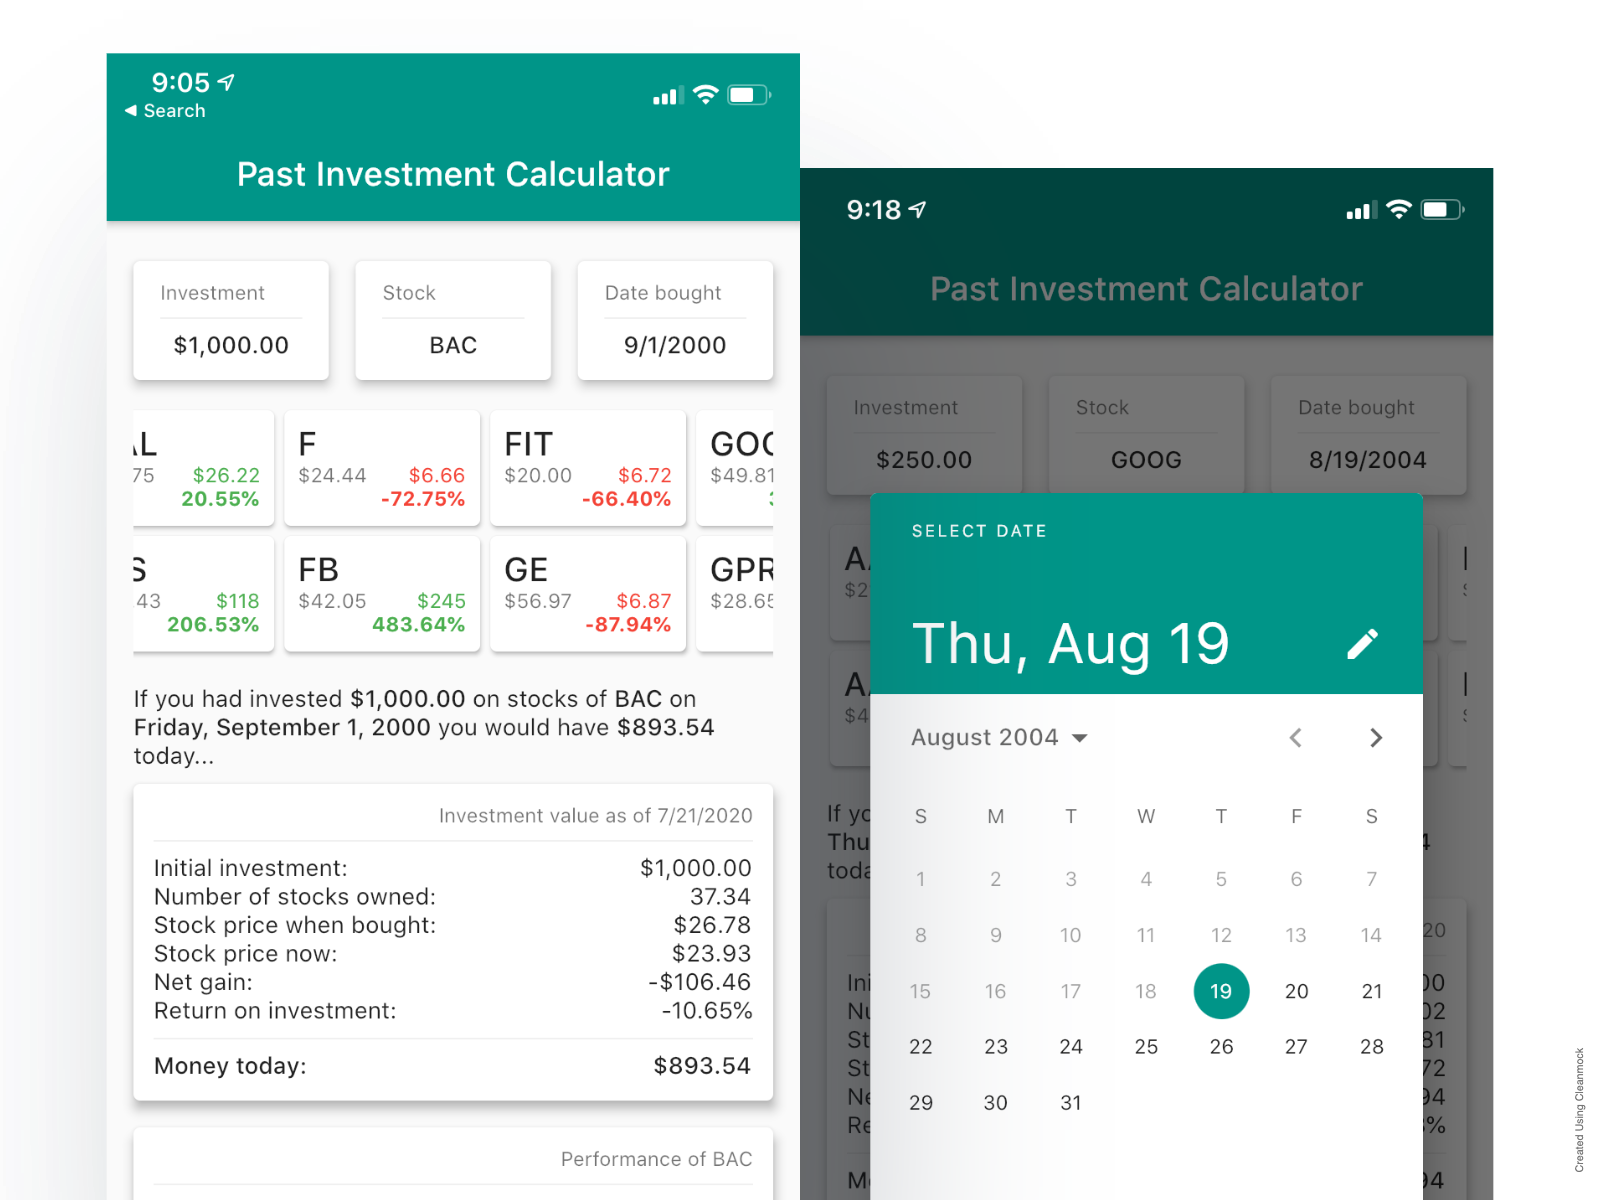
At its core, a “what if I had invested” stock calculator is a sophisticated financial tool designed to simulate the historical performance of an investment. It takes a few simple inputs and generates a comprehensive breakdown of potential returns, illuminating the true power of compounding and market growth.
How It Works: Inputs and Outputs Explained
The typical stock calculator requires fundamental pieces of information to perform its magic:
-
Initial Investment Amount: The dollar value you hypothetically would have invested.
-
Stock Symbol (Ticker): The specific company’s shares you are evaluating (e.g., MSFT for Microsoft, GOOGL for Alphabet).
-
Buy Date: The specific date you hypothetically would have purchased the shares.
-
Sell Date (or Current Date): The specific date you hypothetically would have sold the shares, or the current date if you’re assessing holding until now.
Once these inputs are provided, the calculator taps into historical stock price data, factoring in stock splits, dividends (if reinvested), and other corporate actions to produce outputs such as:
-
Total Return in Dollars: The gross profit or loss from the investment.
-
Total Return Percentage: The percentage gain or loss relative to the initial investment.
-
Annualized Return (CAGR): The average annual growth rate over the investment period.
-
Capital Gains: The profit from the increase in the stock’s price.
-
Dividends Received (and Reinvested Value): The total dividend payments, showing their contribution if reinvested.
Key Metrics Revealed: Beyond Just the Dollar Amount
While the final dollar amount is often the most captivating figure, a deeper understanding comes from analyzing the underlying metrics:
-
Compound Annual Growth Rate (CAGR): This is arguably the most crucial metric for long-term investors. CAGR smooths out the volatile year-to-year returns into a single, representative annual growth rate. It provides a more accurate picture of an investment’s performance than simple average returns, especially over multi-year periods. A high CAGR indicates strong, consistent growth.
-
Total Return Percentage: This metric provides an immediate sense of the investment’s efficacy relative to the initial capital. It allows for easy comparison across different hypothetical investments with varying initial amounts.
-
The Impact of Dividends: Many calculators offer the option to include or exclude dividend reinvestment. This feature vividly demonstrates how reinvesting dividends, even seemingly small amounts, can significantly boost total returns over time due to the power of compounding. It highlights the often-underestimated role of passive income streams in wealth creation.
The Power of Compounding Visualized
Perhaps the most profound insight offered by a stock calculator is the tangible visualization of compounding. By showing how an initial sum grows, not just on its principal but also on the accumulated interest and gains, the calculator makes the abstract concept of compounding concrete. When you see a relatively small initial investment swell into a substantial sum over decades, it underscores Warren Buffett’s famous adage about compound interest being the “eighth wonder of the world.” This visualization can be a powerful motivator for long-term investing and starting early.
Practical Applications: Beyond Just Nostalgia
While the initial appeal of a stock calculator might be its ability to satisfy curiosity about past missed opportunities, its true value lies in its practical applications for current and future investment decisions.
Evaluating Past Investment Strategies
For active investors, the calculator serves as an invaluable diagnostic tool. You can input details of your actual past investments or hypothetical strategies you considered. By analyzing the outcomes, you can gain insights into what worked, what didn’t, and why. Did a particular sector outperform? Was your entry point optimal? Did holding through volatility pay off? This post-mortem analysis provides objective data that can inform adjustments to your current portfolio allocation, stock selection criteria, and overall investment philosophy. It transforms speculative thinking into data-driven learning.
Understanding Market Volatility and Long-Term Trends
The market is rarely a straight line upwards. By running various scenarios—investing during bull markets, bear markets, or periods of high volatility—investors can observe how different assets reacted. This helps to build an understanding of market cycles and the importance of a long-term perspective. For instance, you might see that a stock bought at the peak of a bull market still yielded significant returns if held for a decade, despite an initial drawdown. This fosters resilience and helps temper the emotional reactions to short-term market fluctuations, reinforcing the wisdom of patience.
Education for Aspiring Investors
For newcomers to the investment world, the “what if I had invested” calculator is an unparalleled educational resource. It demystifies complex financial concepts by showing them in action. Beginners can learn about:
-
Capital Appreciation: How the value of shares increases over time.
-
Dividend Reinvestment: The powerful effect of earning returns on your returns.
-
Time Value of Money: The concept that money available today is worth more than the same amount in the future due to its potential earning capacity.
-
Risk vs. Reward: By comparing hypothetical investments in different companies, they can start to intuitively grasp how higher potential returns often come with higher volatility.
It provides a safe, sandbox environment to explore investment mechanics without risking actual capital, making the learning process more engaging and impactful.
Setting Realistic Expectations
While the calculator can showcase impressive gains, it also helps in setting realistic expectations. Not every stock will replicate the success of the tech giants, and not every investment period will yield astonishing returns. By running multiple scenarios across different stocks and timeframes, investors gain a more balanced perspective on average market returns, the impact of market corrections, and the inherent unpredictability of individual stock performance. This grounded understanding is vital for sustainable long-term investing and avoids the pitfalls of chasing unrealistic returns.
Factors to Consider Beyond the Calculator’s Output
While the “what if I had invested” calculator provides invaluable insights into historical performance, its output is a simplified model. To derive truly actionable conclusions, it’s crucial to consider several real-world factors that are typically not included in basic calculations.
Inflation’s Erosion
The returns displayed by a stock calculator are almost always nominal returns – the raw percentage or dollar gain. However, to understand the true increase in purchasing power, one must account for inflation. If your investment grew by 7% annually but inflation was 3%, your real return is only 4%. Over long periods, inflation can significantly erode the real value of even substantial nominal gains. A comprehensive analysis requires subtracting the cumulative effect of inflation to understand the actual wealth creation.
Taxes and Fees
Real-world investing is subject to various costs that can significantly impact net returns.
-
Transaction Fees: While many brokers now offer commission-free trading, some platforms or specific asset classes may still incur fees for buying and selling.
-
Capital Gains Taxes: Profits from selling stocks are often subject to capital gains taxes, which can be short-term (for assets held less than a year) or long-term (for assets held over a year), with differing tax rates.
-
Dividend Taxes: Dividends received are typically taxed as ordinary income or at preferential qualified dividend rates, depending on the holding period.
These tax implications, often not factored into simple calculators, can substantially reduce the investor’s take-home profit, making the “what if” scenario less lucrative in reality.
Opportunity Cost
When you hypothetically invest in one stock, you are implicitly choosing not to invest in countless others. The calculator shows you what you could have made with that specific investment, but it doesn’t quantify the opportunity cost – what you could have made if you had invested that same capital into a different, potentially higher-performing asset during the same period. While difficult to calculate precisely, acknowledging opportunity cost is vital for making forward-looking strategic decisions about asset allocation and portfolio diversification.
Risk Tolerance and Behavioral Finance
A calculator deals with cold, hard numbers, but human behavior is anything but. The calculator doesn’t account for the emotional rollercoaster an investor would have endured while holding a volatile stock. Would you have truly held onto a stock through a 50% drawdown, even if it eventually recovered and soared? Your personal risk tolerance, psychological resilience, and ability to resist panic selling or irrational exuberance play an enormous role in determining actual realized returns. The hypothetical gains shown by a calculator assume perfect execution and emotional control, which are often unrealistic in practice.
From Hindsight to Foresight: Leveraging Insights for Future Investments
The true power of the “what if I had invested” calculator extends beyond mere historical analysis; it serves as a robust platform for developing informed, forward-looking investment strategies. By understanding past market dynamics and the mechanics of wealth creation, investors can cultivate a more disciplined and effective approach to their financial future.
Developing a Disciplined Approach
The stark numbers generated by the calculator often highlight the immense benefit of consistent, long-term investing. It vividly demonstrates how panic selling during market downturns can decimate potential returns, while steadfast commitment allows compounding to work its magic. This can encourage investors to adopt strategies like dollar-cost averaging – investing a fixed amount regularly, regardless of market fluctuations – and to cultivate patience, resisting the urge to chase fads or react emotionally to short-term volatility. The calculator becomes a quiet advocate for discipline, showing that time in the market often beats market timing.
Identifying Growth Sectors and Trends
While past performance is never a guarantee of future results, the calculator allows investors to simulate historical investments across different sectors and industries. Consistently high-performing sectors in historical simulations might warrant deeper research into their underlying drivers of growth. This doesn’t mean blindly investing in past winners, but rather using historical data to identify secular trends, innovative industries, or resilient business models that have demonstrated long-term potential. It helps in formulating a hypothesis about future growth areas worthy of fundamental analysis.
The Importance of Starting Early
Perhaps the most compelling lesson from any “what if I had invested” scenario is the profound advantage of starting early. Even modest initial investments, given decades to compound, can outperform significantly larger sums invested later in life. The calculator makes this mathematical reality undeniable, transforming an abstract concept into an impactful visualization. This insight can motivate younger individuals to begin their investment journey sooner, emphasizing that time, more than initial capital, is often the most potent factor in wealth accumulation. For older investors, it underscores the importance of maximizing current contributions to catch up.

Strategic Portfolio Planning
The calculator can be used as a sandbox for strategic portfolio planning. Investors can model hypothetical allocations, comparing how a diversified portfolio might have performed against a concentrated bet, or how different asset classes (e.g., tech stocks vs. stable dividend payers) fared over various periods. This allows for experimentation with different investment theses, helping to understand the risk-reward profiles of various strategies before committing real funds. By simulating different scenarios, investors can develop a more robust, diversified, and risk-adjusted portfolio that aligns with their personal financial goals and risk tolerance. Ultimately, the “what if I had invested” stock calculator is more than just a tool for nostalgia; it’s a powerful instrument for financial education, strategic planning, and cultivating the discipline necessary to achieve long-term financial success.
aViewFromTheCave is a participant in the Amazon Services LLC Associates Program, an affiliate advertising program designed to provide a means for sites to earn advertising fees by advertising and linking to Amazon.com. Amazon, the Amazon logo, AmazonSupply, and the AmazonSupply logo are trademarks of Amazon.com, Inc. or its affiliates. As an Amazon Associate we earn affiliate commissions from qualifying purchases.