
The question “what happened to the stock market today?” is one of the most frequently searched queries in the financial world. Every day, millions of investors, from retail traders on mobile apps to institutional fund managers in high-rise offices, seek to understand the movement of the indices. However, the answer is rarely a single data point. Market fluctuations are the result of a complex choreography involving macroeconomic data, corporate earnings, geopolitical shifts, and the collective psychology of millions of participants.
In today’s fast-paced financial environment, understanding the “why” behind the “what” is essential for any investor looking to build long-term wealth. This article explores the core drivers of market movements, analyzes the current economic climate, and provides a framework for interpreting daily market volatility through a professional lens.
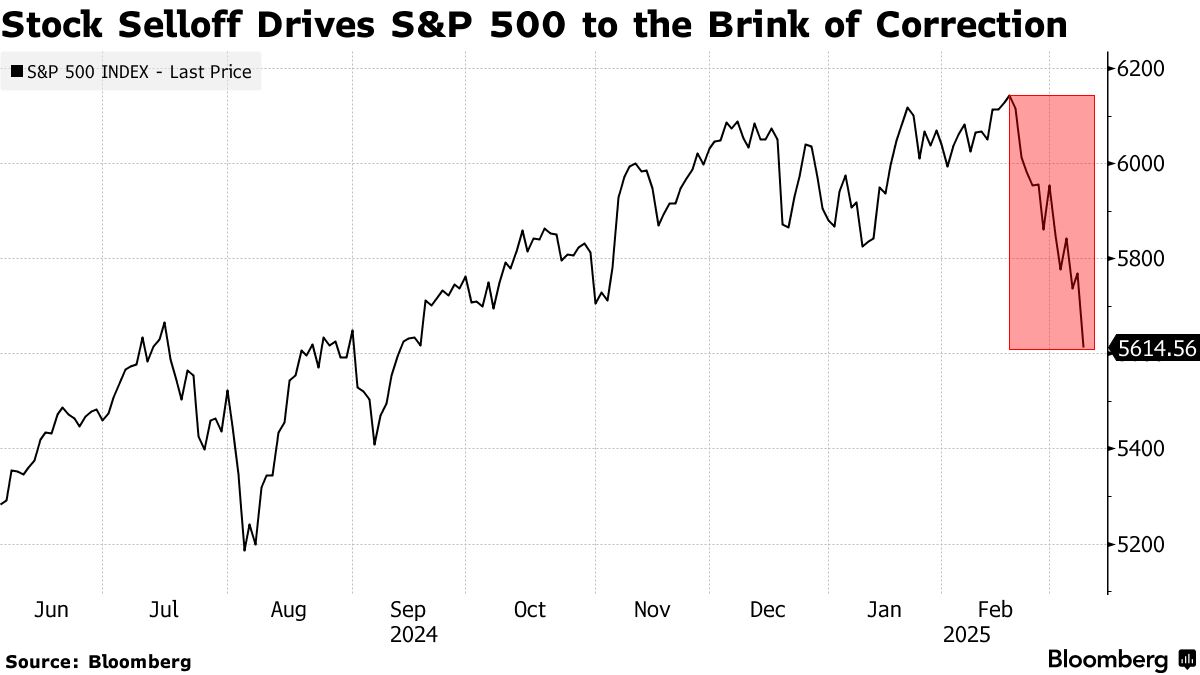
Decoding the Macroeconomic Landscape
When the stock market experiences a significant move, the primary catalyst is often found in the broader economy. Macroeconomics provides the structural framework within which all businesses operate. If the “big picture” changes, every individual stock is affected to some degree.
The Federal Reserve and Interest Rate Trajectories
In the current financial era, the Federal Reserve (the Fed) is arguably the most influential force in the markets. The central bank’s primary tool for managing the economy is the federal funds rate. When the Fed raises rates to combat inflation, borrowing becomes more expensive for companies and consumers. This typically leads to a cooling of the stock market as future corporate earnings are discounted at a higher rate.
Conversely, when the Fed signals a pause or a pivot toward cutting rates, markets often rally. Investors today spend hours parsing every word of FOMC (Federal Open Market Committee) minutes and speeches by Fed officials, looking for hints about the “higher for longer” narrative or potential easing cycles.
Inflationary Pressures and Consumer Spending Reports
Inflation, measured through the Consumer Price Index (CPI) and the Producer Price Index (PPI), is a vital metric for market health. High inflation erodes purchasing power and can squeeze corporate profit margins. If a “today” in the market involves a higher-than-expected CPI print, stocks often tumble as investors fear more aggressive interest rate hikes.
Similarly, since the U.S. economy is roughly 70% driven by consumer spending, Retail Sales reports are high-stakes events. A resilient consumer suggests the economy can handle higher rates (the “soft landing” scenario), while a sharp drop in spending might signal an impending recession, causing a sell-off in cyclical stocks.
Analyzing Sector Rotations and Corporate Earnings
While the broad indices like the S&P 500 or the Dow Jones Industrial Average give a general sense of market direction, the real story often lies within specific sectors. The market is not a monolith; it is a collection of different industries that react differently to the same news.
The Dominance of Big Tech and AI Integration
In recent years, the technology sector—specifically the “Magnificent Seven”—has been the primary engine of market growth. When people ask what happened to the market, the answer is often tied to the performance of these tech giants. Currently, the narrative is dominated by Artificial Intelligence (AI).
Earnings reports from semiconductor companies and cloud service providers have become “macro events” in their own right. If a leading AI chipmaker reports stellar earnings, it can lift the entire Nasdaq and S&P 500. However, this concentration also creates risk; if the tech sector experiences a correction due to overvaluation concerns, it can drag the rest of the market down, even if other sectors are performing well.
Defensive vs. Cyclical Stocks: Where the Money is Moving
Investor behavior often shifts between “risk-on” and “risk-off” environments. In a risk-on environment, investors flock to cyclical stocks—those in industries like discretionary spending, industrials, and technology—that thrive when the economy is growing.
In contrast, when the market is fearful or “today’s” news is negative, we see a “rotation” into defensive sectors. These include Utilities, Consumer Staples, and Healthcare. These companies provide essential services and products that people need regardless of the economic climate. Monitoring which sectors are leading the day provides a clear indication of the market’s underlying appetite for risk.
The Role of Investor Sentiment and Market Psychology
The stock market is often described as a weighing machine in the long run but a voting machine in the short run. This “voting” is driven by human emotion—primarily fear and greed.

Understanding the Fear and Greed Index
The Volatility Index (VIX), often called the “fear gauge,” measures the market’s expectation of 30-day volatility. When the VIX spikes, it indicates that investors are buying “put options” to protect their portfolios, signaling high levels of anxiety.
Daily market movements are often exaggerated by sentiment. If a news headline breaks that feels threatening, even if the fundamental impact is small, a cascade of selling can occur. Professional investors look at sentiment indicators to see if the market is “overbought” (too much greed) or “oversold” (too much fear), often using these as contrarian signals to enter or exit positions.
The Impact of High-Frequency Trading and Algorithmic Execution
It is important to acknowledge that a significant portion of “today’s” market activity is not executed by humans, but by algorithms. High-Frequency Trading (HFT) systems can process news and execute trades in microseconds.
When certain price levels are breached—such as a 200-day moving average—these algorithms may trigger a massive wave of buying or selling. This can lead to “flash crashes” or rapid intraday recoveries that seem disconnected from reality. For the individual investor, understanding that these technical “stop-losses” and “buy-triggers” exist helps explain why the market might suddenly drop or jump for no apparent fundamental reason.
Geopolitical Events and Global Market Synergy
We live in a hyper-connected global economy. A political event in Europe or a production shift in Asia can have an immediate impact on the New York Stock Exchange.
International Trade Relations and Supply Chain Stability
Markets hate uncertainty, and nothing creates uncertainty quite like geopolitical tension. Conflicts, trade wars, or changes in diplomatic relations can disrupt global supply chains. For example, tensions in oil-producing regions can lead to a spike in energy prices, which acts as a “tax” on both corporations and consumers, usually leading to a market pullback.
Furthermore, because many S&P 500 companies derive a large portion of their revenue from overseas, the health of the European and Chinese economies is paramount. If international markets are struggling, it limits the growth potential of U.S. multinationals, weighing on their stock prices.
Currency Fluctuations and the Strength of the Dollar
The value of the U.S. Dollar (USD) is a silent but powerful driver of market performance. When the dollar is exceptionally strong, it makes U.S. goods more expensive for foreign buyers and reduces the value of international profits when they are converted back into USD. On days when the Dollar Index (DXY) surges, we often see a headwind for large-cap multinational stocks. Conversely, a weakening dollar can provide a “tailwind” for earnings, pushing stock prices higher.
Navigating the Noise: Long-Term Strategies for Volatile Days
When the stock market is red, the natural human instinct is to do something—usually to sell. However, successful investing often requires the discipline to do nothing, or to stick to a pre-defined plan.
The Importance of Diversification in a High-Rate Environment
The best defense against a bad day in the market is a well-diversified portfolio. Diversification isn’t just about owning different stocks; it’s about owning different asset classes. When stocks are down, bonds, gold, or real estate may hold their value or even appreciate.
In a “higher for longer” interest rate environment, cash-equivalent vehicles like money market funds and short-term Treasuries have become viable components of a diversified strategy, offering decent yields with minimal risk. This allows investors to weather the storm when the equity markets are particularly volatile.
Dollar-Cost Averaging: Removing Emotion from the Equation
One of the most effective ways to handle the “what happened today” anxiety is through Dollar-Cost Averaging (DCA). By investing a fixed amount of money at regular intervals, regardless of the stock price, you naturally buy more shares when prices are low and fewer when prices are high.
DCA shifts the focus from timing the market to time in the market. Instead of worrying about a 2% drop on a Tuesday, the DCA investor views that drop as an opportunity to lower their average cost basis. This systematic approach is the hallmark of professional wealth building, as it removes the psychological burden of trying to predict daily market movements.

Conclusion: Contextualizing the Daily Fluctuations
What happened to the stock market today is rarely the result of a single factor. It is the culmination of interest rate expectations, sector-specific news, algorithmic trading, and global sentiment. While it is important to stay informed, it is equally important to maintain perspective.
Daily volatility is the price of admission for the long-term returns that the stock market provides. By understanding the underlying mechanics of macroeconomics, sector rotations, and investor psychology, you can transform from a reactive spectator into a proactive, informed investor. The goal is not to win the day, but to win the decade.
aViewFromTheCave is a participant in the Amazon Services LLC Associates Program, an affiliate advertising program designed to provide a means for sites to earn advertising fees by advertising and linking to Amazon.com. Amazon, the Amazon logo, AmazonSupply, and the AmazonSupply logo are trademarks of Amazon.com, Inc. or its affiliates. As an Amazon Associate we earn affiliate commissions from qualifying purchases.