
In the vast landscape of data-driven decision-making that defines modern technology, understanding statistical concepts is not merely an academic exercise but a practical necessity. Among the most fundamental yet powerful of these concepts is the z-score. Often referred to as a standard score, the z-score provides a standardized way to understand how far a particular data point deviates from the mean of a dataset, measured in units of standard deviation. For anyone working with data in tech, from software engineers optimizing system performance to data scientists building machine learning models, grasping the meaning and utility of the z-score is crucial for gaining meaningful insights and making informed choices.

The Core Concept: Understanding Z-Scores
At its heart, a z-score transforms a raw data point into a standardized value, making it easier to compare observations from different distributions or understand the relative position of a single observation within its own dataset. This standardization process is invaluable in scenarios where raw values alone might be misleading or difficult to interpret without context.
Standardization and Relative Position
Imagine a dataset representing the latency of a web service, measured in milliseconds. If a particular request takes 500ms, is that good or bad? Without knowing the average latency and the typical spread of latencies, it’s impossible to tell. This is where the z-score shines. It doesn’t just tell you the raw value, but where that value stands relative to the average and the variability of the entire dataset.
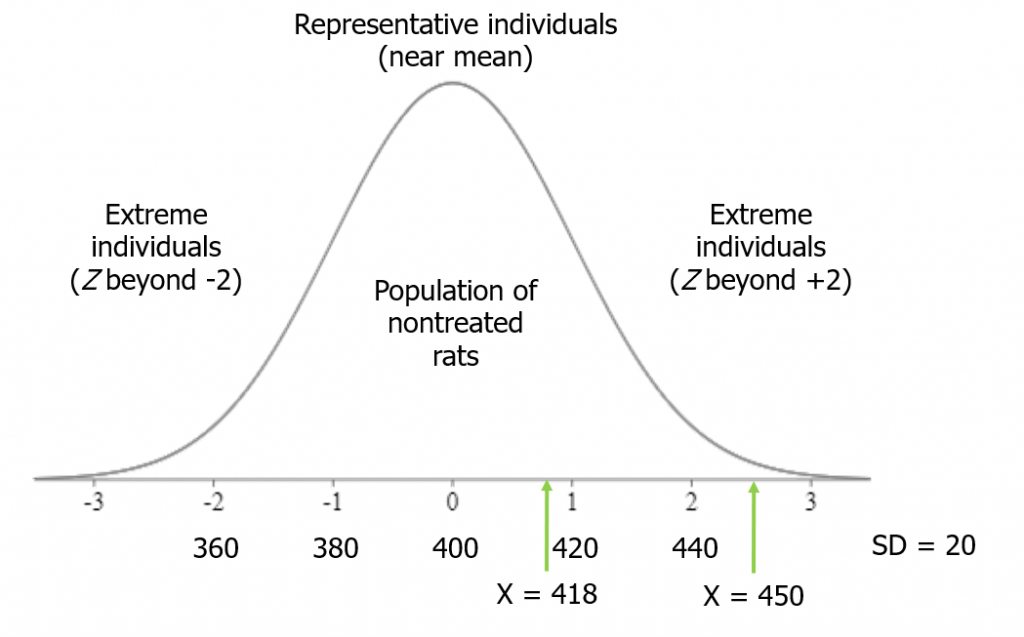
A positive z-score indicates that the data point is above the mean, while a negative z-score means it’s below the mean. A z-score of 0 signifies that the data point is exactly at the mean. The magnitude of the z-score reveals how far away it is; for instance, a z-score of +2 means the data point is two standard deviations above the mean, suggesting it’s quite an outlier if the data is normally distributed. This ability to instantly gauge relative position is what makes z-scores so potent in data analysis within technology.
The Formula Explained
The calculation of a z-score is straightforward:
$$z = frac{(x – mu)}{sigma}$$
Where:
- $x$ is the individual data point you want to standardize.
- $mu$ (mu) is the mean (average) of the dataset.
- $sigma$ (sigma) is the standard deviation of the dataset.
Let’s use a tech-specific example. Suppose the average (mean) load time for an application feature is 3 seconds ($mu = 3$), and the standard deviation of load times is 0.5 seconds ($sigma = 0.5$). If a particular user experiences a load time ($x$) of 4.2 seconds, its z-score would be:
$$z = frac{(4.2 – 3)}{0.5} = frac{1.2}{0.5} = 2.4$$
This z-score of 2.4 tells us that a 4.2-second load time is 2.4 standard deviations above the average. This immediately flags it as a potentially slow experience, prompting further investigation by a performance engineer.
Why Z-Scores Matter in Technology and Data Science
The utility of z-scores extends across numerous applications in the tech world, from preparing data for advanced algorithms to identifying critical operational issues. Their power lies in bringing disparate data points into a common, understandable scale.
Data Preprocessing for Machine Learning
One of the most critical applications of z-scores in technology is in data preprocessing for machine learning models. Many algorithms, especially those that rely on distance calculations (like K-Nearest Neighbors, Support Vector Machines, or neural networks using gradient descent), perform better or even require features to be on a similar scale. Features with large ranges can dominate the learning process, leading to biased models.
Standardization using z-scores (also known as Z-score normalization) transforms features to have a mean of 0 and a standard deviation of 1. This process ensures that all features contribute equally to the model, preventing features with larger numerical values from disproportionately influencing the results. For example, if a dataset includes ‘user age’ (range 18-80) and ‘monthly income’ (range 0-10,000+), standardizing these features ensures that neither one artificially outweighs the other simply due to its scale. This is a fundamental step in many machine learning pipelines, improving model convergence and performance.
Anomaly Detection and Outlier Identification
In digital security, network monitoring, and system diagnostics, identifying unusual behavior or outliers is paramount. Z-scores provide an excellent statistical tool for anomaly detection. Data points with high absolute z-scores (e.g., $|z| > 2$ or $|z| > 3$) are often considered outliers because they lie significantly far from the mean.
For instance, in monitoring server logs, an unusually high number of error messages or login attempts per minute could have a high z-score, immediately signaling a potential issue like a denial-of-service attack or a software bug. Similarly, in IoT sensor data, a sudden spike or drop in temperature readings might generate an extreme z-score, indicating a sensor malfunction or an environmental anomaly requiring attention. This ability to quantify “unusualness” makes z-scores indispensable for proactive monitoring and incident response in technology.
Practical Applications Across Tech Domains
Beyond core data science, z-scores find practical utility in various specialized areas within the tech industry, helping professionals make data-driven decisions and improve systems.
Performance Monitoring and System Health
For DevOps teams and site reliability engineers (SREs), continuously monitoring system performance is a daily challenge. Z-scores can be applied to metrics like CPU utilization, memory consumption, disk I/O, or network latency. By calculating z-scores for these metrics in real-time or near real-time, engineers can quickly identify deviations from normal operating patterns. A sudden z-score spike in CPU usage on a particular server, even if the raw value isn’t an absolute maximum, could indicate an application bottleneck or an unexpected workload, allowing engineers to intervene before a critical outage occurs. This provides a more sensitive and context-aware alerting mechanism than simple threshold-based alerts.
A/B Testing and Experimentation
In product development and user experience (UX) research, A/B testing is a common practice to compare two versions of a feature or design. While hypothesis testing (like t-tests or chi-squared tests) is typically used for statistical significance, understanding the distribution of user metrics (e.g., click-through rates, conversion times) within each group can still benefit from z-score analysis. For instance, if a new UI design (Variant B) shows a slightly higher average conversion rate than the old UI (Variant A), z-scores can help understand if individual user behaviors within Variant B are consistently above average or if the mean is skewed by a few extreme positive outliers. This deeper dive helps refine understanding beyond just “statistically significant.”
Quality Control and Process Optimization
In software development and manufacturing (e.g., hardware production), quality control relies heavily on data. Z-scores can be used to monitor the quality of code commits (e.g., number of bugs introduced relative to average), build times, or even the performance metrics of hardware components during testing. By setting control limits based on z-scores, teams can identify when a process is going out of control or when a particular build or component deviates significantly from the expected norm, triggering investigations and corrective actions.
Integrating Z-Scores into AI Tools and Software
The practical application of z-scores is heavily facilitated by modern programming languages, statistical libraries, and specialized software tools. Data scientists and developers rarely calculate z-scores manually for large datasets.
Libraries and Frameworks
Popular programming languages like Python and R offer robust libraries that make z-score calculations trivial.
- In Python, libraries such as NumPy and SciPy provide functions for calculating means, standard deviations, and z-scores directly. Scikit-learn, a widely used machine learning library, includes
StandardScaler, which performs z-score normalization on entire datasets, a crucial step before training many models. - R, designed for statistical computing, has built-in functions to perform these calculations efficiently.
These tools allow for the rapid and scalable application of z-score transformations across massive datasets, integrating seamlessly into automated data pipelines and analytical workflows.
Visualizing Z-Score Distributions
Beyond numerical calculation, visualizing z-score distributions is an insightful way to understand data. Histograms of z-scores typically show a distribution centered around zero, with most values falling between -2 and +2 for many real-world datasets. Plotting z-scores over time (e.g., a control chart) can instantly highlight trends or anomalous periods in system performance or user activity. Tools like Matplotlib and Seaborn in Python, or ggplot2 in R, enable powerful visualizations that make z-score insights immediately accessible to technical and non-technical stakeholders alike.
Best Practices and Considerations
While z-scores are incredibly useful, their effective application requires an understanding of their underlying assumptions and limitations.
Data Distribution Assumptions
Z-scores are most powerful when applied to data that is approximately normally distributed. In a perfectly normal distribution, approximately 68% of data falls within $pm 1$ standard deviation, 95% within $pm 2$ standard deviations, and 99.7% within $pm 3$ standard deviations. This rule of thumb allows for quick interpretation of z-scores. However, for heavily skewed distributions, a high z-score might not have the same intuitive “outlier” meaning. In such cases, other normalization techniques or statistical tests might be more appropriate, or the z-score should be interpreted with caution.

Interpreting Extreme Z-Scores
What constitutes an “extreme” z-score often depends on the context. A z-score of 2 might be an anomaly in a highly stable system, whereas in a very noisy dataset, a z-score of 3 might be considered the threshold for an outlier. It’s crucial to combine statistical thresholds with domain knowledge. An unusually high z-score for network latency during peak hours might be acceptable, but the same z-score late at night could indicate a serious problem. Therefore, establishing appropriate thresholds for anomaly detection with z-scores requires careful consideration and often iterative refinement based on observed system behavior and business impact.
In summary, the z-score is far more than a simple statistical formula; it’s a versatile tool that empowers technologists to standardize data, identify anomalies, preprocess data for advanced algorithms, and monitor systems with greater precision. Its intuitive interpretation of relative position makes it an indispensable asset in the data-driven world of technology.
aViewFromTheCave is a participant in the Amazon Services LLC Associates Program, an affiliate advertising program designed to provide a means for sites to earn advertising fees by advertising and linking to Amazon.com. Amazon, the Amazon logo, AmazonSupply, and the AmazonSupply logo are trademarks of Amazon.com, Inc. or its affiliates. As an Amazon Associate we earn affiliate commissions from qualifying purchases.