
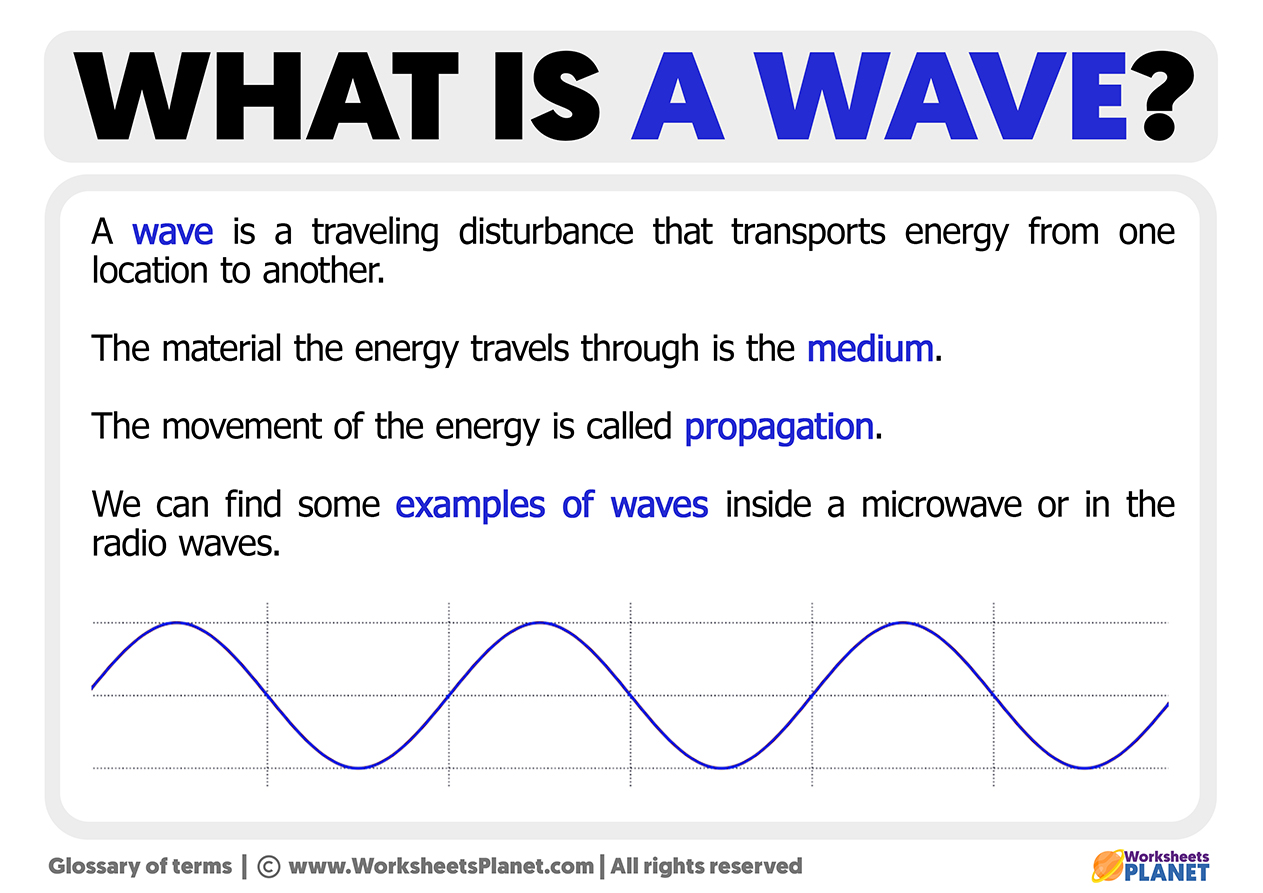
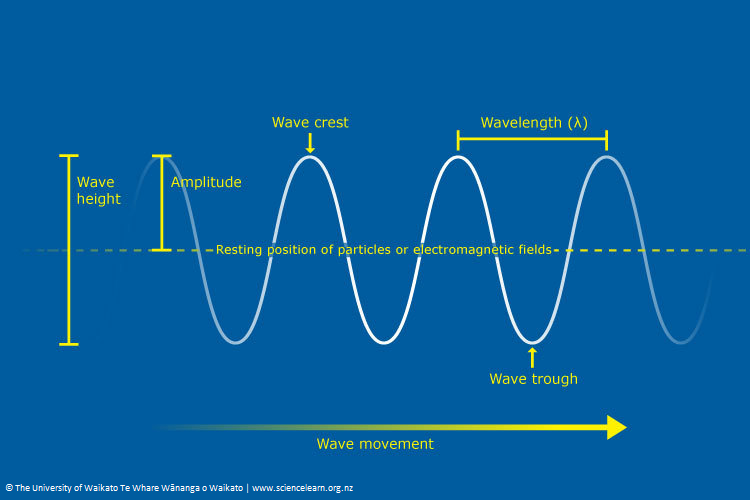
In the world of finance and investing, price movements are rarely linear. To the untrained eye, the fluctuating numbers on a stock ticker or a crypto exchange might seem like chaotic noise. However, to seasoned analysts and professional traders, these movements represent something much more profound: the “wave.” When asking “what does the wave mean” in a financial context, we are typically referring to the Elliott Wave Theory—a method of analysis that suggests market prices move in specific, recognizable patterns driven by the collective psychology of investors.
Understanding the wave is about more than just reading a chart; it is about deciphering the ebb and flow of human emotion, greed, and fear as they manifest in the global markets. By mastering this concept, investors can gain a clearer perspective on where a market has been and, more importantly, where it is likely to go.
The Origin of the Wave: Understanding the Psychology of Markets
To understand what the wave means, one must first look at its origins. The concept was developed by Ralph Nelson Elliott in the 1930s. After studying decades of stock market data, Elliott discovered that the market did not behave in a chaotic manner but instead moved in repetitive cycles. He proposed that these cycles were a direct result of investor psychology, which swings from extreme optimism to deep pessimism in predictable sequences.
Ralph Nelson Elliott’s Discovery
Elliott’s breakthrough was the realization that social mood—the collective mindset of all market participants—is the primary driver of price action. He observed that trends in financial markets result from a series of “waves” that reflect the changing sentiments of the crowd. When the crowd is bullish, the wave moves upward; when the crowd is fearful, the wave recedes. This discovery transformed technical analysis from a simple study of price into a complex study of human behavior.
The Fractal Nature of Financial Markets
One of the most critical aspects of what the wave means is its fractal nature. In mathematics, a fractal is a pattern that repeats itself at every scale. Elliott observed that market waves function the same way. A large wave lasting decades (a “Grand Supercycle”) is composed of smaller waves lasting years, which are further composed of waves lasting weeks, days, or even minutes. This means that whether you are a day trader or a long-term retirement investor, the “wave” remains a relevant framework for understanding market direction.
Breaking Down the Structure: Motive and Corrective Waves
At its core, the wave represents a cycle of progress and regression. In the Elliott Wave framework, the market moves in a basic 5-3 pattern. This consists of a five-wave “motive” phase that establishes the trend, followed by a three-wave “corrective” phase that retraces part of that progress.
The Five-Wave Pattern (The Impulse)
The motive phase, or the impulse wave, is the engine of market growth. It consists of five distinct sub-waves, labeled 1, 2, 3, 4, and 5. Waves 1, 3, and 5 move in the direction of the primary trend, while waves 2 and 4 are minor interruptions.
- Wave 1: The initial move upward, often driven by a small group of “smart money” investors who see value before the general public.
- Wave 3: Usually the longest and most powerful wave. This is when the broader market realizes a trend is happening, leading to mass participation and significant price gains.
- Wave 5: The final push. This wave is often driven by retail FOMO (fear of missing out) and exuberant sentiment, signaling that the trend is nearing exhaustion.
The Three-Wave Correction (The Retracement)
Once the five-wave motive sequence is complete, the market must “breathe.” This is the corrective phase, labeled A, B, and C.
- Wave A: The first sign that the bull market is over. Prices begin to drop as early investors take profits.
- Wave B: A “sucker’s rally.” Prices bounce back temporarily, leading many to believe the uptrend is resuming, but this move usually lacks the volume and conviction of the previous motive waves.
- Wave C: The final leg of the correction. This wave is typically sharp and decisive, washing out the remaining bulls and resetting the market sentiment for the next cycle.
Identifying the Phases: What Each Wave Signals to Investors
To truly grasp what the wave means for your portfolio, you must learn to identify which phase the market is currently in. Each wave carries a specific narrative and emotional profile that can help you make better financial decisions.

Wave 1 and Wave 2: The Initial Spark and the Skepticism
In the beginning (Wave 1), the “meaning” of the wave is often hidden. Fundamental news is usually still negative, and the general public is bearish. When Wave 2 occurs—a retracement of the first move—it often feels like the market is going back to its previous lows. However, for the astute investor, Wave 2 is a buying opportunity. The key rule here is that Wave 2 never retraces more than 100% of Wave 1; if it stays above the starting point, the new trend is confirmed.
Wave 3: The Powerhouse of Profit
Wave 3 is the most important wave for building wealth. What does the wave mean during this phase? It means conviction. This is where corporate earnings improve, economic data turns positive, and the trend becomes undeniable. Most of the money in the stock market is made during Wave 3. For investors, the goal is to identify the start of Wave 3 and ride it as long as possible.
Wave 4 and Wave 5: Consolidation and Euphoria
Wave 4 is a period of consolidation. It is often a complex, sideways movement that tests the patience of investors. Following this, Wave 5 represents the final “blow-off top.” During Wave 5, valuations often become disconnected from reality. This is when your neighbor, who has never invested before, starts giving you stock tips. Understanding that you are in Wave 5 is a signal to begin tightening stop-losses and preparing for the inevitable “A-B-C” correction.
Practical Application: Using Wave Theory in Modern Investing
Knowing the theory is one thing; applying it to make money is another. In modern finance, “the wave” is used alongside other tools to create a comprehensive trading or investing strategy.
Integrating Fibonacci Levels
Elliott Wave Theory is deeply linked to Fibonacci sequence numbers. In nature and finance, the “golden ratio” (1.618) appears frequently. Analysts use Fibonacci retracement and extension levels to predict how far a wave will travel. For example, Wave 3 is often 1.618 times the length of Wave 1. By combining wave counting with Fibonacci tools, investors can set precise entry and exit points, reducing the guesswork in their financial planning.
Common Pitfalls and Limitations
While the wave provides a powerful roadmap, it is not a crystal ball. One of the biggest challenges is “wave labeling” in real-time. It is much easier to see the waves in hindsight than it is while they are forming. Markets can be messy, and “truncations” or “extensions” can occur, where waves don’t reach their expected targets. Therefore, the wave should be used as a probability tool, not a certainty. Diversification and risk management remain essential, regardless of how clear a wave pattern may seem.
The Future of Wave Analysis in an AI-Driven Market
As we move further into the digital age, the way we interpret what the wave means is evolving. High-frequency trading and artificial intelligence are now major players in the financial markets.
Algorithmic Trading and Pattern Recognition
Modern financial tools and AI algorithms are specifically designed to recognize Elliott Wave patterns faster than any human could. These tools scan thousands of assets simultaneously to find the start of a Wave 3 or the completion of a Wave C. This has led to more efficient markets but also more volatility. For the individual investor, this means that “riding the wave” requires more discipline than ever, as algorithms can trigger rapid sell-offs or rallies based on these technical milestones.
The Human Element in a Digital World
Despite the rise of AI, the fundamental “meaning” of the wave remains unchanged because it is rooted in human nature. Even when trades are executed by machines, those machines are programmed based on human-defined parameters of fear and greed. As long as humans are the ultimate owners of capital, the market will continue to move in waves. For the modern investor, the wave represents a timeless bridge between the psychological triggers of the past and the technological tools of the future.
Conclusion: Riding the Wave to Financial Literacy
So, what does the wave mean? It means that the market is a living, breathing entity driven by the collective consciousness of millions of participants. It is a visual representation of the cycle of growth, setback, and renewal that defines the global economy.
By understanding the structure of motive and corrective waves, recognizing the emotional phases of the market, and using technical tools like Fibonacci levels, you can transform your relationship with money. Instead of being swept away by the unpredictable tides of the market, you can learn to read the currents, identify the direction of the trend, and strategically position yourself to ride the wave toward long-term financial success. In a world of financial uncertainty, the wave offers a roadmap—a way to find order in the chaos and opportunity in the fluctuations.
aViewFromTheCave is a participant in the Amazon Services LLC Associates Program, an affiliate advertising program designed to provide a means for sites to earn advertising fees by advertising and linking to Amazon.com. Amazon, the Amazon logo, AmazonSupply, and the AmazonSupply logo are trademarks of Amazon.com, Inc. or its affiliates. As an Amazon Associate we earn affiliate commissions from qualifying purchases.