
While the common answer to the question of what temperature is required for snow is a straightforward “32 degrees Fahrenheit or 0 degrees Celsius,” the reality behind the phenomenon is a complex interplay of atmospheric physics, thermodynamics, and high-level computational modeling. In the modern era, determining when and where snow will fall has evolved from simple thermometer readings to a sophisticated technological discipline involving satellite arrays, global sensor networks, and machine learning algorithms.
Understanding the temperature required for snow necessitates looking beyond the ground-level thermometer and into the vertical structure of the atmosphere. Meteorologists and data scientists use a suite of digital tools to analyze the “atmospheric column”—the pillar of air stretching from the clouds to the surface. For a snowflake to reach your doorstep, it must survive a journey through various thermal layers, a process that current technology monitors with increasing precision.

Beyond the Freezing Point: The Complex Thermal Profile of Atmospheric Layers
The fundamental challenge in predicting snow lies in the fact that the temperature at the surface is often a lagging indicator of what is happening in the troposphere. Technological advancements in meteorological instrumentation now allow us to map these layers in three dimensions, providing a more nuanced answer than a single temperature point.
Understanding the Vertical Temperature Profile
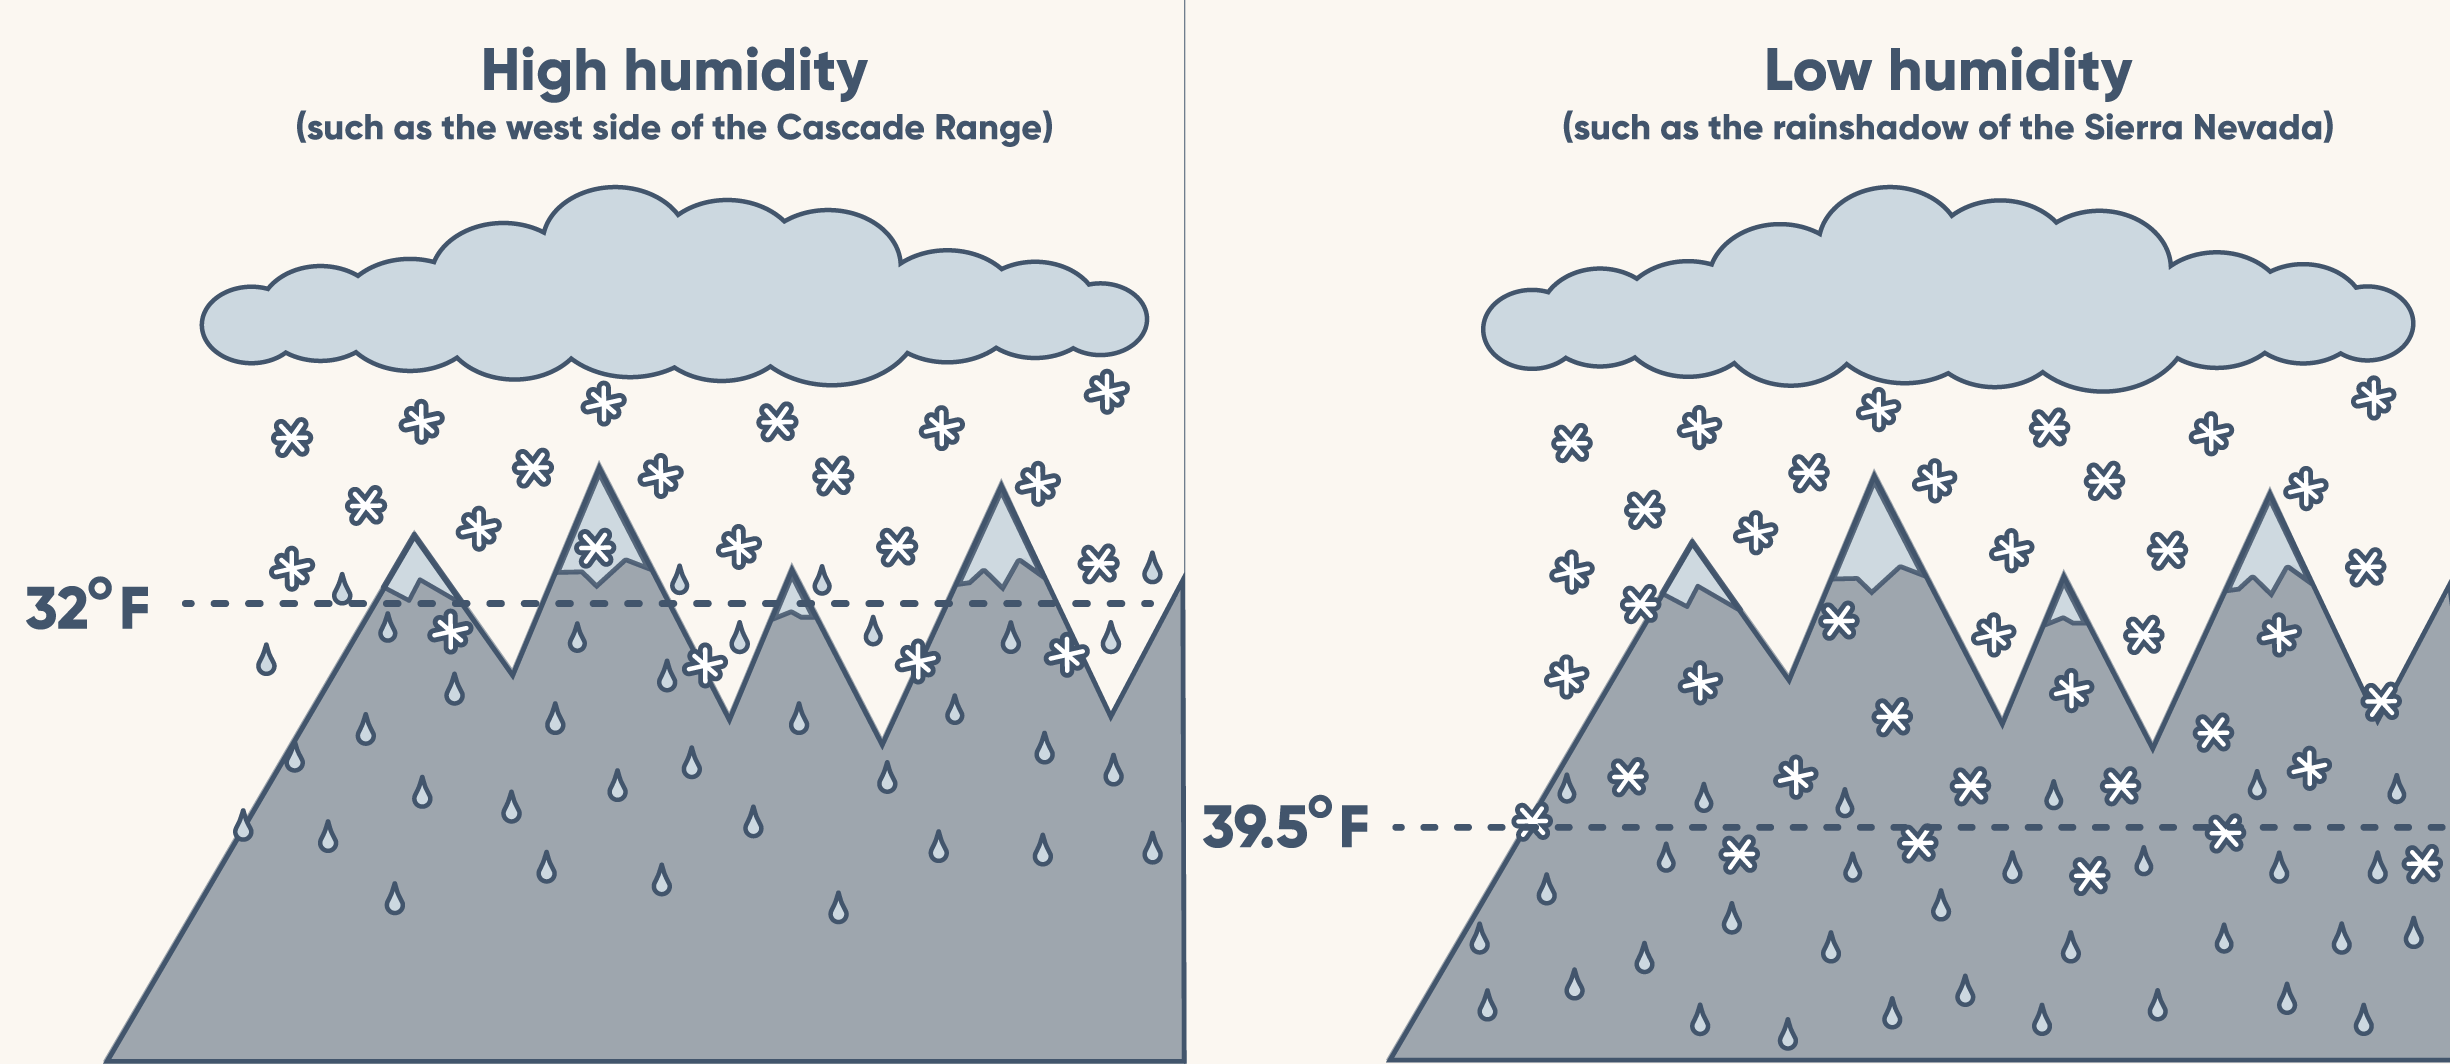
To predict snow, technology must track the “vertical temperature profile.” Snow typically forms when the entire column of air, from the cloud base to the ground, is at or below freezing. However, snow can still fall when surface temperatures are as high as 41°F (5°C), provided the upper atmosphere is sufficiently cold and the air is dry.
Meteorologists utilize Radiosondes—sensor packages carried by weather balloons—to transmit real-time data on temperature, pressure, and humidity at various altitudes. These sensors are essential for identifying “warm noses,” or layers of air above freezing that are sandwiched between freezing layers. If a snowflake hits a warm nose, it melts; if it then hits a sub-freezing layer near the ground, it becomes sleet or freezing rain. Sophisticated software suites like the Advanced Weather Interactive Processing System (AWIPS) allow forecasters to visualize these profiles and determine the exact “melt-rate” of precipitation before it reaches the sensor.
The Role of Humidity and Wet-Bulb Calculations
Temperature alone is an insufficient metric; the “wet-bulb temperature” is the critical data point for snow prediction. The wet-bulb temperature accounts for how much cooling can occur through evaporation. When snow falls into dry air, it evaporates (or more accurately, sublimes), a process that absorbs heat and cools the surrounding air. This is known as “evaporative cooling.”
Advanced digital weather stations now automatically calculate the wet-bulb temperature by integrating humidity and dry-bulb data. If the wet-bulb temperature is below 32°F, precipitation can turn from rain to snow as it falls, effectively cooling the atmosphere down to the necessary threshold. This phase-change technology is why modern weather apps can sometimes predict “rain changing to snow” with high accuracy, even when current temperatures suggest it is too warm.
High-Performance Computing and the Evolution of Snow Forecasting Models
The transition from a raindrop to a snowflake is a problem of fluid dynamics and thermodynamics that requires immense processing power. Modern weather prediction relies on Numerical Weather Prediction (NWP) models, which are run on some of the world’s most powerful supercomputers.
Numerical Weather Prediction (NWP) Systems
Models such as the Global Forecast System (GFS) and the European Centre for Medium-Range Weather Forecasts (ECMWF) divide the atmosphere into a massive grid of three-dimensional cells. Within each cell, the software calculates equations for the conservation of mass, momentum, and energy. To answer “what temperature it must be to snow,” the model calculates the probability of frozen precipitation based on the moisture content and temperature of every cell the particle must pass through.
The resolution of these grids has increased dramatically. While older models might have viewed a 50-mile area as a single data point, modern high-resolution models can zoom in on 1-kilometer squares. This allows technology to account for “lake effect” snow or “orographic lift” (snow caused by mountains), where local temperatures can be significantly lower than the surrounding regional average.
The Impact of High-Resolution Rapid Refresh (HRRR) Models
For short-term snow forecasting, the HRRR model is a pinnacle of meteorological tech. It refreshes every hour, using the latest radar data to update its temperature and precipitation maps. The HRRR is particularly adept at identifying the “rain-snow line,” a digital boundary where the temperature profile shifts just enough to change the precipitation type. By processing satellite infrared data and Doppler radar returns, these models can predict the exact moment surface temperatures will drop enough to allow for accumulation, providing critical lead time for city infrastructure and transit systems.
IoT and Ground-Level Sensing: Precision Data for Real-Time Snow Analysis

While atmospheric models provide the “big picture,” the Internet of Things (IoT) has revolutionized our ability to track ground-level conditions. High-density sensor networks provide the “ground truth” that validates or corrects the predictions made by high-altitude models.
Remote Sensing via Satellite and Radar
The GOES-R series of satellites represents a massive leap in snow-monitoring technology. These satellites use multi-spectral imaging to distinguish between clouds, snow cover, and ice. By measuring the “brightness temperature” of the clouds from space, meteorologists can determine the temperature at which the ice crystals are forming within the cloud deck.
On the ground, Dual-Polarization Doppler Radar has changed the game. Unlike older radar that only sent out horizontal pulses, “Dual-Pol” radar sends both horizontal and vertical pulses. This allows the system to determine the size and shape of the falling particles. Because snowflakes are differently shaped than raindrops, the radar software can identify the exact altitude where snow is melting into rain. This technological “melting layer” detection is vital for understanding the temperature thresholds in real-time.
Smart City Infrastructure and Winter Maintenance Tech
In many modern cities, “Smart Pavement” technology is used to monitor the temperature required for snow to stick. Embedded sensors in roads and bridges measure pavement temperature, salinity, and moisture levels. This data is transmitted via IoT gateways to central command centers.
These systems don’t just ask what the air temperature is; they measure the “latent heat” of the concrete. If the air temperature is 30°F but the pavement is 35°F, the snow will melt on impact. This technological distinction allows for the more efficient use of automated de-icing systems and salt-spreading drones, which are triggered only when the sensors detect that the “sticking threshold” has been reached.
The Role of AI and Machine Learning in Refining Snow Predictions
We are currently entering an era where traditional physics-based models are being augmented—and in some cases replaced—by Artificial Intelligence (AI). AI excels at finding patterns in historical weather data that humans or standard equations might miss.
Pattern Recognition in Historical Weather Datasets
AI tools are trained on decades of historical temperature and snowfall data. By analyzing thousands of past “near-miss” snow events (where it was cold enough to snow but didn’t), machine learning models can identify subtle correlations between barometric pressure shifts and rapid temperature drops.
For instance, Google’s GraphCast and NVIDIA’s FourCastNet are AI models that can predict atmospheric variables significantly faster than traditional NWP models. These AI tools are particularly useful at predicting “wet snow” vs. “dry snow” by analyzing the moisture-to-temperature ratio (known in the industry as the Snow-to-Liquid Ratio or SLR). While the standard SLR is 10:1 (ten inches of snow for one inch of rain), AI can predict if a specific temperature profile will result in a 20:1 “powder” or a 5:1 “slush,” which is critical for calculating the structural load on power lines and buildings.
Probabilistic Forecasting for Micro-Climates
One of the most difficult things for technology to predict is the “micro-climate”—the temperature variation in a specific valley or behind a specific set of buildings. AI-driven “downscaling” takes broad temperature data and applies it to highly detailed topographic maps. This allows for probabilistic forecasting, where the software provides a percentage chance of snow for a specific street address based on its unique elevation and heat-island effect.
The Digital Frontier of Personal Weather Monitoring
Finally, the technology used by the average consumer has reached a level of sophistication previously reserved for government agencies. The proliferation of personal weather stations (PWS) and hyper-local apps has created a massive, crowdsourced data network.
Consumer-Grade Hardware and the Crowdsourcing of Data
Devices like the Tempest Weather System or Netatmo stations use haptic rain sensors and high-precision thermistors to provide real-time data to a global network. When thousands of these devices are linked, they create a “live” temperature map that is far more granular than official airport weather stations.
Apps like Dark Sky (now integrated into Apple Weather) and AccuWeather use this “mashing” of data—official satellite feeds combined with crowdsourced ground temperatures—to provide “hyper-local” alerts. These apps can tell a user exactly what the temperature is in their backyard and if it is currently cold enough for the falling precipitation to be snow, often with minute-by-minute precision.
As we move forward, the question of what temperature it must be to snow will be answered with even greater digital accuracy. Through the integration of AI, IoT sensors, and high-performance computing, we are moving away from general rules of thumb and toward a personalized, high-tech understanding of the atmosphere’s every move. The “freezing point” is no longer just a mark on a glass tube; it is a dynamic data point in a global, digital simulation of our world.
aViewFromTheCave is a participant in the Amazon Services LLC Associates Program, an affiliate advertising program designed to provide a means for sites to earn advertising fees by advertising and linking to Amazon.com. Amazon, the Amazon logo, AmazonSupply, and the AmazonSupply logo are trademarks of Amazon.com, Inc. or its affiliates. As an Amazon Associate we earn affiliate commissions from qualifying purchases.