
The stock market is a dynamic, complex ecosystem, a barometer of economic health and corporate performance. For investors, businesses, and indeed the global economy, the daily movements of the stock market are a constant source of fascination, concern, and opportunity. Far from being a static entity, the stock market is a living, breathing mechanism, constantly reacting to a myriad of inputs ranging from corporate earnings reports to geopolitical shifts. Understanding “what the stock market does today” isn’t merely about checking a ticker; it’s about deciphering the forces that shape wealth, influence policy, and signal future trends. This daily scrutiny helps investors gauge their portfolios’ health, evaluate potential opportunities, and navigate the inherent volatility of financial assets.
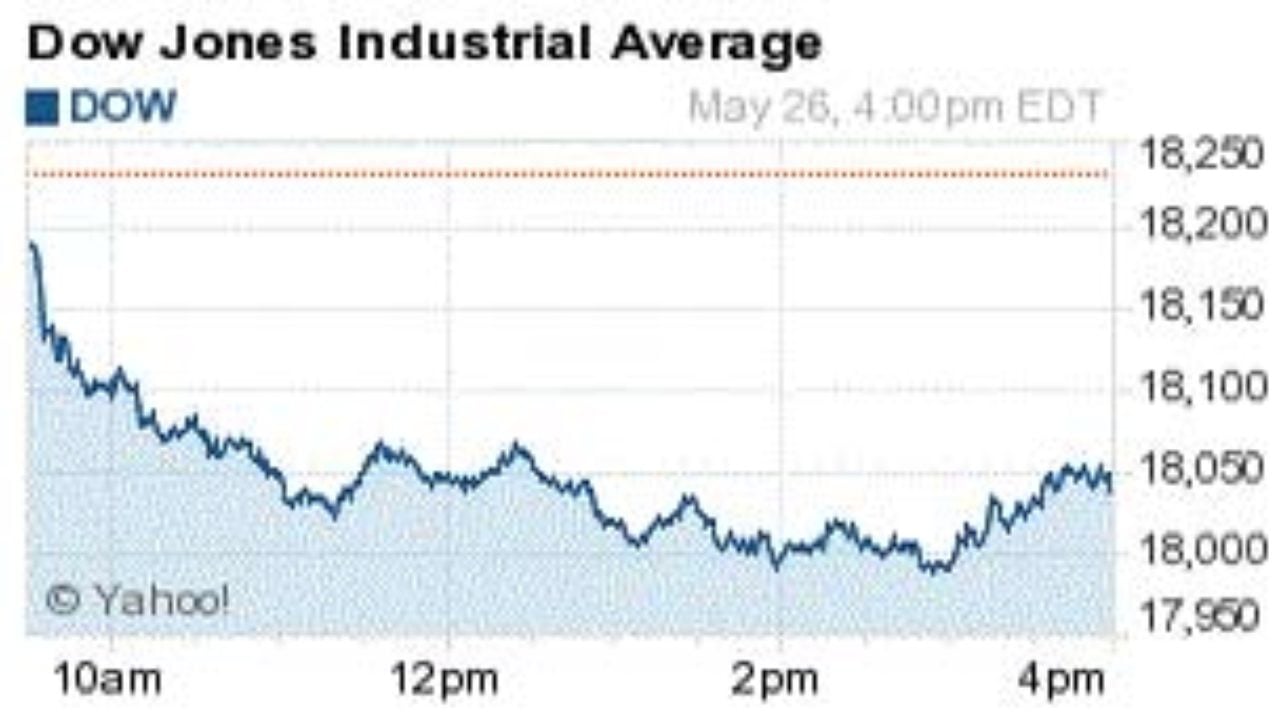
Every trading day, billions of dollars change hands as buyers and sellers negotiate prices for shares of publicly traded companies. This collective activity dictates whether the market indices rise or fall, signaling periods of optimism or apprehension. For the uninitiated, these daily fluctuations can seem random or overwhelming, yet beneath the surface lies a logical, albeit intricate, interplay of economic fundamentals, investor sentiment, and technological advancements. Delving into what moves the market on any given day reveals the intricate dance between present realities and future expectations, all distilled into the single metric of share price.
The Daily Pulse of Global Markets
Monitoring the stock market’s daily activity is a fundamental practice for anyone involved in finance, from seasoned institutional investors to individual retail traders. The “pulse” of the market is usually encapsulated by the performance of its major indices, but a deeper dive reveals the granular movements that inform these headline figures.
Key Indices and Their Significance
When people ask “how did the market do today?”, they are typically referring to the performance of several benchmark indices. In the United States, the most frequently cited are:
- Dow Jones Industrial Average (DJIA): Comprising 30 large, publicly owned companies, the Dow is a price-weighted index that represents approximately a quarter of the value of the entire U.S. stock market. Its movements often reflect the performance of established industrial giants.
- S&P 500 (Standard & Poor’s 500): A market-cap-weighted index of 500 large U.S. companies, the S&P 500 is widely considered the best gauge of large-cap U.S. equities and a proxy for the broader economy’s health.
- Nasdaq Composite: Heavily weighted towards technology and growth companies, the Nasdaq Composite tracks over 3,000 stocks, making it a critical indicator for the tech sector and emerging innovative businesses.
Beyond these, global markets have their own benchmarks, such as the FTSE 100 in London, the Nikkei 225 in Tokyo, and the DAX in Frankfurt, all of which contribute to the global financial narrative. Their daily movements are reported widely and provide an immediate snapshot of market sentiment and direction.
Real-Time Data and Reporting
The stock market’s daily activity unfolds during specific trading hours, typically 9:30 AM to 4:00 PM Eastern Time in the U.S. However, market influence begins well before the opening bell with pre-market trading and extends into after-hours sessions. Investors rely on real-time data feeds, financial news outlets, and specialized platforms to track price movements, trading volumes, and breaking news. These platforms offer instant updates on individual stock performance, sector trends, and overall index movements, allowing for immediate analysis and reaction to market-moving events. The speed and accuracy of this information are paramount in a world where microseconds can mean millions.
Driving Forces Behind Daily Fluctuations
The stock market’s daily dance of ups and downs is not random. It is meticulously choreographed by a complex interplay of identifiable factors, each capable of shifting sentiment and valuations. Understanding these catalysts is key to comprehending market behavior.
Economic Indicators
Macroeconomic data provides the broadest strokes to the market’s daily painting. Releases such as:
- Inflation Reports (CPI, PPI): Higher-than-expected inflation can signal tighter monetary policy, dampening investor enthusiasm.
- Jobs Data (Non-Farm Payrolls, Unemployment Rate): A strong labor market often indicates robust economic health, though too hot a market can also spark inflation fears.
- Gross Domestic Product (GDP): This measure of economic output provides a comprehensive look at growth, with stronger growth generally boosting market confidence.
- Consumer Confidence and Retail Sales: These reports reflect the spending power and sentiment of the average consumer, a critical driver of corporate revenue.
Each piece of data is scrutinized for its implications on corporate profitability, consumer spending, and the future course of interest rates, often leading to immediate market reactions.
Corporate Earnings and News
While macroeconomic data sets the stage, corporate-specific news often drives individual stock and sector movements. Quarterly earnings reports are perhaps the most anticipated events, where companies disclose their financial performance. Surprises, whether positive or negative, can lead to dramatic swings in stock prices. Beyond earnings, other corporate news like:
- Mergers and Acquisitions (M&A): Can significantly impact the valuations of acquiring and target companies.
- Product Launches and Innovation: Success or failure of new products can reshape market perceptions.
- Changes in Management or Guidance: Leadership shifts or revised financial forecasts can alter investor confidence.
- Regulatory Decisions: Government rulings or antitrust actions can have profound implications for specific industries.
These events provide granular detail on the health and future prospects of the companies that constitute the market.
Geopolitical and Macroeconomic Events
The stock market is intrinsically linked to global events. Geopolitical tensions, international trade disputes, and central bank actions can have far-reaching effects:
- Central Bank Decisions: Interest rate hikes or cuts by central banks (like the Federal Reserve) directly influence borrowing costs, corporate profits, and investment attractiveness. Quantitative easing or tightening also has significant market implications.
- Geopolitical Conflicts: Wars, political instability, or significant international policy shifts can introduce uncertainty, driving investors towards safe-haven assets and away from riskier equities.
- Commodity Price Volatility: Sharp changes in oil prices, for instance, can impact energy companies directly and all industries reliant on transportation and raw materials.
Such events can trigger broad market corrections or rallies, transcending individual company performance.
Investor Sentiment and Market Psychology
Beyond fundamentals, the collective psychology of millions of investors plays a crucial role. Fear and greed are powerful emotions that can override rational analysis, leading to herd mentality:
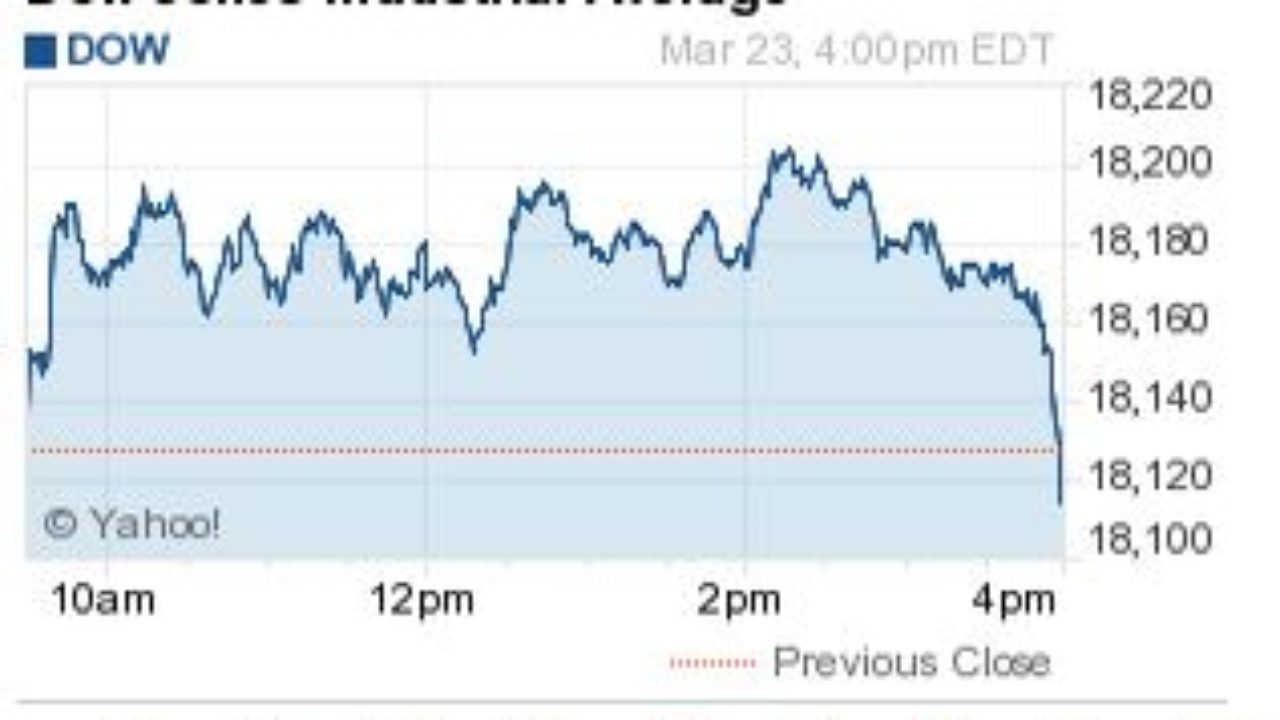
- Fear: During periods of uncertainty or negative news, fear can trigger sell-offs, even for fundamentally sound companies.
- Greed: Optimism, sometimes unfounded, can lead to speculative buying, driving asset prices to unsustainable levels.
- Technical Analysis: Many traders use chart patterns and indicators to gauge market sentiment and predict future price movements, further influencing daily trading decisions.
These psychological factors can amplify or dampen the effects of economic and corporate news, adding a layer of unpredictability to daily market action.
Interpreting Market Movements: Beyond the Headlines
Simply knowing if the market went up or down isn’t enough. A nuanced understanding requires looking beyond the headline figures and distinguishing meaningful signals from daily noise.
Short-Term Volatility vs. Long-Term Trends
Daily stock market movements are characterized by volatility – constant, often sharp, fluctuations. While these provide constant news fodder, it’s crucial for investors to differentiate short-term noise from underlying long-term trends. A single day’s decline or surge rarely dictates a multi-year investment outcome. Long-term trends are shaped by fundamental economic growth, technological progress, and sustained corporate profitability, often prevailing over daily headline reactions. Focusing too heavily on short-term volatility can lead to impulsive decisions detrimental to long-term goals.
Sectoral Performance and Rotation
On any given day, different sectors of the economy will perform differently. For example, a rise in oil prices might boost energy stocks while simultaneously increasing costs for airlines, dampening their performance. This “sector rotation” is a common market phenomenon, reflecting shifts in economic conditions, investor preferences, or breaking news impacting specific industries. Identifying which sectors are leading or lagging can provide insights into current market themes and potential future trends, helping investors adjust their allocations strategically.
The Role of Volume and Breadth
Two less-talked-about indicators provide deeper insights into the market’s daily health:
- Trading Volume: A high volume accompanying a price move suggests stronger conviction behind that move. For example, a significant price increase on high volume is generally seen as more robust than a similar increase on low volume.
- Market Breadth: This refers to the number of advancing stocks versus declining stocks. If major indices are up but a majority of individual stocks are down (poor breadth), it suggests the rally might be concentrated in a few large companies and isn’t broadly supported. Good breadth, where most stocks are participating in a rally or decline, indicates stronger underlying momentum.
These metrics offer a more granular view than just index levels, revealing the underlying strength or weakness of market movements.
Practical Implications for Investors
For individual investors, understanding “what the stock market does today” should inform, not dictate, investment decisions. A strategic approach is far more effective than an emotional, reactionary one.
Avoiding Emotional Decisions
The constant stream of market news and daily fluctuations can be emotionally taxing. Reacting to every dip or surge by buying or selling can lead to poor decision-making, often resulting in buying high and selling low. A disciplined approach, sticking to a well-researched investment plan, and resisting the urge to make impulsive trades based on daily headlines are critical for long-term success. The market’s daily movements are best viewed as information, not instructions.
Diversification and Long-Term Strategy
The daily volatility of the stock market underscores the importance of diversification. Spreading investments across different asset classes (stocks, bonds, real estate), industries, and geographies helps mitigate risk. If one sector or region performs poorly on a given day, others might perform well, balancing the overall portfolio. Furthermore, maintaining a long-term investment horizon allows investors to ride out short-term market turbulence, benefiting from the compounding power of returns over years and decades. Market history consistently shows that patience and a long-term perspective tend to be rewarded.
Utilizing Financial Tools and Advice
For those seeking to navigate the daily complexities, a wealth of financial tools and professional advice is available. Online brokerage platforms offer advanced analytics, research reports, and charting tools. Financial advisors can provide personalized guidance, helping individuals set realistic goals, build diversified portfolios, and stay disciplined amidst market swings. Educational resources, from financial news websites to investment books, empower individuals to make informed decisions and better understand the daily narrative of the stock market.
Looking Ahead: The Future of Market Analysis
The methods by which we analyze and react to daily market movements are constantly evolving, driven by technological advancements and increasing global interconnectedness.
Algorithmic Trading and AI
The future of market analysis is increasingly shaped by artificial intelligence and algorithmic trading. High-frequency trading algorithms execute millions of trades per second, reacting to data faster than any human possibly could. AI-driven platforms can analyze vast datasets, including news sentiment, economic indicators, and historical patterns, to predict market movements and execute trades autonomously. This trend means that daily market reactions are becoming even faster and more complex, sometimes driven by machine logic rather than human emotion, though human sentiment still feeds into the algorithms.
Global Interconnectedness
Today’s stock markets are more interconnected than ever. News from Asia can impact European markets, which in turn influence American markets. Global supply chains, international trade agreements, and cross-border investments mean that a significant event in one part of the world can create ripple effects across all major exchanges. This interconnectedness necessitates a global perspective when interpreting what the stock market does today, acknowledging that local market performance is often a reflection of broader international dynamics.
Conclusion
“What does the stock market do today?” is a question that opens a window into the intricate mechanisms of global finance. It reveals a dynamic interplay of economic fundamentals, corporate performance, geopolitical events, and human psychology, all unfolding in real-time. For investors, understanding these daily movements is not about chasing immediate gains or succumbing to panic, but rather about gathering insights that inform a disciplined, long-term investment strategy. By focusing on the broader trends, diversifying portfolios, and leveraging reliable information and professional advice, individuals can navigate the daily ebb and flow of the market with confidence, turning volatility into opportunity and securing their financial future. The stock market’s daily narrative is a rich tapestry of data, emotion, and opportunity, demanding both careful observation and strategic foresight.
aViewFromTheCave is a participant in the Amazon Services LLC Associates Program, an affiliate advertising program designed to provide a means for sites to earn advertising fees by advertising and linking to Amazon.com. Amazon, the Amazon logo, AmazonSupply, and the AmazonSupply logo are trademarks of Amazon.com, Inc. or its affiliates. As an Amazon Associate we earn affiliate commissions from qualifying purchases.