
The Gini index is a crucial metric used to understand the distribution of wealth or income within a population. While its origins lie in economics, its implications ripple through various facets of society, influencing policy, social mobility, and even market dynamics. At its core, the Gini index quantifies the degree of inequality. A Gini index of 0 represents perfect equality, where everyone has the same income or wealth. Conversely, a Gini index of 1 (or 100%) signifies perfect inequality, where one individual holds all the income or wealth, and everyone else has nothing. Understanding this index is fundamental for grasping the economic disparities that shape our world.
The Genesis and Mechanics of the Gini Index
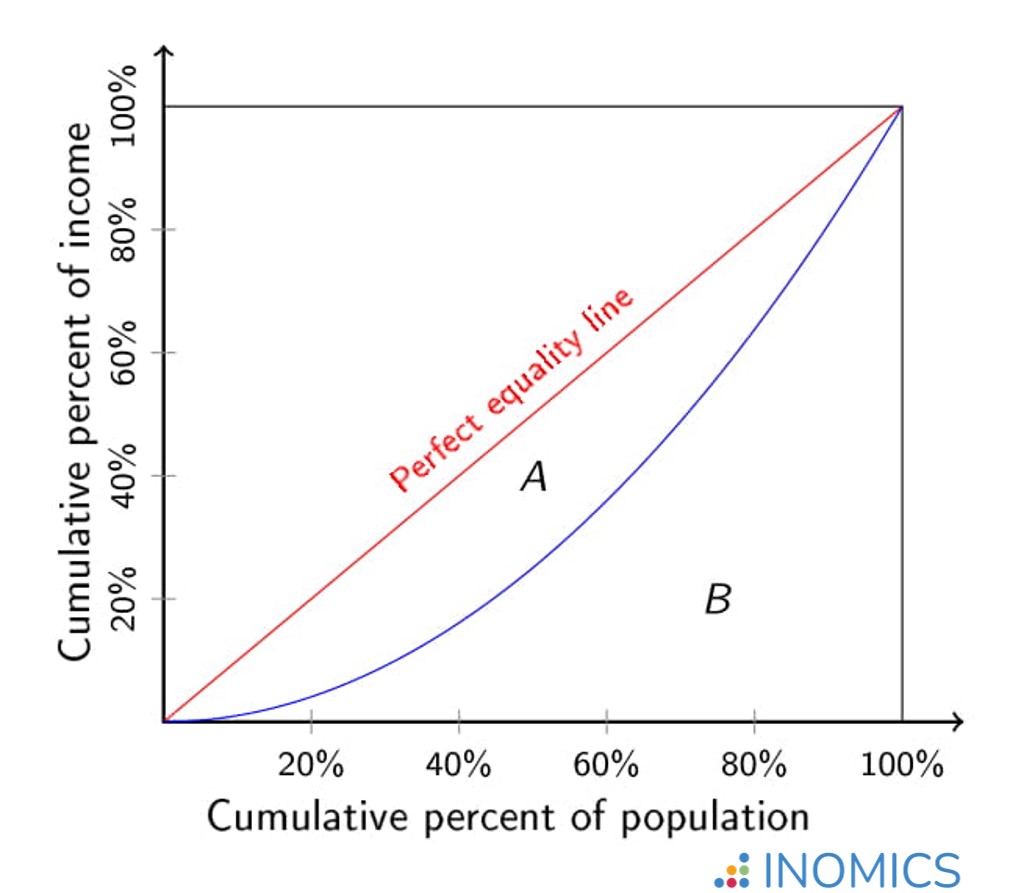
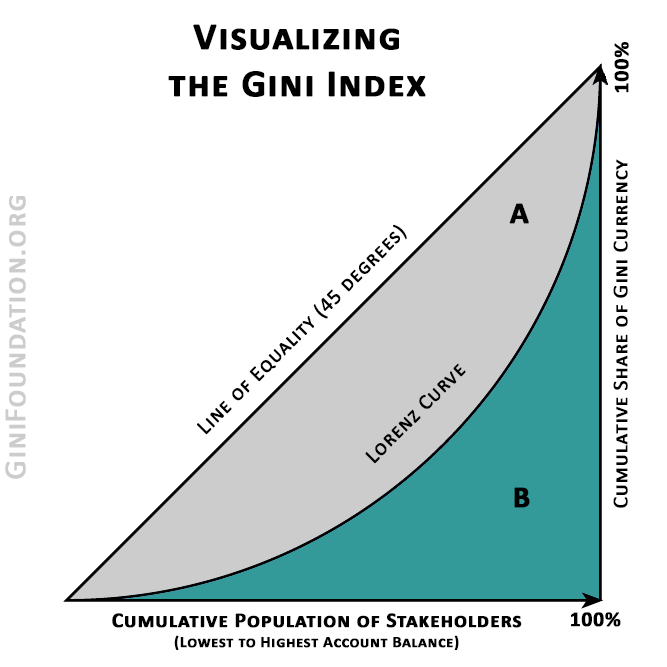
The Gini index, named after the Italian statistician Corrado Gini, who developed it in 1912, is derived from the Lorenz curve. This curve graphically illustrates the cumulative proportion of total income received by the cumulative proportion of the population.
The Lorenz Curve: Visualizing Inequality
The Lorenz curve plots the cumulative percentage of income (on the y-axis) against the cumulative percentage of the population, ordered from poorest to richest (on the x-axis).
Perfect Equality Line
A hypothetical line of perfect equality would be a straight diagonal line from the origin (0,0) to the top-right corner (100,100). This line signifies that the bottom 10% of the population earns 10% of the total income, the bottom 50% earns 50%, and so on.
The Curve of Actual Distribution
In reality, no society exhibits perfect equality. The Lorenz curve for any given population will lie below the line of perfect equality, bowing outwards to represent the uneven distribution of income or wealth. The further the Lorenz curve deviates from the line of perfect equality, the greater the inequality.
Calculating the Gini Coefficient
The Gini index (often referred to as the Gini coefficient when expressed as a number between 0 and 1) is mathematically derived from the Lorenz curve. It is calculated as the ratio of the area between the line of perfect equality and the Lorenz curve to the total area under the line of perfect equality.
The Formulaic Representation
While the visual representation through the Lorenz curve is intuitive, the Gini index is typically calculated using statistical formulas. For discrete data (e.g., income quintiles), one common formula involves summing the absolute differences between all pairs of incomes, normalizing them, and then dividing by twice the mean income. For continuous data, more complex integration methods are used. The resulting coefficient is a single number that encapsulates the degree of inequality.
Interpretation of the Index Value
A Gini index of 0.25, for instance, indicates a relatively low level of income inequality, suggesting that income is distributed more evenly across the population. Conversely, a Gini index of 0.60 suggests a high degree of income inequality, where a significant portion of the income is concentrated among a smaller segment of the population.
Applications and Significance of the Gini Index
The Gini index is not merely an abstract statistical tool; it has profound practical applications across various domains, particularly in economics, public policy, and social science. It serves as a vital benchmark for understanding economic disparities and their consequences.
Economic Analysis and Policy Formulation
Governments and international organizations widely use the Gini index to gauge the economic well-being of their citizens and to inform the development of social and economic policies.
Measuring Income and Wealth Inequality
The most common application of the Gini index is to measure income inequality. It helps policymakers understand how income is distributed across different segments of the population. This can highlight issues such as poverty, the concentration of wealth, and the effectiveness of redistribution policies. Beyond income, the Gini index can also be applied to measure wealth inequality, which often shows even more pronounced disparities.
Evaluating the Impact of Policies
By tracking the Gini index over time, policymakers can assess the impact of various economic interventions, such as progressive taxation, social welfare programs, minimum wage laws, and educational reforms. A decrease in the Gini index might suggest that policies are effectively reducing inequality, while an increase could signal growing disparities.
International Comparisons
The Gini index allows for standardized comparisons of inequality levels across different countries. This is invaluable for understanding global economic trends and for identifying best practices in addressing inequality. For example, comparing the Gini indices of developed nations can reveal different approaches to social safety nets and wealth distribution.
Social and Political Implications
Economic inequality, as measured by the Gini index, has significant social and political ramifications that extend beyond mere financial metrics.
Social Mobility and Opportunity

High levels of inequality, indicated by a high Gini index, can often be associated with reduced social mobility. This means that individuals born into lower socioeconomic strata may find it more difficult to improve their economic standing, limiting opportunities and perpetuating cycles of poverty.
Social Cohesion and Stability
Studies have suggested a correlation between high Gini indices and increased social unrest, crime rates, and political instability. When a significant portion of the population feels economically marginalized, it can erode social cohesion and lead to discontent.
Health Outcomes and Well-being
Research has also linked income inequality to disparities in health outcomes. Societies with higher Gini indices often exhibit poorer overall public health, with lower life expectancies and higher rates of chronic diseases, particularly among disadvantaged groups.
Limitations and Criticisms of the Gini Index
Despite its widespread use and utility, the Gini index is not without its limitations and has faced several criticisms over the years. Understanding these drawbacks is crucial for a comprehensive interpretation of the index.
Data Accuracy and Availability
The accuracy of the Gini index is heavily dependent on the quality and comprehensiveness of the underlying data. In many countries, reliable and detailed income and wealth data can be scarce, particularly for informal economies or for the very wealthy, leading to potential inaccuracies in the calculated index.
Challenges in Data Collection
Collecting accurate income and wealth data is a complex undertaking. Surveys may suffer from sampling biases, underreporting of income (especially for tax evasion or informal earnings), and difficulties in capturing the full extent of wealth, which often includes assets beyond immediate income.
Defining Income and Wealth
There are different ways to define “income” and “wealth,” and the choice of definition can significantly impact the Gini index. For instance, whether to consider pre-tax or post-tax income, or whether to include capital gains and imputed rent, can lead to varying results.
Oversimplification of Complex Realities
A single numerical value for the Gini index, while convenient, can oversimplify the complex nature of inequality. It does not reveal how inequality is distributed or the specific factors driving it.
Different Sources of Inequality
Two countries might have the same Gini index, but the underlying causes of their inequality could be vastly different. One might have a large gap between the highest and lowest earners, while another might have a more compressed distribution with a substantial middle class but still significant disparity. The Gini index alone cannot differentiate these scenarios.
Capturing Different Dimensions of Inequality
The Gini index primarily focuses on income or wealth. However, inequality can manifest in other dimensions, such as access to education, healthcare, political power, and social opportunities. The Gini index does not directly measure these other crucial aspects of societal stratification.
Methodological Variations
Different methodologies and data sources can lead to variations in the Gini index even when applied to the same population. This can make direct comparisons challenging if the methodologies are not clearly stated and understood.
Cross-Country Comparability Issues
While the Gini index is intended for international comparison, variations in data collection standards, survey methodologies, and the definition of income or wealth can hinder direct comparability between countries. International organizations often attempt to standardize these factors, but complete uniformity is difficult to achieve.
Conclusion: A Vital Tool for Understanding Economic Disparity
The Gini index, despite its limitations, remains an indispensable tool for comprehending and quantifying economic inequality. Its ability to provide a single, comparable metric for income and wealth distribution has made it a cornerstone of economic analysis and policy debate worldwide. By understanding the mechanics behind the Lorenz curve and the calculation of the Gini coefficient, we gain a clearer picture of the economic landscapes in which we live.
The Indispensable Role in Policy and Social Awareness
The Gini index serves as a critical indicator for policymakers seeking to address issues of poverty, social stratification, and economic fairness. It prompts discussions about the effectiveness of fiscal policies, social safety nets, and investments in education and healthcare. Furthermore, it raises public awareness about the extent of economic disparities, fostering dialogue and potentially driving demand for more equitable societal structures.
Continuous Improvement and Nuanced Interpretation
While the Gini index provides a valuable snapshot, its interpretation must be nuanced. Awareness of its limitations, particularly regarding data quality and the multifaceted nature of inequality, is essential. As data collection methods improve and our understanding of economic systems deepens, the Gini index will continue to evolve and be used in conjunction with other metrics to paint a more comprehensive picture of societal well-being. Ultimately, the Gini index is a powerful reminder of the persistent challenge of achieving a more equitable distribution of resources and opportunities in our global society.
aViewFromTheCave is a participant in the Amazon Services LLC Associates Program, an affiliate advertising program designed to provide a means for sites to earn advertising fees by advertising and linking to Amazon.com. Amazon, the Amazon logo, AmazonSupply, and the AmazonSupply logo are trademarks of Amazon.com, Inc. or its affiliates. As an Amazon Associate we earn affiliate commissions from qualifying purchases.