A physical map is a fundamental cartographic tool that offers a visual representation of the Earth’s surface, focusing primarily on its natural features. Unlike political maps that delineate boundaries between countries, states, or cities, physical maps aim to illustrate the tangible, geographical characteristics of a region. They are invaluable for understanding the landscape, terrain, and the processes that shape our planet. From the towering peaks of mountain ranges to the vast expanse of oceans, physical maps provide a window into the Earth’s geology and its diverse environments.
Understanding the Elevation and Terrain
The core function of a physical map is to depict the variations in elevation and the resulting terrain. This is achieved through various cartographic techniques, most notably contour lines and color shading. By understanding these elements, one can gain a profound appreciation for the topographical makeup of a region.
Contour Lines: The Language of Elevation
Contour lines are the most precise method for representing elevation on a physical map. These are lines that connect points of equal elevation above a given datum, usually sea level.
The Anatomy of Contour Lines
Each contour line represents a specific altitude. The interval between contour lines, known as the contour interval, is usually stated in the map’s legend and indicates the difference in elevation between adjacent lines. For example, a map with a 20-meter contour interval will show lines at 0m, 20m, 40m, 60m, and so on.
Interpreting Terrain Features
The way contour lines are drawn provides crucial information about the terrain:
- Closely spaced contour lines: Indicate a steep slope or cliff. The steeper the incline, the closer the lines will be.
- Widely spaced contour lines: Suggest a gentle slope or relatively flat land.
- Closed contour lines: Represent hills or depressions. If the inner loops of closed contours are progressively lower, it signifies a depression or sinkhole. If they are progressively higher, it indicates a hill or mountain.
- Concentric circles: Often denote a peak or summit.
- V-shaped contour lines: Pointing uphill indicate a valley or stream, as water flows downhill. Conversely, V-shaped lines pointing downhill suggest a ridge.
- Hachure marks: Short lines drawn perpendicular to contour lines, pointing downhill, are used to denote a steep descent or cliff face.
Limitations of Contour Lines
While precise, contour lines can be complex to read for those unfamiliar with them. They require careful interpretation and can sometimes lead to misinterpretations if the contour interval is not understood or if the map is not detailed enough. For broader overviews or to quickly grasp general relief, other methods are often employed.
Color Shading and Hypsometric Tinting: A Visual Gradient
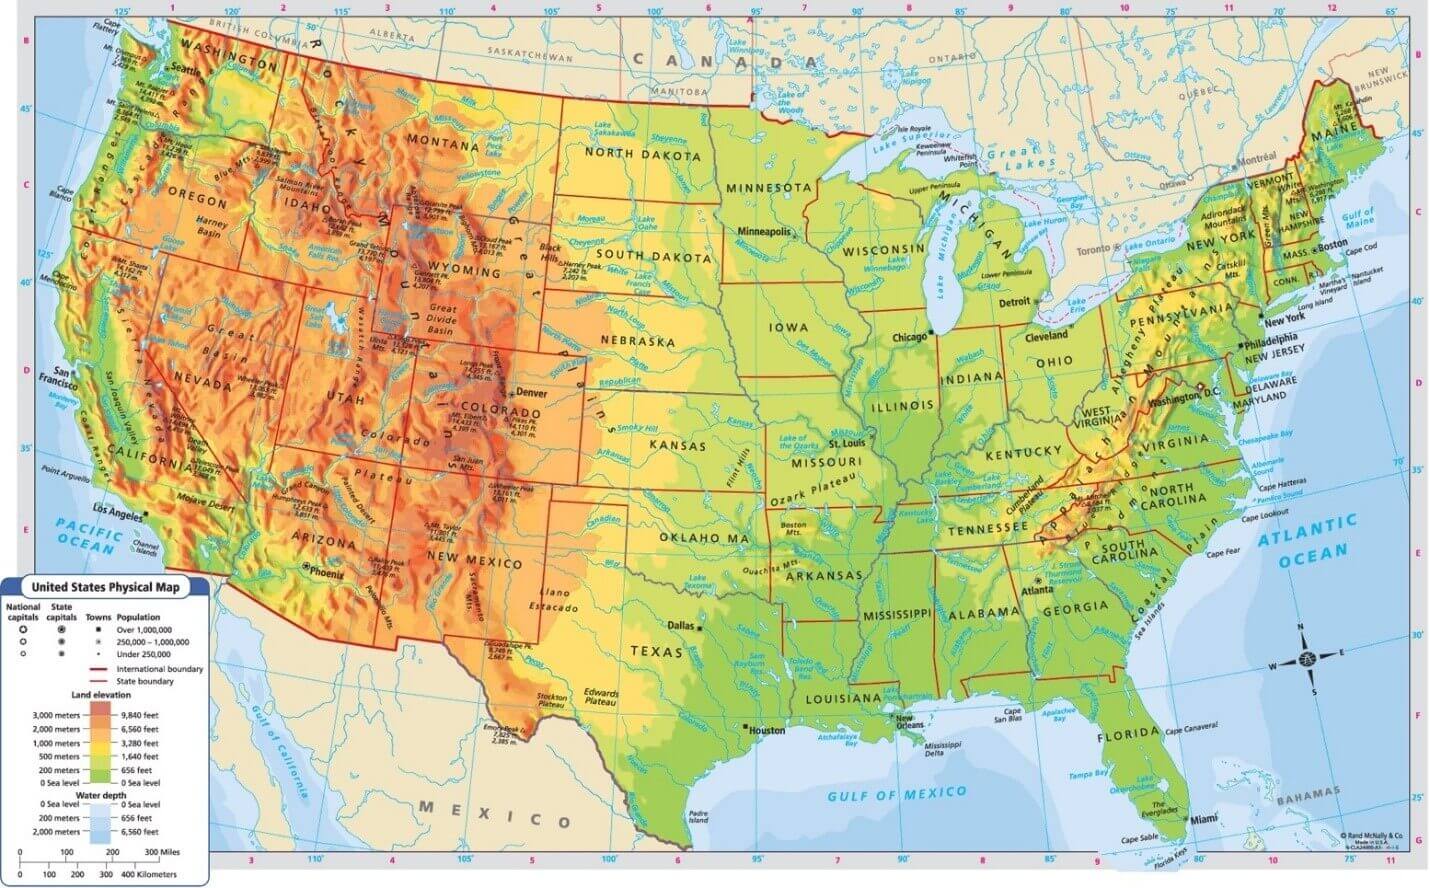
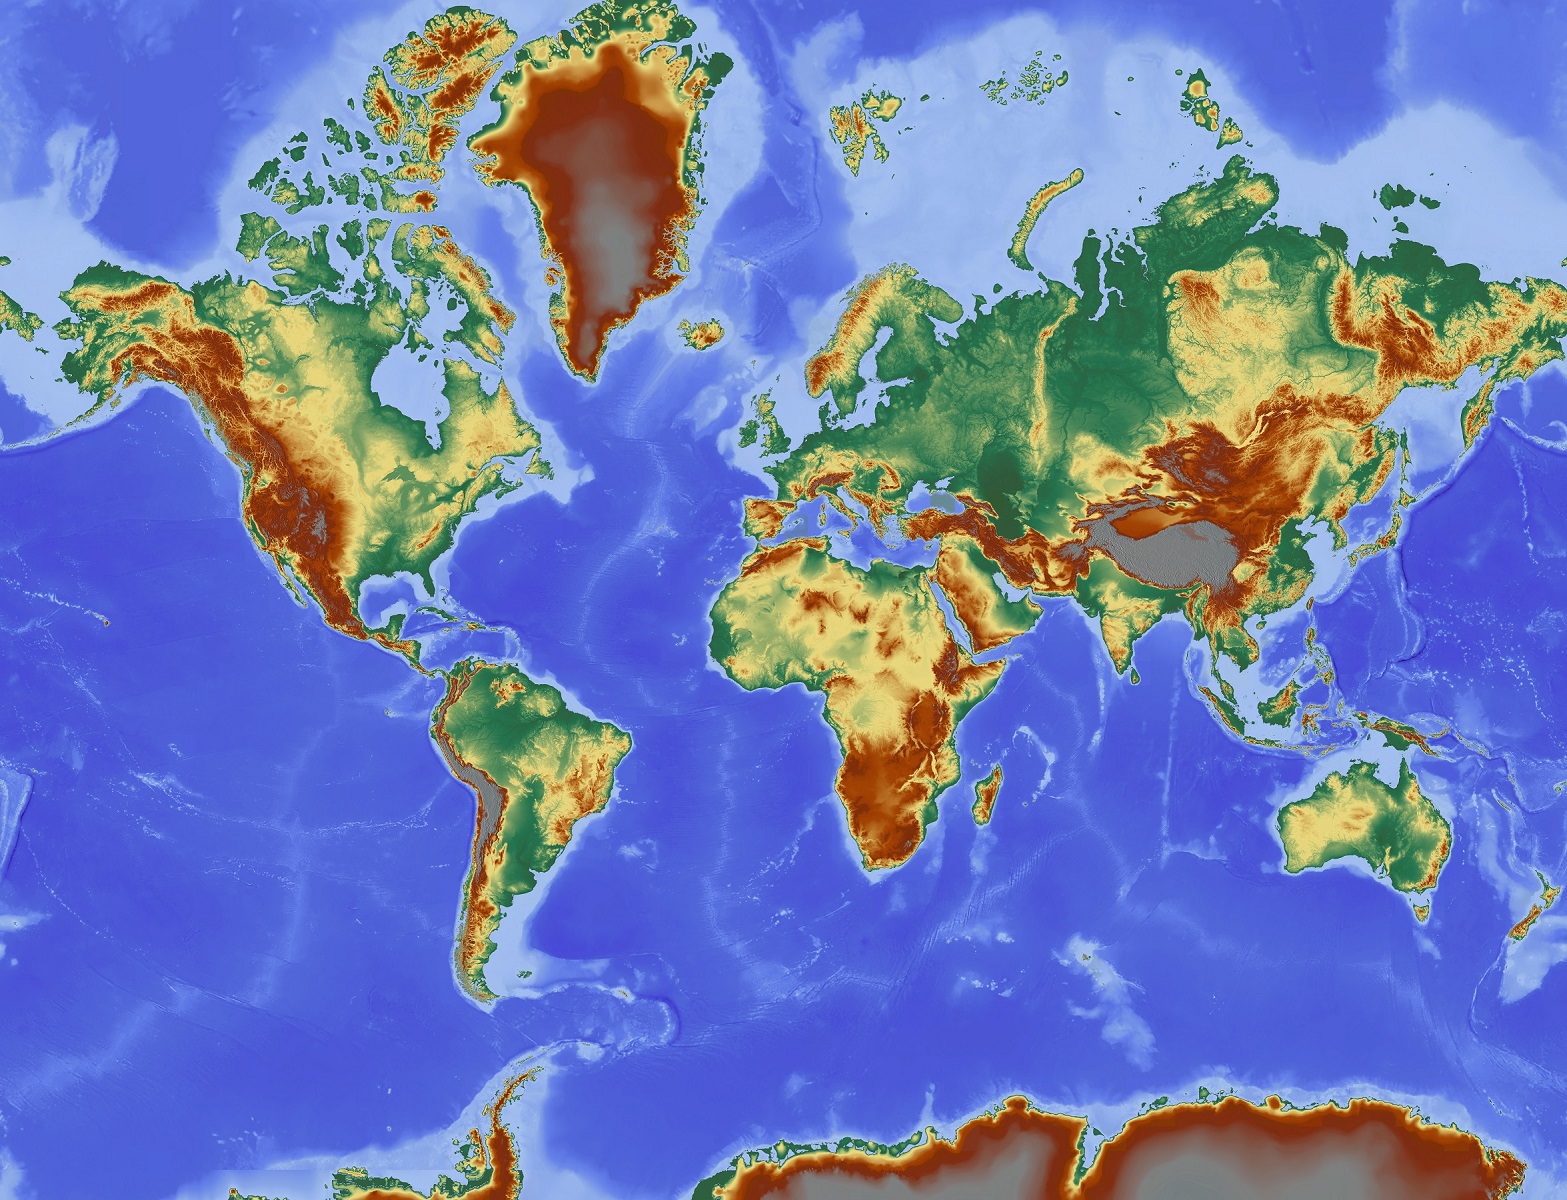
Color shading, also known as hypsometric tinting, is another popular and intuitive method used on physical maps to represent elevation. This technique uses a gradient of colors to depict different elevation ranges.
The Color Spectrum of Elevation
Typically, lower elevations are represented by greens, transitioning through yellows and oranges to browns and purples for higher altitudes. Water bodies are usually depicted in blue, with deeper blues often indicating deeper water.
- Greens: Commonly used for low-lying areas, plains, and valleys, often near sea level.
- Yellows and Oranges: Indicate intermediate elevations, foothills, and rolling hills.
- Browns and Reds: Represent higher elevations, mountains, and plateaus.
- Purples and Whites: Often used for the highest mountain peaks, signifying snow-capped areas or extreme altitudes.
Advantages of Color Shading
Hypsometric tinting provides an immediate and easily understandable visual impression of a region’s relief. It allows for quick identification of major mountain ranges, valleys, and plains without the need for detailed line interpretation. This makes physical maps with color shading particularly useful for general orientation and educational purposes.
Combining Techniques for Enhanced Understanding
Many physical maps effectively combine both contour lines and color shading. This dual approach offers the best of both worlds: the precise detail of contour lines for accurate elevation readings and the intuitive overview provided by color gradients. This combination allows users to gain both a broad understanding of the terrain and specific details about its topography.
Depicting Water Bodies and Drainage Systems
Water is a defining feature of our planet’s surface, and physical maps meticulously illustrate its presence and flow. From vast oceans and seas to intricate river systems, these maps provide a clear picture of the hydrosphere.
Oceans, Seas, and Lakes: The Blue Expanse
The depiction of large bodies of water is a straightforward yet crucial aspect of physical mapping.
Representation of Water
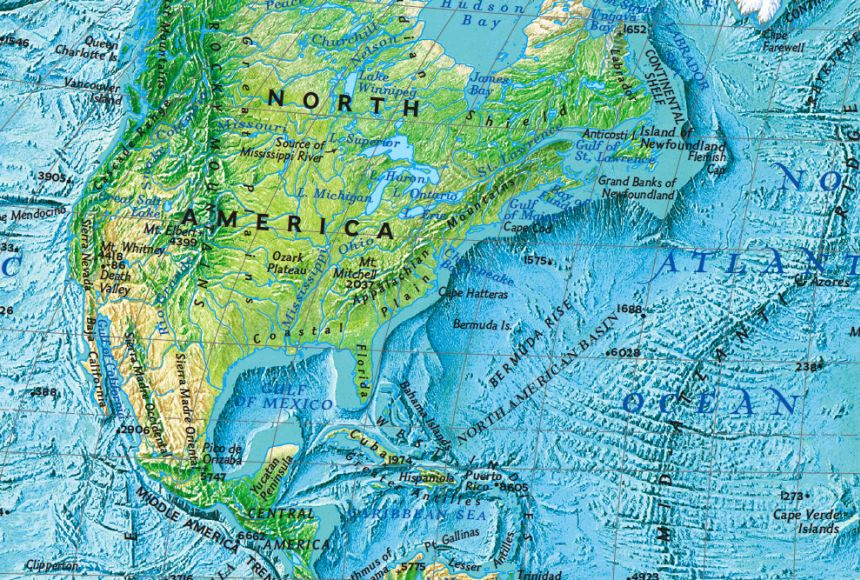
Oceans, seas, and large lakes are typically rendered in shades of blue. As mentioned, darker shades often denote greater depth, providing an indication of the bathymetry (underwater topography). Coastlines are clearly delineated, marking the transition between land and water.
Identifying Water Features
The scale of the map will determine the level of detail. Larger scale maps might show smaller lakes, ponds, and reservoirs, while smaller scale maps might only feature the most significant water bodies. Islands and archipelagos are also clearly identified within these bodies of water.
Rivers, Streams, and Drainage Basins: The Veins of the Land
The intricate network of rivers and streams that carve through landscapes is a key feature shown on physical maps, revealing how water moves across the land.
Illustrating Watercourses
Rivers and streams are depicted as blue lines, with the width of the line often indicating the size or significance of the watercourse. Major rivers are usually shown with thicker lines than smaller tributaries.
Understanding Drainage Patterns
The pattern in which rivers flow can reveal a great deal about the underlying geology and topography. Physical maps help visualize these drainage patterns:
- Dendritic patterns: Resembling tree branches, these occur on relatively uniform terrain or where the underlying rock has similar resistance to erosion.
- Parallel patterns: Found on slopes, where rivers flow parallel to each other down the steepest gradient.
- Rectangular patterns: Characterized by long parallel streams with shorter ones joining them at right angles, indicating alignment with joints or faults in the bedrock.
- Radial patterns: Rivers flowing outwards from a central elevated point, such as a volcano or dome.
- Annular patterns: Rivers flowing in a circular or oval pattern, often around a resistant dome or basin.
Rivers and Their Impact on Landscape
The presence and flow of rivers are fundamental in shaping the land through erosion and deposition. Physical maps show features like:
- Valleys: Often carved by rivers, these are depicted by the contour lines or by the presence of the river itself.
- Floodplains: Flat areas adjacent to rivers that are prone to flooding, often represented by lower elevations and distinct landforms.
- Deltas: Depositional landforms at the mouth of a river where it meets a larger body of water, characterized by branching distributaries.
Showcasing Other Natural Features
Beyond elevation and water, physical maps provide valuable insights into a multitude of other natural phenomena that shape our planet. These features contribute to the ecological diversity and geological character of a region.
Vegetation and Land Cover
While not always the primary focus, many physical maps will include indications of vegetation types and land cover. This helps to understand the environmental context of the terrain.
Types of Vegetation
Common representations include:
- Forests: Often shown with green shading or symbols representing trees. Different shades of green might differentiate between deciduous and coniferous forests.
- Grasslands and Savannahs: Depicted with lighter greens or yellows, indicating open, grassy areas.
- Deserts: Represented by sandy colors (light browns, yellows) or barren symbols.
- Tundra: Areas with low-lying vegetation, often shown in muted greens and browns.
Land Cover Classifications
More detailed maps might use a broader range of colors or patterns to indicate different land cover classifications, such as agricultural land, urban areas (though this leans towards political mapping, it can be presented as a human-modified natural landscape), and wetlands.
Geological Formations and Landforms
Physical maps can also highlight significant geological formations and distinct landforms that are a result of geological processes.
Mountain Ranges and Peaks
Major mountain ranges are prominently displayed, often through the combination of contour lines and color shading. Individual peaks might be marked with specific symbols.
Plateaus and Mesas
Elevated, flat-topped areas of land, known as plateaus and mesas, are indicated by distinct topographical contours and often a change in elevation color.
Volcanoes and Craters
Active or extinct volcanoes are frequently depicted with characteristic cone shapes and summit craters.
Glaciers and Ice Caps
In polar regions or high altitudes, glaciers and ice caps are shown, often in white or light blue, to illustrate areas of permanent ice cover.
Soil Types and Climatic Zones (Implied)
While not always directly shown with explicit labels, the features on a physical map can often imply information about soil types and climatic zones. For example:
- The presence of dense forests on a physical map suggests fertile soil and adequate rainfall, indicative of a temperate or tropical climate.
- Large desert areas imply arid conditions and specific soil types adapted to low moisture.
- The distribution of glaciers points to very cold climates.
By understanding the interplay of elevation, water, and vegetation, a physical map becomes a powerful tool for comprehending the environmental conditions and geographical characteristics of any given area.
The Utility and Applications of Physical Maps
The information conveyed by physical maps extends far beyond mere geographical representation. Their inherent ability to illustrate the natural world makes them indispensable tools across a wide range of disciplines and for numerous practical applications.
Education and Scientific Research
Physical maps are foundational in educational settings and crucial for scientific endeavors.
Geographical Literacy
For students, physical maps are instrumental in developing geographical literacy. They provide a tangible way to learn about topography, landforms, and the distribution of natural features. Understanding how elevation influences climate, where rivers originate, and how mountains impact weather patterns are core concepts facilitated by these maps.
Environmental Studies
Researchers in fields like geology, geography, ecology, and environmental science rely heavily on physical maps. They are used to:
- Analyze landforms: Identifying geological structures, erosion patterns, and the impact of tectonic activity.
- Study hydrology: Mapping river systems, watersheds, and potential flood zones.
- Assess habitats: Understanding the relationship between terrain, vegetation, and animal distribution.
- Plan conservation efforts: Identifying areas with unique ecosystems or vulnerable landscapes.
- Model climate impacts: Visualizing how elevation and proximity to water bodies affect local climates.
Outdoor Recreation and Navigation
For anyone venturing into the natural world, physical maps are essential companions.
Hiking and Trekking
Hikers, mountaineers, and backpackers use physical maps to plan routes, assess trail difficulty, and navigate unfamiliar terrain. Understanding the steepness of ascents, the location of water sources, and the presence of challenging topographical features is critical for safety and route selection.
Exploration and Adventure
Explorers and adventurers utilize physical maps to plan expeditions into remote or uncharted areas. They help in identifying potential campsites, assessing the feasibility of traversing different landscapes, and anticipating natural hazards.
Survival Situations
In emergency situations where technological navigation tools might fail, a well-understood physical map can be a lifesaver, providing vital information about the surrounding environment for survival and self-rescue.
Urban Planning and Resource Management
Even in the context of human development, physical maps offer crucial insights into the natural landscape.
Infrastructure Development
Urban planners and engineers use physical maps to understand the terrain when planning the placement of roads, buildings, and other infrastructure. Avoiding areas prone to landslides, managing water runoff, and understanding the implications of soil stability are all informed by topographical data.
Natural Resource Assessment
Physical maps aid in the identification and management of natural resources.
- Water resources: Mapping rivers, lakes, and groundwater potential.
- Mineral exploration: Understanding geological formations that may harbor mineral deposits.
- Agricultural suitability: Assessing the terrain and elevation for different types of farming.
- Forestry management: Identifying areas for timber harvesting or conservation based on topographical features and vegetation.
In conclusion, a physical map is a rich repository of information about the Earth’s natural environment. By visually representing elevation, water bodies, vegetation, and geological formations, it provides a fundamental understanding of our planet’s landscape, making it an indispensable tool for education, research, recreation, and planning.
aViewFromTheCave is a participant in the Amazon Services LLC Associates Program, an affiliate advertising program designed to provide a means for sites to earn advertising fees by advertising and linking to Amazon.com. Amazon, the Amazon logo, AmazonSupply, and the AmazonSupply logo are trademarks of Amazon.com, Inc. or its affiliates. As an Amazon Associate we earn affiliate commissions from qualifying purchases.