
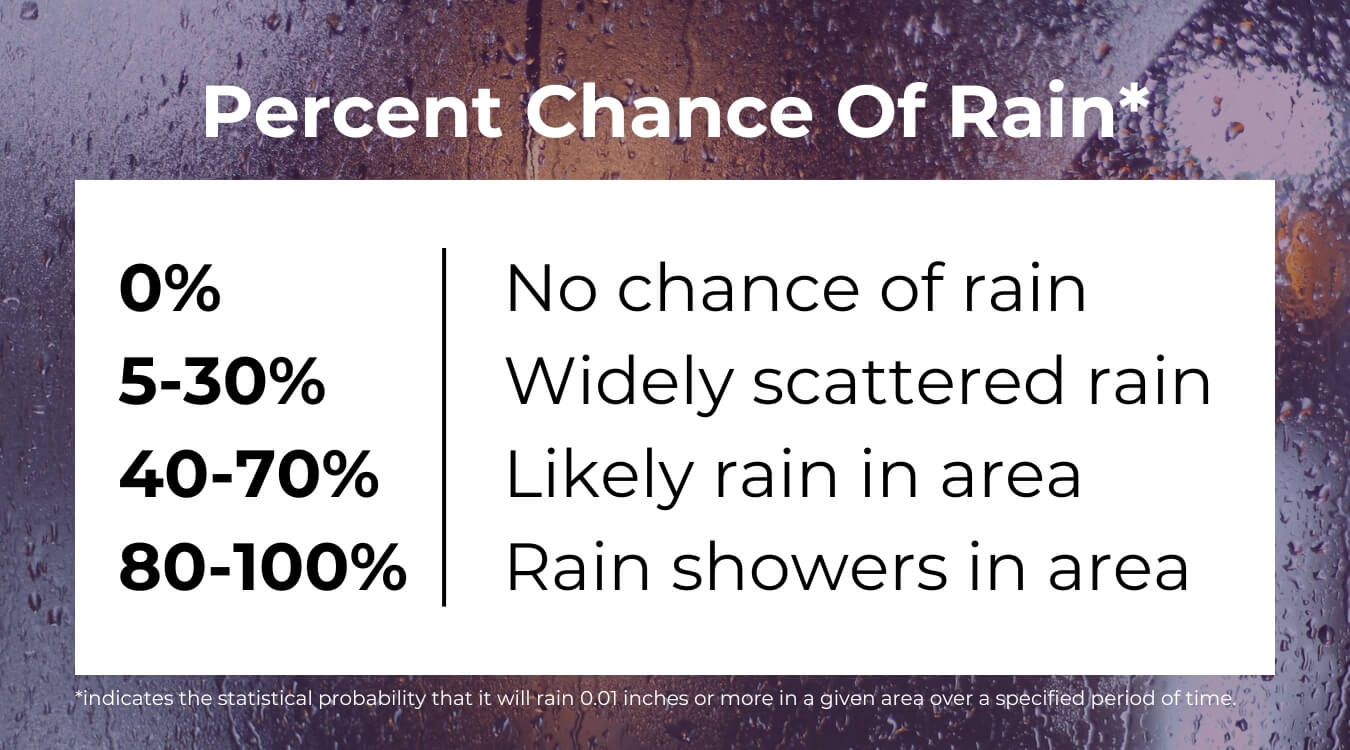
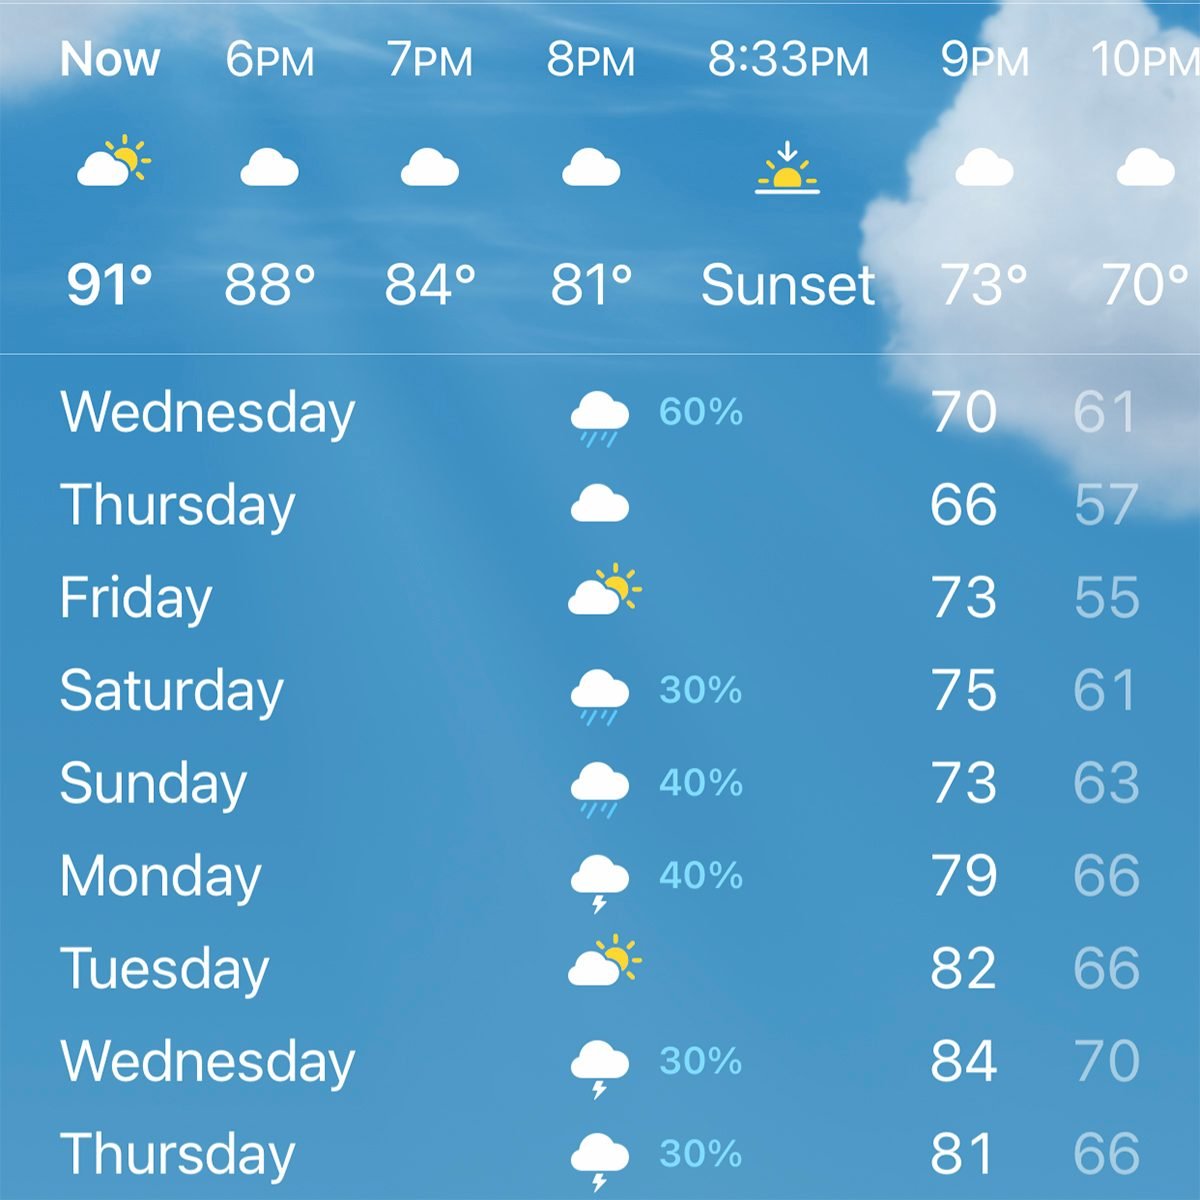
Weather forecasts are filled with numbers, and perhaps one of the most common and often perplexing is the percentage. Whether it’s a 60% chance of rain or a 90% chance of sunshine, these figures are crucial for understanding potential weather conditions. But what do they truly represent? In the realm of technology and the sophisticated systems that power our weather predictions, percentages are far more than simple guesses; they are the language of probability, derived from complex data analysis and advanced modeling. Understanding these percentages requires a dive into the technological underpinnings of meteorology, exploring how data is collected, processed, and ultimately translated into actionable forecasts.
The Technological Foundation of Weather Forecasting
At its core, modern weather forecasting is a testament to technological advancement. It relies on a vast, interconnected global network of sensors, satellites, and sophisticated computational models. The “percentage” you see is not an arbitrary number but a calculated output from this intricate technological ecosystem.
Data Acquisition: The Eyes and Ears of the Atmosphere
The journey of a weather forecast begins with data. A multitude of sources contribute to building a comprehensive picture of the atmosphere at any given moment.
Ground-Based Observations
Thousands of weather stations strategically placed across landmasses collect real-time data on temperature, humidity, wind speed and direction, atmospheric pressure, and precipitation. These automated systems, often equipped with advanced sensors, transmit data instantaneously, providing a granular view of local conditions. Beyond fixed stations, mobile observations from aircraft, ships, and even specialized weather balloons continuously feed this data stream. The sheer volume and density of this ground-level data are critical for validating and refining larger-scale model outputs.
Satellite Imagery and Remote Sensing
Satellites orbit the Earth, offering a global perspective on weather patterns. Advanced sensors on these satellites can measure cloud cover, temperature profiles of the atmosphere, water vapor content, and even the movement of storms. Technologies like Doppler radar, also a form of remote sensing, detect precipitation, its intensity, and its movement, providing crucial information for short-term forecasting and severe weather warnings. These remote sensing tools are indispensable for monitoring vast oceanic areas and remote regions where ground-based observations are scarce.
Upper-Air Soundings
Weather balloons are launched twice daily from hundreds of locations worldwide. These balloons carry radiosondes, instruments that measure temperature, humidity, pressure, and wind speed at various altitudes as they ascend through the atmosphere. This upper-air data is vital for understanding atmospheric stability, the development of storms, and the trajectory of weather systems. The data gathered from these soundings is a critical input for numerical weather prediction models.
The Role of Supercomputers in Numerical Weather Prediction (NWP)
Once the data is collected, it needs to be processed and analyzed. This is where the technological might of supercomputers comes into play. Numerical Weather Prediction (NWP) models are complex mathematical representations of the Earth’s atmosphere and oceans.
How NWP Models Work
These models divide the atmosphere into a three-dimensional grid. At each grid point, they use sophisticated physics and fluid dynamics equations to simulate how atmospheric variables like temperature, pressure, and wind will change over time. NWP models are constantly fed with the vast amounts of observational data collected from ground stations, satellites, and balloons. This data is used to initialize the model, essentially telling it what the current state of the atmosphere is.
The Iterative Process of Prediction
The models then run simulations forward in time, calculating the future state of the atmosphere at regular intervals. This process is repeated multiple times, each run representing a slightly different initial condition based on the inherent uncertainties in the observational data. This ensemble forecasting approach is where the concept of “percentage” truly takes shape, as we will explore further. The computational power required for these models is immense, necessitating the use of some of the world’s most powerful supercomputers. These machines can perform trillions of calculations per second, allowing for complex simulations that were unimaginable just a few decades ago.
Decoding the Probability: Percentage as a Forecast Output
The “percentage” you encounter in weather forecasts is a direct output of the probabilistic nature of NWP. It represents the likelihood of a specific weather event occurring, not a certainty. This distinction is critical for accurate interpretation and effective decision-making.
Ensemble Forecasting: Embracing Uncertainty
Because initial atmospheric conditions can never be known with absolute precision, and because the NWP models themselves are simplifications of reality, meteorologists use ensemble forecasting to quantify uncertainty.
The Power of Multiple Model Runs
Instead of running a single NWP model, meteorologists run an ensemble of multiple model simulations. Each simulation in the ensemble starts with slightly perturbed initial conditions, representing the range of possible starting states for the atmosphere. These small variations can lead to different forecast outcomes over time.
From Multiple Outcomes to a Single Percentage
By examining the results of all the individual model runs within an ensemble, forecasters can determine how many of those runs predict a particular event. For example, if 60 out of 100 model runs predict rain in a specific location, the forecast for that location will state a “60% chance of rain.” This percentage, therefore, represents the proportion of the ensemble members that forecast precipitation. It’s a statistical measure derived from the collective output of numerous simulations.
Understanding the Nuances of “Chance of Rain”
The “chance of rain” is perhaps the most common weather percentage, but its interpretation can be a source of confusion. It’s important to understand that this percentage doesn’t necessarily mean that 60% of the forecast area will receive rain, nor does it mean that it will rain for 60% of the time.
Probability of Precipitation (PoP) Explained
The most widely accepted definition of the Probability of Precipitation (PoP) is:
PoP = C x A
Where:
- C is the confidence (or probability) that precipitation will occur at any given point in the forecast area.
- A is the percentage of the forecast area that is expected to receive measurable precipitation, if precipitation occurs.
For instance, a 60% chance of rain can mean:
- There is a 60% chance that rain will occur somewhere in the forecast area, and if it does, it will cover 100% of the area. (A = 100%, C = 60%)
- There is a 100% chance that rain will occur somewhere in the forecast area, but it will only cover 60% of the area. (A = 60%, C = 100%)
- There is an 80% chance that rain will occur in the area, and if it does, it will cover 75% of the area. (A = 75%, C = 80%, PoP = 0.75 * 0.80 = 0.60 or 60%)
This formula, a product of meteorological science and data science, highlights how the percentage is a sophisticated calculation designed to convey a complex probability. It’s a way to communicate the likelihood of an event happening without stating it as an absolute certainty, a reflection of the inherent variability of atmospheric processes.
Technological Innovations Enhancing Percentage Accuracy
The accuracy and utility of weather percentage forecasts are continuously improving, driven by ongoing technological advancements in computing, data assimilation, and artificial intelligence.
Machine Learning and AI in Weather Prediction
Artificial intelligence and machine learning are revolutionizing weather forecasting by offering new ways to analyze vast datasets and improve model performance.
Pattern Recognition and Predictive Analytics
AI algorithms can sift through historical weather data and current observations to identify complex patterns that might be missed by traditional methods. Machine learning models can be trained to recognize precursors to severe weather events, improving lead times for warnings. They can also learn to correct systematic biases in NWP models, leading to more accurate forecasts.
Improving Data Assimilation
Data assimilation is the process of integrating observational data into NWP models. AI can enhance this process by intelligently selecting and prioritizing data, optimizing how observations are used to update the model’s state. This leads to more accurate initial conditions, which are fundamental to the quality of any forecast. For example, AI can help distinguish between reliable sensor readings and potential errors, ensuring that flawed data doesn’t unduly influence the model.
Big Data and Cloud Computing
The sheer volume of weather data generated globally is staggering. Managing, processing, and analyzing this “big data” requires robust technological infrastructure.
Scalable Data Processing
Cloud computing platforms provide the scalable computational power and storage necessary to handle the enormous datasets involved in weather forecasting. This allows meteorologists to run more ensemble members, perform higher-resolution simulations, and experiment with new modeling techniques without being limited by on-premises hardware.
Real-Time Data Analysis and Dissemination
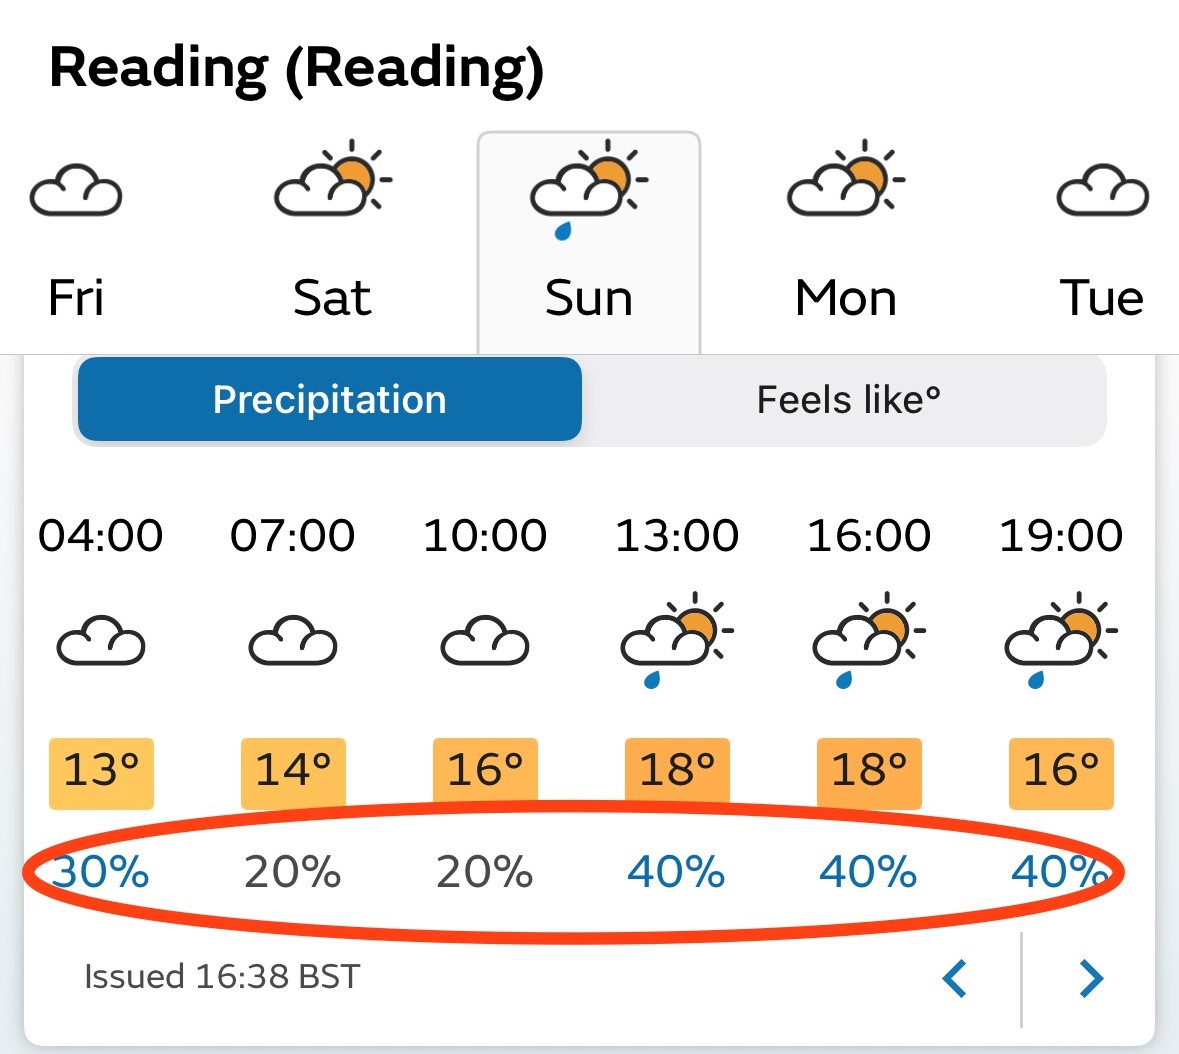
The ability to process and analyze data in near real-time is crucial for timely forecasts, especially during rapidly evolving weather events. Cloud-based solutions facilitate this, enabling faster dissemination of critical weather information to the public and various industries through apps, websites, and specialized meteorological services. These technologies ensure that the percentages we see are based on the most up-to-date atmospheric picture possible.
In conclusion, the “percentage” in weather forecasts is a sophisticated output of advanced technology. It’s a testament to the power of data collection, numerical modeling, ensemble forecasting, and increasingly, artificial intelligence. While a simple number, it represents a complex interplay of scientific understanding and technological capability, striving to provide us with the most accurate probabilistic view of our ever-changing atmosphere.
aViewFromTheCave is a participant in the Amazon Services LLC Associates Program, an affiliate advertising program designed to provide a means for sites to earn advertising fees by advertising and linking to Amazon.com. Amazon, the Amazon logo, AmazonSupply, and the AmazonSupply logo are trademarks of Amazon.com, Inc. or its affiliates. As an Amazon Associate we earn affiliate commissions from qualifying purchases.