
In our increasingly data-driven world, understanding fundamental statistical concepts isn’t just for mathematicians; it’s a crucial skill for anyone navigating the realms of technology, branding, and finance. While the terms “mean,” “median,” and “mode” might sound intimidating, they are simply different ways to describe the “average” or central tendency of a dataset. Similarly, “range” provides a sense of the spread or variability within that data. Mastering these concepts allows for better decision-making, more insightful analysis, and a clearer understanding of the information we encounter daily.
This article will demystify these essential statistical measures, exploring their individual meanings and practical applications across three core domains: Tech, Brand, and Money. By understanding how to interpret median, mode, and range, you can gain a significant advantage in comprehending market trends, evaluating product performance, crafting effective brand strategies, and making informed financial decisions.
Understanding the Core Concepts: Mean, Median, and Mode
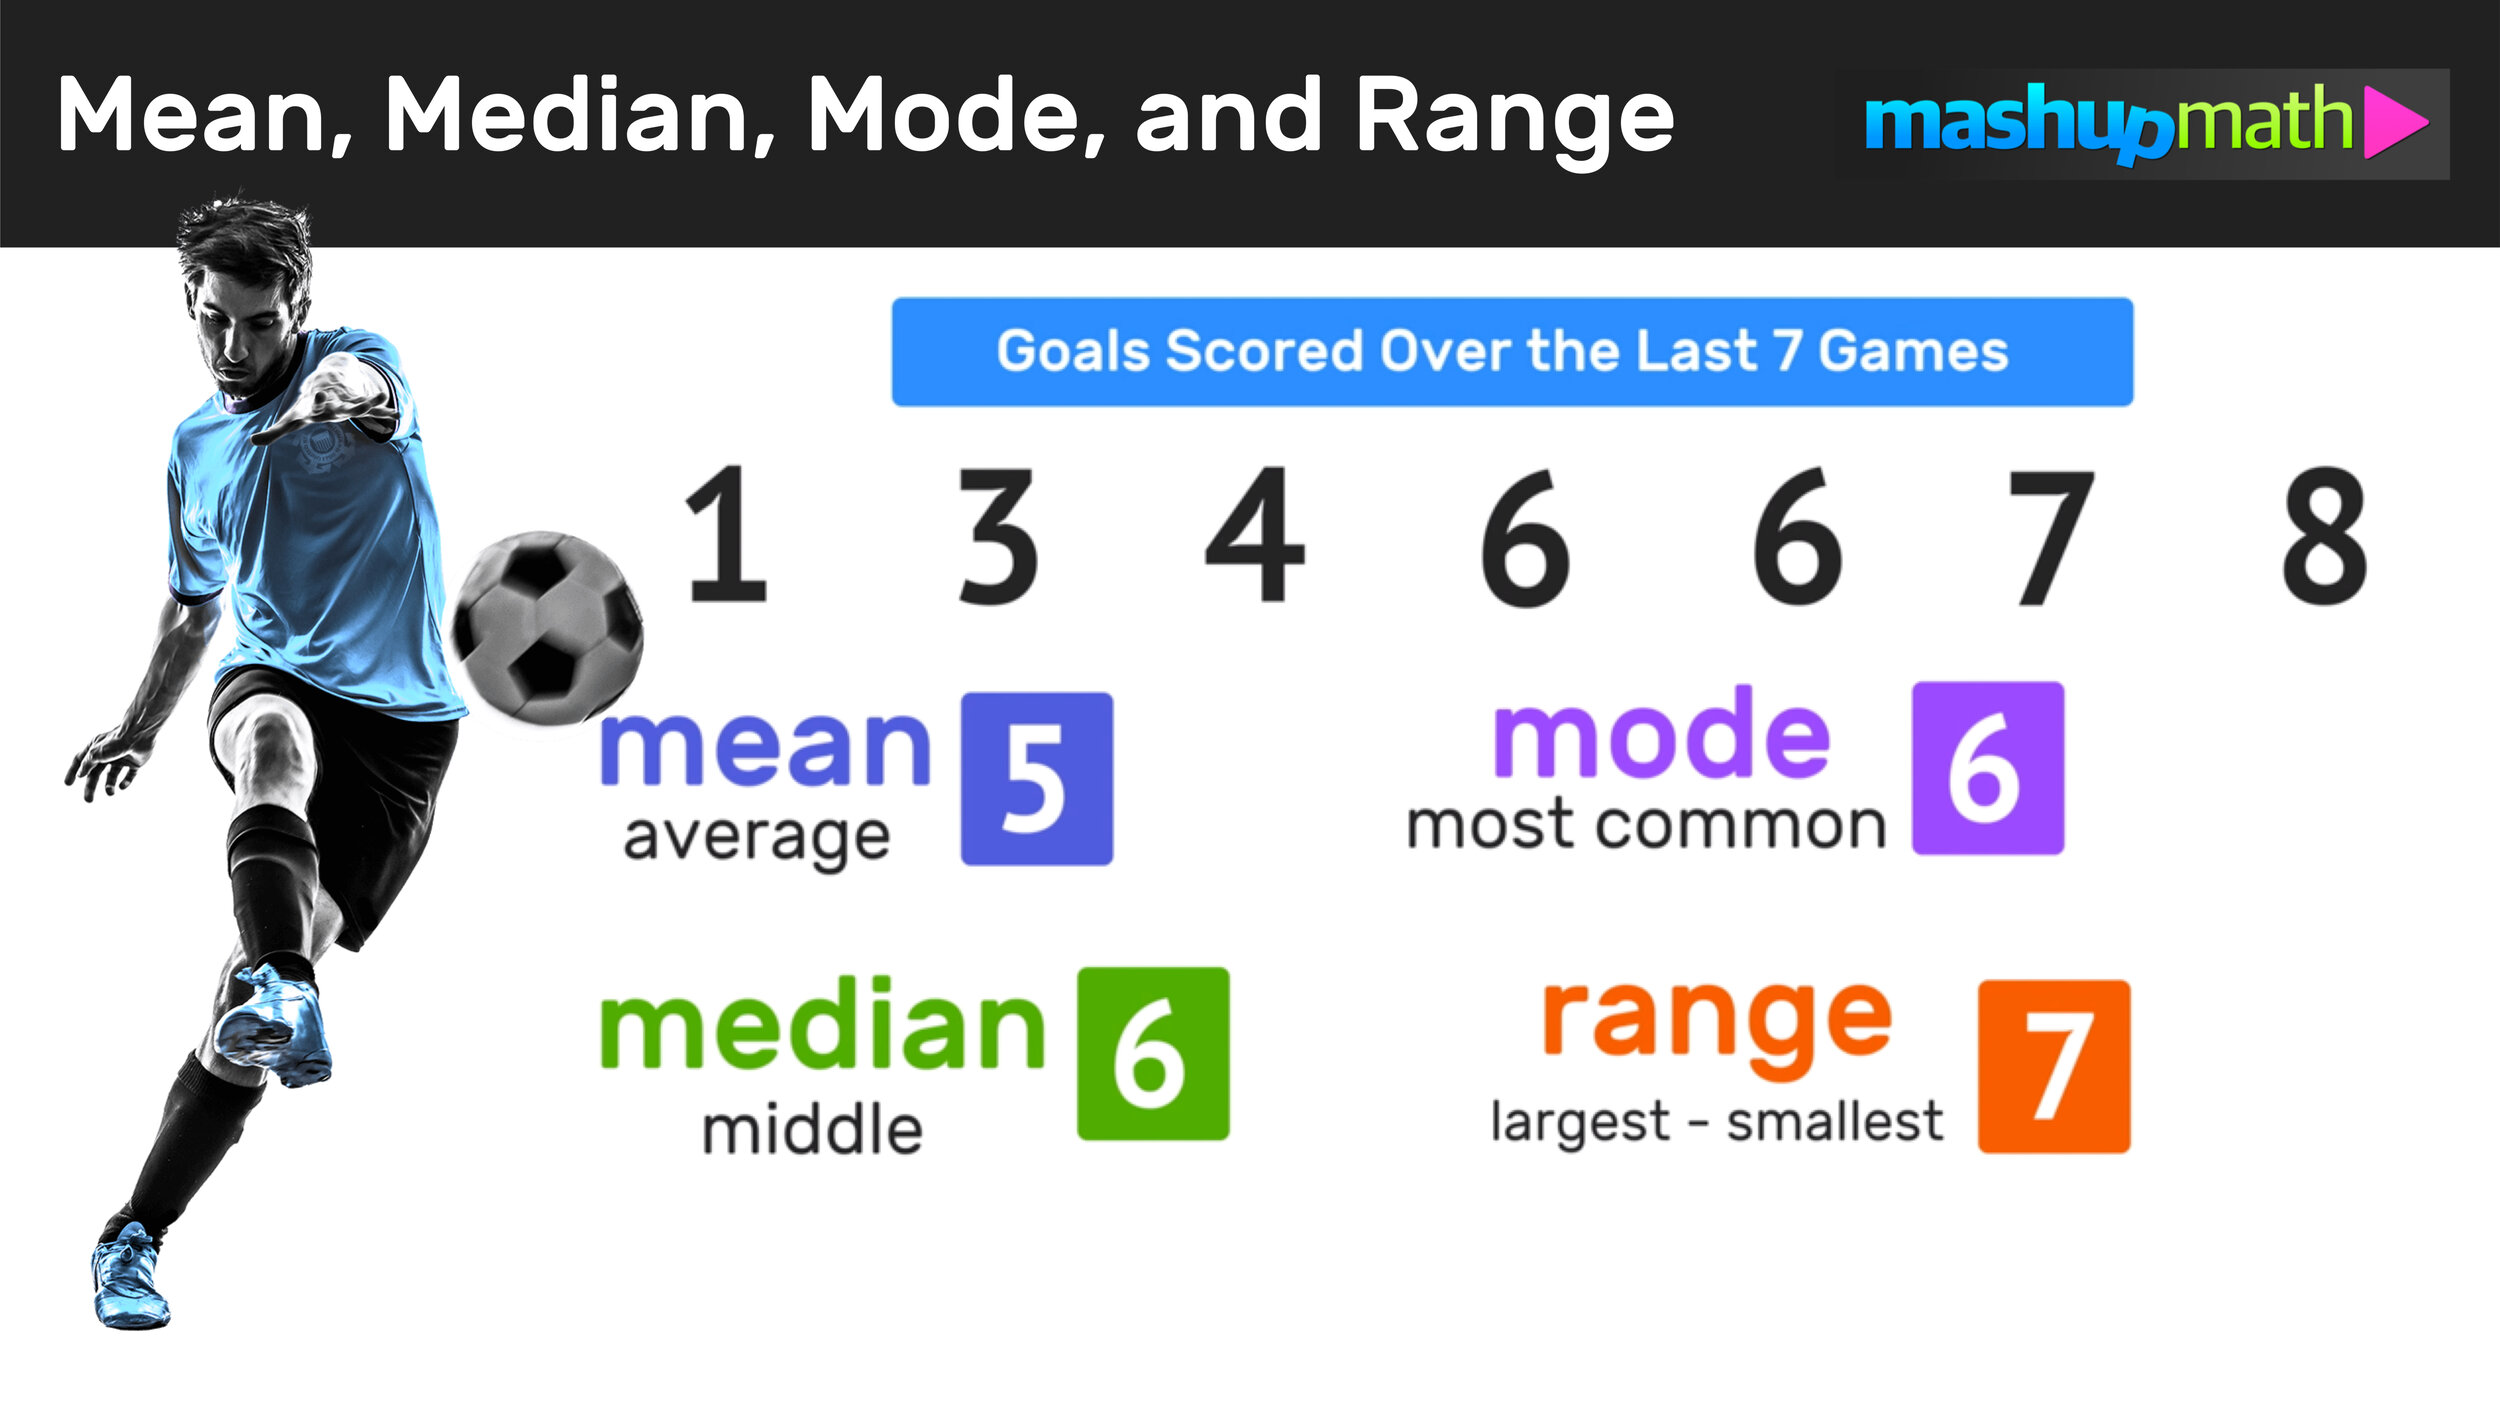
Before diving into specific applications, let’s establish a clear understanding of each term. Imagine you have a set of numbers – perhaps sales figures, website visitor counts, or customer satisfaction scores. These measures help us summarize that collection of numbers.
The Mean: The Everyday Average
The mean is what most people commonly refer to as the “average.” It’s calculated by adding up all the numbers in a dataset and then dividing by the total count of numbers.
Formula: Mean = (Sum of all values) / (Number of values)
Example: If you have the following data points: 5, 10, 15, 20, 25.
Sum = 5 + 10 + 15 + 20 + 25 = 75
Number of values = 5
Mean = 75 / 5 = 15
The mean is sensitive to outliers – extremely high or low values that can disproportionately skew the average. This is an important consideration when interpreting data.
The Median: The Middle Ground
The median represents the middle value in a dataset that has been ordered from least to greatest. If there’s an even number of data points, the median is the average of the two middle numbers.
How to find the median:
- Order the data: Arrange your numbers in ascending or descending order.
- Identify the middle:
- If there’s an odd number of data points, the median is the single middle number.
- If there’s an even number of data points, the median is the average of the two middle numbers.
Example (Odd number of values): Using the same data: 5, 10, 15, 20, 25.
The ordered data is already: 5, 10, 15, 20, 25.
The median is 15.
Example (Even number of values): If the data was: 5, 10, 15, 20, 25, 30.
The ordered data is: 5, 10, 15, 20, 25, 30.
The two middle numbers are 15 and 20.
Median = (15 + 20) / 2 = 17.5
The median is a more robust measure than the mean when dealing with datasets that contain outliers, as it is not affected by extreme values.
The Mode: The Most Frequent
The mode is the value that appears most frequently in a dataset. A dataset can have one mode (unimodal), more than one mode (multimodal), or no mode if all values appear with the same frequency.
Example:
- Data: 5, 10, 10, 15, 20, 25. The mode is 10.
- Data: 5, 10, 10, 15, 20, 20, 25. The modes are 10 and 20 (bimodal).
- Data: 5, 10, 15, 20, 25. There is no mode.
The mode is particularly useful for categorical data or when identifying common occurrences.
Understanding the Spread: The Range
While mean, median, and mode describe the center of a dataset, the range tells us about its spread or variability.
The Range: The Extremes
The range is the simplest measure of spread. It’s calculated by subtracting the lowest value from the highest value in a dataset.
Formula: Range = Highest Value – Lowest Value
Example: Using the data: 5, 10, 15, 20, 25.
Highest Value = 25
Lowest Value = 5
Range = 25 – 5 = 20
The range gives a quick indication of how far apart the data points are, but like the mean, it can be heavily influenced by outliers.
Practical Applications in Key Domains

Now, let’s see how these statistical measures come to life in the dynamic fields of Tech, Brand, and Money.
1. Tech: Decoding Performance and User Behavior
In the fast-paced world of technology, data is king. From app development to AI innovation, understanding the performance and reception of products and services relies heavily on statistical analysis.
1.1. Software and App Performance
- Mean: When monitoring server response times for an application, the mean response time gives an overall picture of performance. However, a few unusually slow responses can inflate this mean, making the system appear less reliable than it actually is for most users.
- Median: To get a more accurate representation of typical user experience, the median response time is often more valuable. It tells you the response time for the 50th percentile of users, unaffected by those few outliers. This is crucial for identifying genuine performance bottlenecks that affect the majority.
- Mode: In crash reports for a software application, the mode can reveal the most frequent error code or type of crash. Identifying this common issue allows developers to prioritize fixes and improve stability.
- Range: The range of download speeds for a new app can quickly highlight the extreme variations users might experience. A large range suggests inconsistent performance across different network conditions, prompting investigation into optimization strategies.
1.2. AI and Machine Learning Insights
- Mean: When training an AI model, the mean accuracy across multiple test datasets provides a general performance metric.
- Median: For complex models that might have occasional erratic predictions, the median accuracy can offer a more stable and reliable assessment of its true learning capability.
- Mode: In natural language processing, the mode of word frequencies can help identify the most common terms in a corpus, informing vocabulary selection for models or sentiment analysis.
- Range: The range of prediction confidence scores for an AI model can indicate how consistent its certainty is. A wide range might signal that the model is highly confident on some predictions but very uncertain on others, requiring further refinement.
1.3. Gadget Reviews and User Feedback
- Mean: Review aggregators often display the mean rating for a gadget. While useful, it can be skewed by a few extremely positive or negative reviews.
- Median: The median rating provides a better sense of the typical user’s satisfaction. If a gadget has a high mean but a low median, it suggests a polarized reception rather than broad appeal.
- Mode: In customer feedback surveys about a new smartphone, the mode of responses to questions like “What is your favorite feature?” can highlight what resonates most with users, guiding future product development.
- Range: The range of battery life reported by users for a smartwatch can quickly alert potential buyers to the variability in performance they might encounter based on usage patterns.
2. Brand: Understanding Perception and Market Position
In branding, understanding your audience and market is paramount. These statistical measures help in analyzing customer sentiment, market share, and the effectiveness of marketing campaigns.
2.1. Brand Strategy and Identity
- Mean: If conducting a survey on brand perception, the mean score for “brand trustworthiness” can offer an aggregate measure. However, this might mask underlying divisions in how different customer segments perceive the brand.
- Median: The median score for brand recognition, especially when segmented by age groups or geographic locations, can reveal if the brand resonates equally across all demographics. A significant difference between the mean and median might indicate a need for targeted marketing efforts.
- Mode: Analyzing open-ended survey responses about brand associations, the mode of keywords used to describe the brand can reveal the most prevalent perceptions. For instance, if “innovative” appears most frequently, this can be leveraged in messaging.
- Range: The range of customer satisfaction scores for a brand’s service can highlight the disparity in experiences. A wide range suggests inconsistency in service delivery, a critical area to address for brand reputation.
2.2. Marketing Campaign Effectiveness
- Mean: The mean click-through rate (CTR) across various ad placements gives an initial indication of campaign performance.
- Median: When analyzing conversion rates for a marketing funnel, the median conversion rate at each stage provides a more accurate picture of where the majority of users are succeeding or dropping off, free from extreme outliers that might distort the view.
- Mode: In A/B testing headlines for a marketing campaign, the mode of customer preference for one headline over another, based on engagement metrics, can decisively inform the final choice.
- Range: The range of engagement times on a new product landing page can indicate how much variation exists in user interest. A very narrow range might suggest consistent engagement, while a wide range could mean some users are highly engaged and others quickly lose interest.
2.3. Reputation Management
- Mean: Monitoring social media mentions, the mean sentiment score (e.g., on a scale of -5 to +5) provides a general overview of public perception.
- Median: The median sentiment score is more resilient to a few viral, highly negative or positive posts, offering a truer reflection of everyday public sentiment towards the brand.
- Mode: Analyzing customer support interactions, the mode of common complaints or issues can pinpoint recurring problems that need systemic solutions to improve overall customer experience and brand reputation.
- Range: The range of response times to customer inquiries on social media can reveal the inconsistency in service. A wide range signals that some customers get quick replies while others wait excessively, impacting perceived responsiveness.
3. Money: Navigating Personal Finance and Business Growth
In the financial world, from personal budgeting to large-scale investments, understanding data is crucial for making sound decisions, identifying opportunities, and mitigating risks.
3.1. Personal Finance and Budgeting
- Mean: When tracking monthly expenses, the mean expenditure on a category like “dining out” can give a general idea of spending habits. However, a particularly lavish month can skew this average.
- Median: The median monthly income is a more representative figure for understanding the typical earning power of a group or individual, as it’s less affected by exceptionally high or low earners.
- Mode: In analyzing spending patterns, the mode of transactions might reveal the most frequent purchase type or store, helping to identify areas where spending can be consciously reduced.
- Range: The range of daily stock price fluctuations for a particular investment can give an investor a sense of its volatility. A large range suggests higher risk but potentially higher reward.
3.2. Investing and Online Income
- Mean: The mean annual return on a diversified investment portfolio provides an average performance figure.
- Median: For investments with potentially volatile returns, the median return can offer a more realistic expectation of typical performance over time.
- Mode: If you’re analyzing the popularity of different online income streams, the mode can reveal which methods are most commonly pursued or discussed by individuals seeking to supplement their income.
- Range: The range of daily profits from an e-commerce side hustle can indicate the variability of income. A large range might necessitate careful cash flow management.
3.3. Business Finance and Growth
- Mean: For a sales team, the mean number of deals closed per salesperson offers an average performance metric.
- Median: When evaluating the success of a new product launch, the median sales volume across all regions can provide a more accurate picture of typical performance, unaffected by exceptionally strong or weak market responses in isolated areas.
- Mode: In analyzing customer lifetime value, the mode might reveal the most common duration of customer relationships, informing retention strategies.
- Range: The range of profit margins across different product lines for a business can highlight which products are most consistently profitable and which experience wider swings in profitability, guiding inventory and pricing decisions.

Conclusion
The mean, median, mode, and range are not just abstract mathematical concepts; they are powerful tools for understanding and interpreting the vast amounts of data that shape our world. In Tech, they help us gauge performance, understand user behavior, and improve products. In Brand, they enable us to assess market perception, measure campaign impact, and manage reputation. And in Money, they are indispensable for personal financial planning, investment strategies, and business growth.
By mastering the nuances of these statistical measures and understanding how they apply to your specific interests and professional field, you equip yourself with the ability to make more informed decisions, identify hidden trends, and ultimately, navigate the complexities of the modern landscape with greater confidence and clarity.
aViewFromTheCave is a participant in the Amazon Services LLC Associates Program, an affiliate advertising program designed to provide a means for sites to earn advertising fees by advertising and linking to Amazon.com. Amazon, the Amazon logo, AmazonSupply, and the AmazonSupply logo are trademarks of Amazon.com, Inc. or its affiliates. As an Amazon Associate we earn affiliate commissions from qualifying purchases.