
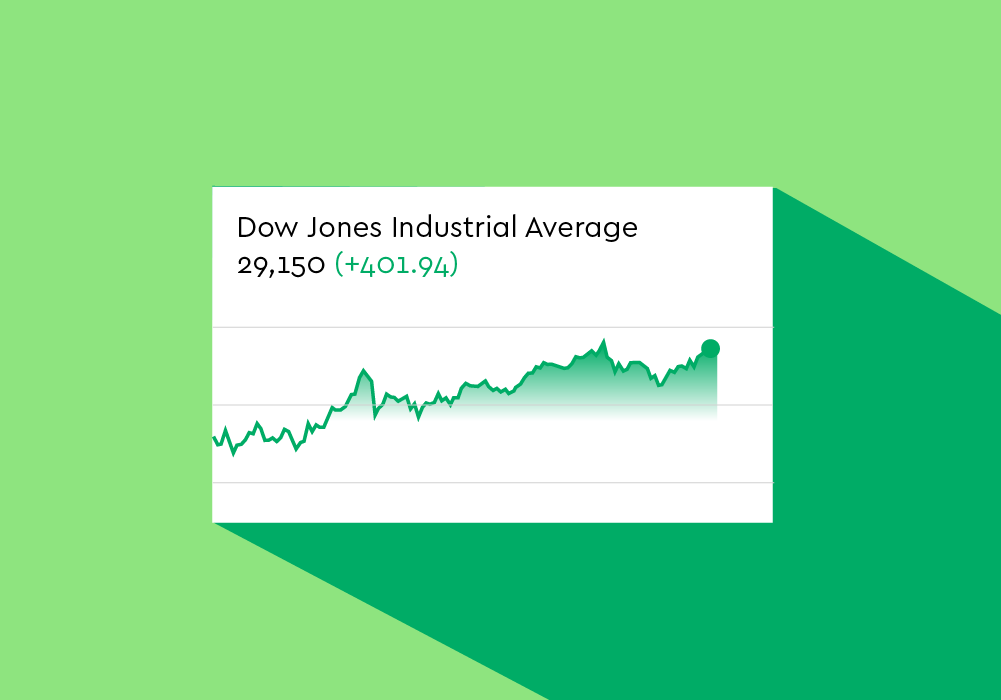
In the intricate world of finance, few names resonate with as much immediate recognition and historical weight as “The Dow.” Whether mentioned in daily news reports, economic analyses, or casual conversations about the stock market, the Dow Jones Industrial Average (DJIA) stands as a foundational benchmark. But beyond the often-quoted daily points gain or loss, what does the Dow truly signify? What is its genesis, how is it constructed, and what role does it play for investors, economists, and the general public? To fully grasp its importance, one must delve into its origins, its unique methodology, and its enduring, albeit sometimes debated, relevance as a barometer of the U.S. stock market and broader economic health.
The Genesis of an Investment Icon: A Historical Perspective
To understand the Dow today, we must first journey back to its origins in the late 19th century, a period of dramatic industrial expansion and burgeoning financial markets. Its inception was the brainchild of visionaries who sought to bring clarity and order to an increasingly complex economic landscape.
Charles Dow and the Birth of Market Indices
The Dow Jones Industrial Average was created by Charles Dow, a journalist and co-founder of Dow Jones & Company, along with Edward Jones and Charles Bergstresser. Dow’s aim was revolutionary for its time: to provide a clear, simple measure of the health of the American stock market. He believed that by tracking the performance of a select group of prominent industrial companies, one could gain insight into the overall direction of the economy.
The first Dow Jones Average, introduced on May 26, 1896, was composed of just 12 companies, primarily railroads, which were the dominant industrial force of the era. This initial average was a simple sum of the stock prices of these companies, divided by the number of companies. It was a crude but effective tool for its time, providing a daily snapshot that was easily understandable. Charles Dow himself was a pioneer in technical analysis, and his work with the averages laid the groundwork for what would later be known as “Dow Theory,” a significant contribution to understanding market trends. The concept of an index, a single number representing a basket of securities, was born, forever changing how investors and the public perceived market movements.
From Rails to Rockets: The Evolution of the Dow’s Components
Over its more than 125-year history, the Dow has undergone continuous evolution, reflecting the changing landscape of American industry. The initial 12-company index quickly expanded as the U.S. economy diversified. The “Industrial” in its name, while historically accurate, is now something of a misnomer, as its components today span a wide range of sectors beyond traditional heavy industry.
The composition of the DJIA is not static; it is actively managed by a committee at S&P Dow Jones Indices. Companies are added or removed not based on strict quantitative rules, but on qualitative judgment. The committee seeks to ensure the index accurately reflects the broad composition of the U.S. economy and represents significant U.S. companies with excellent reputations, demonstrated sustained growth, and interest to a large number of investors. This dynamic nature means that while GE was an original component and held its place for over a century, companies like Apple, Microsoft, and Salesforce have joined more recently, illustrating the shift from manufacturing giants to technology and services powerhouses. This constant curation ensures that the Dow remains relevant, even as the global economy transforms at an accelerating pace.
Deconstructing the Dow: What It Represents and How It Works
Understanding the Dow requires more than just knowing its history; it demands a clear grasp of its composition and the unique methodology behind its calculation. This is where the Dow distinguishes itself from many other modern indices.
The “Industrial” Misnomer: A Diverse Portfolio
Despite its name, the Dow Jones Industrial Average is no longer confined to traditional industrial companies. Today, its 30 components represent a broad cross-section of major U.S. industries, including technology, healthcare, finance, retail, consumer goods, and even entertainment. For example, tech giants like Apple and Microsoft, healthcare leaders like Johnson & Johnson, financial powerhouses like JPMorgan Chase, and retail behemoths like Walmart all find a place within the index.
This diversity is crucial because it allows the Dow to serve as a more comprehensive proxy for the overall health of the U.S. corporate sector and, by extension, the broader economy. While not a perfectly representative sample, the inclusion of these blue-chip companies means that their collective performance often mirrors the general sentiment and trajectory of the American economy. When these large, established companies are thriving, it suggests a healthy economic environment; conversely, their struggles can signal broader economic headwinds.
The Price-Weighted Methodology: An Explainer
One of the most distinctive and often-discussed aspects of the DJIA is its price-weighted methodology. Unlike indices such as the S&P 500, which are market-capitalization weighted (meaning companies with larger total market values have a greater impact on the index), the Dow assigns influence based purely on a company’s share price.
In a price-weighted index, a stock with a higher per-share price will have a greater impact on the index’s value than a stock with a lower per-share price, even if the latter company has a significantly larger overall market capitalization. For instance, if Company A trades at $300 per share and Company B trades at $50 per share, a $1 increase in Company A’s price will have six times the impact on the Dow’s value as a $1 increase in Company B’s price, regardless of how many shares of each company are outstanding. This characteristic can sometimes lead to distortions, as a company with a high share price but smaller economic footprint might exert more influence than a massive company with a lower share price.
The Divisor: Maintaining Historical Continuity
The price-weighted nature of the Dow necessitated the introduction of a “Dow Divisor.” Initially, when there were only 12 stocks, the average was simply calculated by summing the prices and dividing by 12. However, corporate actions such as stock splits, mergers, or changes in the index’s components would artificially alter the index’s value if the divisor remained constant.
To counteract these artificial changes and ensure that the index’s movements accurately reflect only the true price movements of its underlying stocks, the Dow Divisor is adjusted. When a stock splits (e.g., one share becomes two, halving the price per share), the divisor is reduced proportionally to maintain the index’s value at the precise moment of the split. Similarly, when a company is added or removed, or if there’s a special dividend, the divisor is adjusted. This complex but crucial mechanism ensures the historical continuity of the Dow, allowing for accurate comparisons of its value over decades, despite numerous changes to its constituents and their individual share prices. Without the divisor, the “average” would be a constantly shifting target, losing its utility as a consistent benchmark.
The Dow as an Economic Thermometer: Significance and Interpretation
The Dow’s enduring presence in financial news and economic discussions stems from its perceived ability to act as a bellwether for the U.S. economy. While it has its limitations, its daily movements are often interpreted as signals of broader economic health and investor sentiment.
A Snapshot of Blue-Chip Performance
At its core, the Dow provides a snapshot of the performance of 30 of America’s largest, most established, and widely recognized companies. These “blue-chip” stocks are often leaders in their respective industries, boast strong balance sheets, and have a track record of stability and profitability. Their collective performance, therefore, can offer valuable insights into the health of the corporate sector that forms the backbone of the U.S. economy.
When the Dow is rising steadily, it suggests that these major corporations are performing well, which often translates to robust earnings, strong consumer demand, and a generally optimistic economic outlook. Conversely, a declining Dow can signal concerns about corporate profitability, potential recessions, or a general weakening of economic conditions. For many, it’s the simplest and most accessible indicator to quickly gauge how the “big players” in the market are faring.
Gauging Investor Sentiment and Market Health
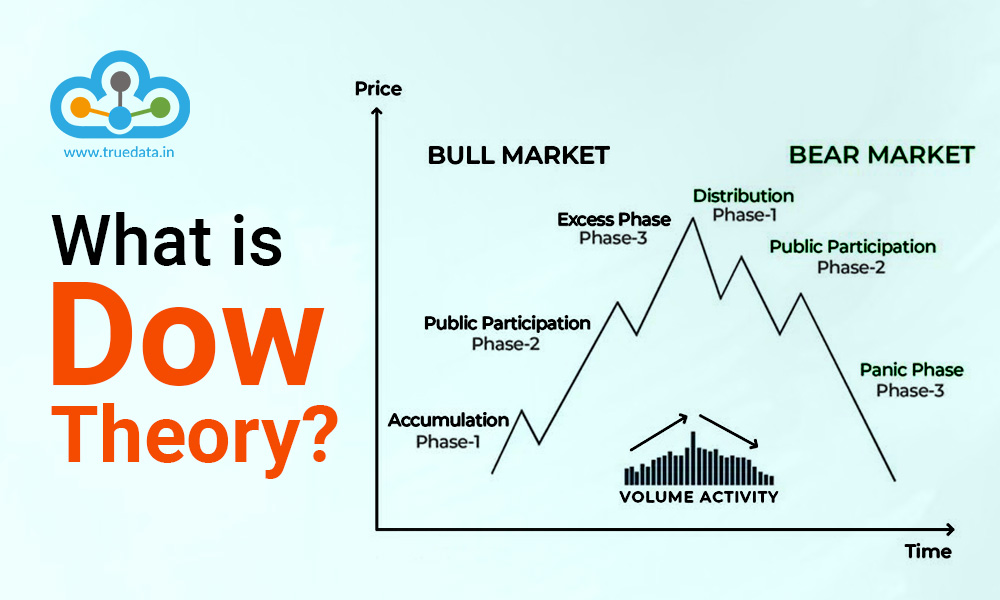
Beyond just corporate performance, the Dow is also a powerful gauge of investor sentiment. Large institutional investors and individual traders alike watch the Dow’s movements closely. A significant daily swing in either direction often reflects a broader shift in how investors perceive future economic prospects, corporate earnings, or geopolitical risks.
For instance, a sharp decline might indicate a surge in fear or uncertainty, prompting investors to sell off their holdings. Conversely, a strong rally could be driven by renewed optimism, positive economic data, or favorable corporate announcements, encouraging buying activity. While not perfectly predictive, the collective action of millions of investors reflected in the Dow’s daily fluctuations offers a valuable, real-time pulse of market psychology. It helps financial professionals and the public understand the prevailing mood towards risk and investment opportunities.
Beyond the Daily Headlines: Long-Term Trends
While daily fluctuations grab headlines, the true power of the Dow lies in its ability to illustrate long-term economic trends. Over decades, the Dow has weathered numerous market crashes, economic recessions, and global crises, yet it has consistently shown an upward trajectory, reflecting the underlying growth and resilience of the American economy and its corporations.
Observing the Dow’s performance over several years, or even decades, provides invaluable context for understanding economic cycles, periods of innovation, and the long-term compounding power of equity investments. Analysts and investors look at trends like moving averages or multi-year charts of the Dow to identify patterns, confirm bull or bear markets, and make strategic investment decisions. It serves as a historical ledger, documenting the ebbs and flows of American economic prowess and technological advancement.
Criticisms and Limitations: A Nuanced View
Despite its iconic status and widespread use, the Dow is not without its critics. Its unique methodology and limited number of components lead to several inherent limitations that must be understood for a truly nuanced interpretation.
Representativeness: Is 30 Enough?
The most frequent criticism leveled against the Dow is its limited number of components. With only 30 companies, it represents a tiny fraction of the thousands of publicly traded companies in the U.S. stock market. Critics argue that such a small sample size cannot truly capture the vast diversity and breadth of the entire American economy. Many innovative small and mid-sized companies, which often drive significant growth and job creation, are not included.
This narrow focus means the Dow might not accurately reflect the performance of broader market segments. For example, if the 30 Dow companies are performing well, but thousands of smaller companies are struggling, the Dow might present an overly optimistic picture of market health. While its constituents are carefully chosen for their significance, the “snapshot” it provides is necessarily limited in scope, making it less of a comprehensive market indicator than broader indices like the Wilshire 5000 or even the S&P 500.
Price-Weighting Bias: Larger Share Price, Greater Influence
The price-weighted methodology is another major point of contention. As discussed, a company with a high share price has a disproportionately large impact on the index’s movements, regardless of its actual market capitalization or economic size. This can lead to situations where a relatively smaller company (by market value) with an expensive stock contributes more to the Dow’s daily change than a much larger company (by market value) with a lower-priced stock.
This bias means the Dow is not a true reflection of the wealth creation or market value distribution within the economy. A surge in a single high-priced stock can significantly lift the Dow even if other, economically larger components are flat or declining. This contrasts sharply with market-capitalization-weighted indices, where companies like Apple or Microsoft (due to their enormous market caps) naturally exert more influence, which many argue provides a more accurate representation of overall market value changes.
The Illusion of Precision: A Single Number’s Story
Finally, the Dow, often quoted to the nearest hundredth of a point, can create an illusion of precision that belies its underlying simplifications. When the Dow moves up or down by a certain number of points, it’s easy to interpret this as a definitive statement about the economy. However, as noted, it’s influenced by just 30 stocks and a specific, sometimes distorting, weighting method.
Focusing solely on the Dow’s point changes can lead to an incomplete or even misleading understanding of market dynamics. For instance, a 100-point move today represents a much smaller percentage change than it did decades ago when the index’s absolute value was much lower. Therefore, simply looking at the points moved without considering the percentage change or comparing it to other, broader indices, can provide a skewed perspective. It’s a powerful narrative tool, but its single-number story requires careful interpretation within a broader financial context.
Leveraging the Dow: Its Role for Investors and Analysts
Despite its criticisms, the Dow remains a highly relevant and useful tool for investors and financial analysts, serving various practical purposes within the financial ecosystem.
A Benchmark for Portfolio Performance
For many investors, particularly those focused on large-cap U.S. equities, the Dow serves as a readily accessible benchmark against which to measure their portfolio’s performance. If an investor’s portfolio of U.S. stocks is underperforming the Dow, it might prompt a review of their investment strategy or individual holdings. Conversely, outperforming the Dow can be a source of satisfaction, though it should always be considered alongside other benchmarks that might better reflect the portfolio’s specific asset allocation.
Financial advisors often refer to the Dow’s performance when discussing market conditions with clients, providing a familiar point of reference. While not the most comprehensive benchmark, its simplicity and ubiquity make it an effective starting point for evaluating market-related returns.
Index Funds and ETFs: Investing in the Dow
Investors seeking to gain exposure to the companies within the Dow without buying each stock individually can do so through various investment vehicles. Exchange-Traded Funds (ETFs) and mutual funds designed to track the performance of the DJIA are popular options. The most well-known example is the SPDR Dow Jones Industrial Average ETF (DIA), often referred to as “Diamonds.”
These index funds provide a cost-effective and diversified way to invest in the 30 blue-chip companies. By buying shares in a Dow-tracking ETF, an investor gains proportional exposure to the price movements of the entire index, benefiting from the collective performance of these market leaders. This allows individuals to participate in the growth of established American industry without the need for extensive research into individual stocks.

A Component of Broader Economic Analysis
For economists, market strategists, and financial journalists, the Dow is an integral component of broader economic analysis. While they understand its limitations, they use it in conjunction with other indices (like the S&P 500, Nasdaq Composite, Russell 2000), economic indicators (GDP, unemployment rates, inflation), and corporate earnings reports to construct a holistic view of the market and economy.
The Dow’s movements can provide clues about the health of specific sectors represented within its 30 companies and offer insights into the confidence levels of the largest corporations. Its long history also makes it valuable for historical comparisons and identifying long-term cyclical patterns. When discussing “the market,” the Dow often serves as shorthand, a recognized symbol that communicates general trends, even if a deeper dive requires consulting more comprehensive data.
In conclusion, “what does the Dow mean?” is a question that unpacks layers of financial history, economic methodology, and investment strategy. It is more than just a number; it is a legacy, a carefully curated barometer of America’s corporate giants, and a powerful, albeit imperfect, indicator of economic sentiment and direction. For its simplicity and enduring presence, the Dow Jones Industrial Average remains a cornerstone of financial discourse, a testament to Charles Dow’s enduring vision for understanding the pulse of the market.
aViewFromTheCave is a participant in the Amazon Services LLC Associates Program, an affiliate advertising program designed to provide a means for sites to earn advertising fees by advertising and linking to Amazon.com. Amazon, the Amazon logo, AmazonSupply, and the AmazonSupply logo are trademarks of Amazon.com, Inc. or its affiliates. As an Amazon Associate we earn affiliate commissions from qualifying purchases.