
The world of finance is replete with acronyms, indices, and metrics that can often seem impenetrable to the uninitiated. Among these, the Dow Jones Industrial Average (DJIA), frequently referred to simply as “the Dow,” stands out as one of the oldest, most recognized, and most frequently cited market indicators globally. But beyond the daily headlines proclaiming its rise or fall, what does this number truly represent, and why does it hold such sway over investors and the general public alike? Understanding the Dow is crucial for anyone seeking to grasp the pulse of the American stock market and, by extension, a significant portion of the U.S. economy. It’s more than just a figure; it’s a snapshot, albeit an imperfect one, of the performance of some of America’s most influential companies, offering insights into market sentiment, economic health, and the broader landscape of business and investment.
Understanding the Dow Jones Industrial Average: The Basics
At its core, the Dow Jones Industrial Average is a stock market index that measures the stock performance of 30 large companies listed on stock exchanges in the United States. It is one of several indices created by Charles Dow, co-founder of Dow Jones & Company, and was first published in May 1896. Its longevity and consistent presence in financial news have cemented its status as a bellwether for the American industrial sector, despite its evolving composition over more than a century.
A Historical Perspective
The Dow’s origins trace back to an era dominated by heavy industry, railways, and telegraph companies. When it first launched, it comprised just 12 companies, primarily in sectors like cotton, sugar, oil, and tobacco. The “Industrial” in its name was a literal reflection of the economic landscape of the late 19th century. Over time, as the U.S. economy transformed, so too did the composition of the Dow. It expanded to 30 stocks in 1928, a number it has maintained ever since. This evolution from industrial giants to include technology, finance, retail, and healthcare behemoths mirrors the broader shifts in the American economic engine, showcasing how innovation and changing consumer demands redefine leading industries. Its history is, in many ways, a condensed chronicle of American capitalism itself, charting recessions, booms, and technological revolutions through the lens of its constituent companies’ fortunes.
The “Industrial” Misnomer
While the “Industrial” moniker remains, it is largely a historical relic. Today, the DJIA’s 30 companies represent a diverse cross-section of the U.S. economy, extending far beyond traditional heavy industries. Companies like Apple (technology), Goldman Sachs (finance), Microsoft (software), Nike (apparel), and Visa (payment processing) are just a few examples that highlight the index’s broad reach. The selection process for these 30 companies is not based on rigid quantitative rules but rather on the discretion of the index committee at S&P Dow Jones Indices, with the goal of selecting companies that have an excellent reputation, demonstrate sustained growth, and are of interest to a large number of investors. This means the Dow aims to capture the essence of the broader market through the lens of its most prominent and impactful corporations, irrespective of their original industrial classification.
Who are the 30 Companies?
The list of 30 companies that comprise the Dow is not static; it changes periodically to reflect shifts in the U.S. economy and the relative prominence of different industries and corporations. Changes are rare but significant, often signaling a major shift in economic leadership or the decline of a former titan. For instance, companies like General Electric, a founding member that represented American industrial prowess for over a century, were eventually removed as their economic dominance waned. Conversely, the inclusion of companies like Salesforce or Amgen in recent years underscores the growing importance of cloud computing, enterprise software, and biotechnology in the modern economy. These 30 companies are chosen for their size, influence, and broad investor interest, making the Dow a snapshot of the current corporate leaders and innovators driving economic activity in the United States.
How the DJIA is Calculated and What it Represents
Unlike many modern stock indices that are weighted by market capitalization (meaning companies with higher market values have a greater impact), the Dow Jones Industrial Average employs a unique and somewhat idiosyncratic method of calculation: it is a price-weighted average. This distinction is crucial for understanding its movements and comparing it to other indices.
The Price-Weighted Average Explained
In a price-weighted index, stocks with higher share prices have a greater influence on the index’s value than stocks with lower share prices, regardless of the company’s overall market capitalization. For example, if a stock trading at $300 per share rises by $1, it will have a more significant impact on the Dow’s total value than a stock trading at $50 per share that also rises by $1. This characteristic is a legacy of its original calculation method from over a century ago, conceived before the advent of sophisticated computing power. While straightforward, it means that a company with a high share price but a relatively small market cap might move the Dow more than a company with a massive market cap but a lower share price. This is a common point of criticism and differentiates it significantly from the S&P 500, which is market-cap weighted.
The Role of the Dow Divisor
To maintain historical continuity and prevent the index’s value from being distorted by stock splits, mergers, or other corporate actions that change a stock’s price without reflecting a fundamental change in the company’s value, the Dow uses a “divisor.” When the Dow was first created, it was a simple average – you’d add up the prices of the 12 stocks and divide by 12. However, when a stock splits (e.g., one share becomes two shares at half the price), the simple average would suddenly drop, giving a false impression of a market decline. The Dow Divisor is a dynamic number that is adjusted to account for these events. It ensures that the index’s value remains comparable before and after a stock split, spin-off, or substitution. This divisor is always less than 30 (currently a very small decimal number), meaning that a $1 change in the price of any of the 30 stocks results in a change of roughly 6-7 points in the DJIA. This intricate adjustment mechanism allows the Dow to reflect genuine market movements rather than just arbitrary price changes.
Interpreting Daily Movements
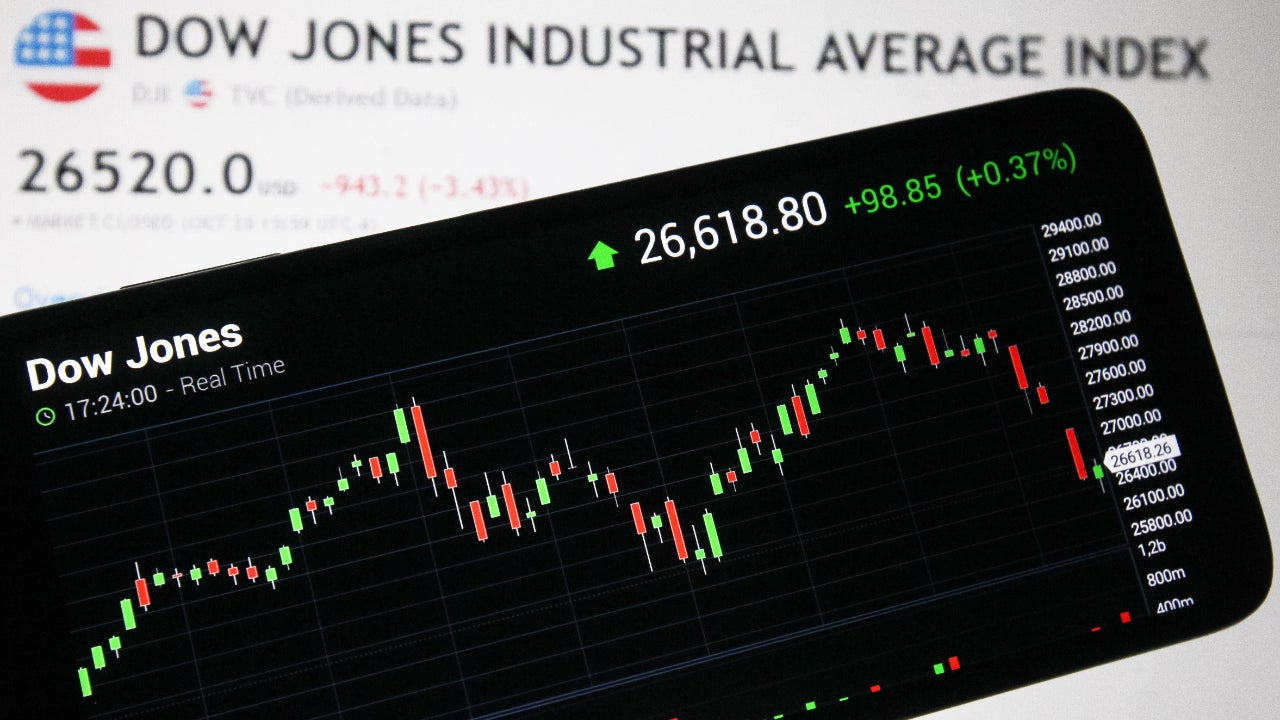
When you hear that “the Dow is up 200 points today,” it signifies that the collective average of the 30 component stocks, adjusted by the divisor, has increased by 200 points. These movements are often interpreted as a proxy for the overall health and sentiment of the U.S. stock market. A significant rise is generally seen as positive, indicating investor confidence and potential economic growth, while a substantial drop can signal fear, uncertainty, or impending economic slowdowns. However, it’s crucial to remember that this “average” is heavily influenced by its price-weighted nature and the performance of just 30 large companies. While indicative, it doesn’t tell the full story of the thousands of other publicly traded companies or the entire breadth of the U.S. economy. Investors often look at the percentage change rather than the raw point change, as a 200-point move means something different when the Dow is at 10,000 versus when it’s at 30,000.
The Dow’s Significance: Why Investors Pay Attention
Despite its technical peculiarities and criticisms, the Dow Jones Industrial Average remains immensely significant in financial markets. Its widespread recognition and consistent media coverage make it an influential indicator for both professional investors and the general public. For many, it’s the first and often only market index they track, making its movements powerful in shaping perceptions.

A Barometer for the U.S. Economy
Because the Dow comprises 30 of America’s largest and most established companies, it is often viewed as a reliable barometer for the broader U.S. economy. These companies are titans in their respective industries, with extensive operations both domestically and internationally. Their collective performance can reflect trends in consumer spending, corporate profitability, industrial output, and global economic conditions. When these companies are thriving, it often suggests a robust economic environment, and vice-versa. While not a perfect measure, the Dow offers a quick, albeit simplified, snapshot that many find accessible and useful for gauging economic health, influencing everything from policy decisions to consumer confidence reports.
Sentiment Indicator
Beyond its role as an economic barometer, the Dow is also a powerful sentiment indicator. Its daily movements, especially dramatic swings, can significantly impact investor psychology. A rising Dow can foster optimism, encouraging more investment and spending, creating a positive feedback loop. Conversely, a sharp decline can trigger fear, leading to panic selling and a general pullback in economic activity. This psychological aspect means the Dow can sometimes become a self-fulfilling prophecy; if enough people believe the market is heading in a certain direction based on the Dow’s movement, their actions can contribute to that direction. Its visibility makes it a key driver of market mood, influencing individual investment decisions and broader market trends.
Impact on Investor Behavior
For individual investors, the Dow’s performance often dictates their emotional response to their own portfolios. A continuously climbing Dow can make investors feel wealthy and secure, potentially leading to increased risk-taking or a more aggressive investment strategy. Conversely, prolonged periods of decline or extreme volatility can lead to anxiety, prompting investors to pull out of the market, often at inopportune times. Financial advisors frequently use the Dow’s overall trend to frame discussions about long-term investing principles, emphasizing that market downturns are normal and that patience is key. Understanding the Dow’s influence on investor behavior helps individuals make more rational decisions, detaching personal finance from daily market noise.
Limitations and Criticisms of the DJIA
While widely cited, the Dow is not without its detractors and has several inherent limitations that sophisticated investors and economists frequently point out. Understanding these criticisms is vital for anyone using the Dow as a basis for investment decisions or economic analysis. Relying solely on the DJIA can provide an incomplete or even misleading picture of market realities.
The Price-Weighted Flaw
The most significant criticism of the Dow is its price-weighted methodology. As discussed, a higher-priced stock, even if it represents a smaller company by market capitalization, has a disproportionately larger impact on the index’s value compared to a lower-priced stock of a much larger company. This can lead to a situation where the movement of one or two expensive stocks can skew the index, not truly reflecting the broader market or the collective value of its constituent companies. For instance, a $1 increase in a $300 stock will have six times the impact of a $1 increase in a $50 stock, even if the $50 stock belongs to a company worth far more overall. This makes the Dow a less accurate representation of total market wealth compared to market-capitalization-weighted indices like the S&P 500 or the Nasdaq Composite.
Small Sample Size
Comprising only 30 companies, the Dow represents a very small fraction of the thousands of publicly traded companies in the United States. While these 30 are indeed large and influential, they cannot fully capture the breadth, diversity, and nuances of the entire U.S. stock market or economy. Many important sectors, particularly smaller-cap growth companies and emerging industries, might be underrepresented or entirely absent from the Dow. This limited sample size means that the Dow can be less diversified and more susceptible to the idiosyncratic performance of a few companies, making it a less comprehensive market indicator than indices that track hundreds or thousands of stocks.
Lack of Diversification
Related to its small sample size, the Dow often faces criticism for its lack of true diversification across sectors and market segments. While it includes companies from various industries, it inherently focuses on large, established players. It may not adequately reflect the performance of mid-cap or small-cap stocks, which often have different growth dynamics and risk profiles. Furthermore, its selection process, being somewhat discretionary, might not always align with a purely data-driven approach to creating a representative economic cross-section. An investor tracking only the Dow would miss out on a vast universe of investment opportunities and risk an overconcentration in a specific segment of the market.
Not a True Economic Indicator on its Own
While often touted as an economic barometer, the Dow’s movements are not always perfectly correlated with the underlying health of the real economy. Stock market performance can be influenced by many factors beyond fundamental economic strength, including investor speculation, geopolitical events, interest rate expectations, and company-specific news. There have been periods where the stock market, as reflected by the Dow, has surged while the economy faced challenges, and vice-versa. Therefore, economists and financial analysts typically look at a much broader range of data—including GDP, employment figures, inflation rates, and consumer confidence—to assess the economy, viewing the Dow as just one piece of a much larger puzzle, rather than a definitive standalone indicator.
Navigating Market Volatility with the Dow in Mind
For all its limitations, the Dow Jones Industrial Average remains a prominent figure in the investment landscape. Rather than dismissing it, a savvy investor learns to use it as one tool among many, understanding its strengths and weaknesses, especially when facing the inevitable periods of market volatility. The key is to view the Dow not as the singular truth, but as a widely accessible data point that provides context.
The Dow in a Broader Investment Strategy
For individual investors, relying solely on the Dow to guide investment decisions is generally not advisable. A well-diversified investment strategy should involve exposure to a broader range of assets and market segments, potentially including the S&P 500, international stocks, bonds, and other asset classes, often through low-cost index funds or ETFs. The Dow can serve as a high-level gauge of market sentiment and the performance of mega-cap U.S. companies, but it should not be the exclusive determinant of portfolio construction. Understanding its movements can help investors contextualize news and understand the general mood, but personal investment choices should align with long-term financial goals, risk tolerance, and a comprehensive understanding of the market.
Beyond the Headline Number
Instead of fixating on the daily point changes of the Dow, a more insightful approach involves looking at its long-term trends and percentage changes. A 1% rise or fall is more meaningful than a raw point change, especially as the index value grows. Furthermore, smart investors delve deeper, examining the performance of the individual companies within the Dow, understanding which sectors are leading or lagging, and considering the underlying economic forces at play. For instance, if the Dow is falling, an investor might ask: Is it due to a specific sector experiencing headwinds, or is it a broader market correction driven by macroeconomic concerns? Analyzing these nuances provides a richer understanding than merely reacting to the top-line number.

Tools for Tracking and Analysis
In today’s digital age, numerous financial tools and platforms allow investors to track the Dow Jones Industrial Average in real-time, analyze its historical performance, and compare it against other indices. Brokerage platforms, financial news websites, and dedicated market data services offer charts, news feeds, and analytical capabilities that go beyond simple price quotes. These tools enable investors to monitor its movements in conjunction with other economic indicators and company-specific news, fostering a more informed perspective. For those interested in deeper analysis, understanding the Dow’s component changes, its divisor adjustments, and its correlation with other asset classes can provide valuable insights into market mechanics and dynamics. Ultimately, the Dow, like any financial instrument, is best understood and utilized when approached with a critical, informed, and diversified perspective.
aViewFromTheCave is a participant in the Amazon Services LLC Associates Program, an affiliate advertising program designed to provide a means for sites to earn advertising fees by advertising and linking to Amazon.com. Amazon, the Amazon logo, AmazonSupply, and the AmazonSupply logo are trademarks of Amazon.com, Inc. or its affiliates. As an Amazon Associate we earn affiliate commissions from qualifying purchases.