In the world of finance, few metrics are as fundamental or as frequently scrutinized as the Debt-to-Equity (D/E) ratio. Whether you are an individual investor looking to diversify your portfolio, an entrepreneur seeking to scale a startup, or a corporate treasurer managing a multi-million dollar balance sheet, understanding the D/E ratio is crucial. At its core, this ratio is a measure of a company’s financial leverage, providing a snapshot of how a business finances its operations—specifically, how much it relies on borrowed money versus its own internal funds.
In the “Money” niche, leverage is often described as a double-edged sword. When used wisely, it can accelerate growth and amplify returns on equity. When mismanaged, it can lead to insolvency and financial ruin. This article explores the depths of what the debt-to-equity ratio measures, how to interpret it across different sectors, and its role in strategic financial decision-making.
The Mechanics of the Debt-to-Equity Ratio
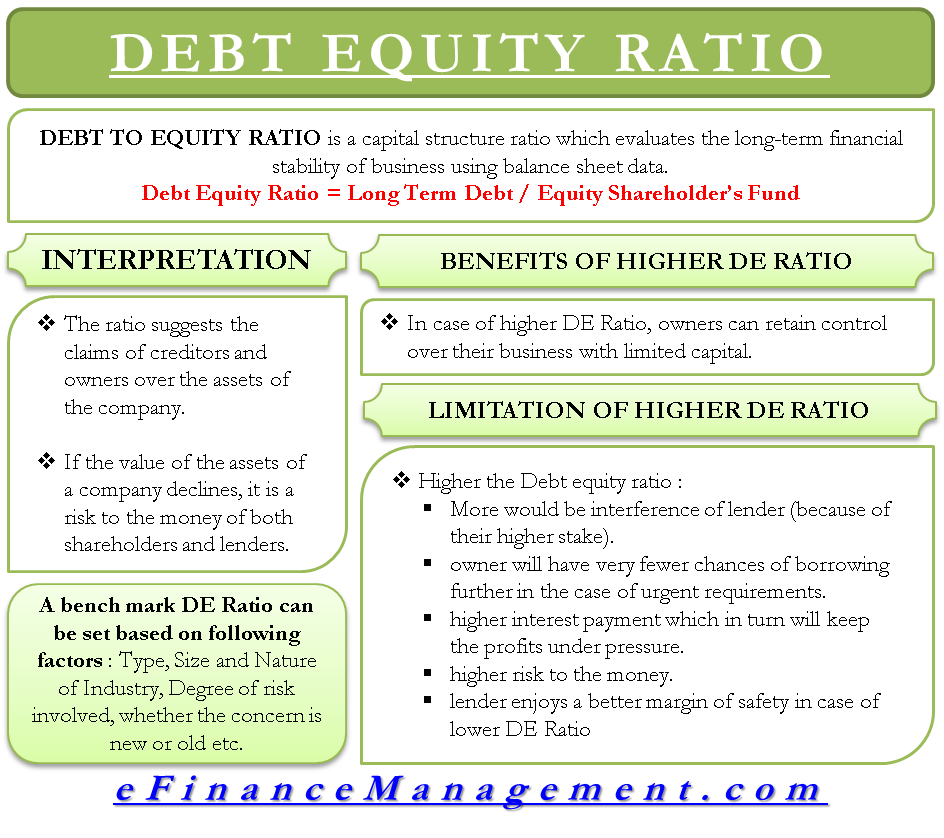
To understand what the D/E ratio measures, one must first understand its components. The ratio is calculated by dividing a company’s total liabilities by its total shareholders’ equity. These figures are found on the balance sheet, the financial statement that provides a “point-in-time” view of a company’s financial position.
The Formula and Its Components
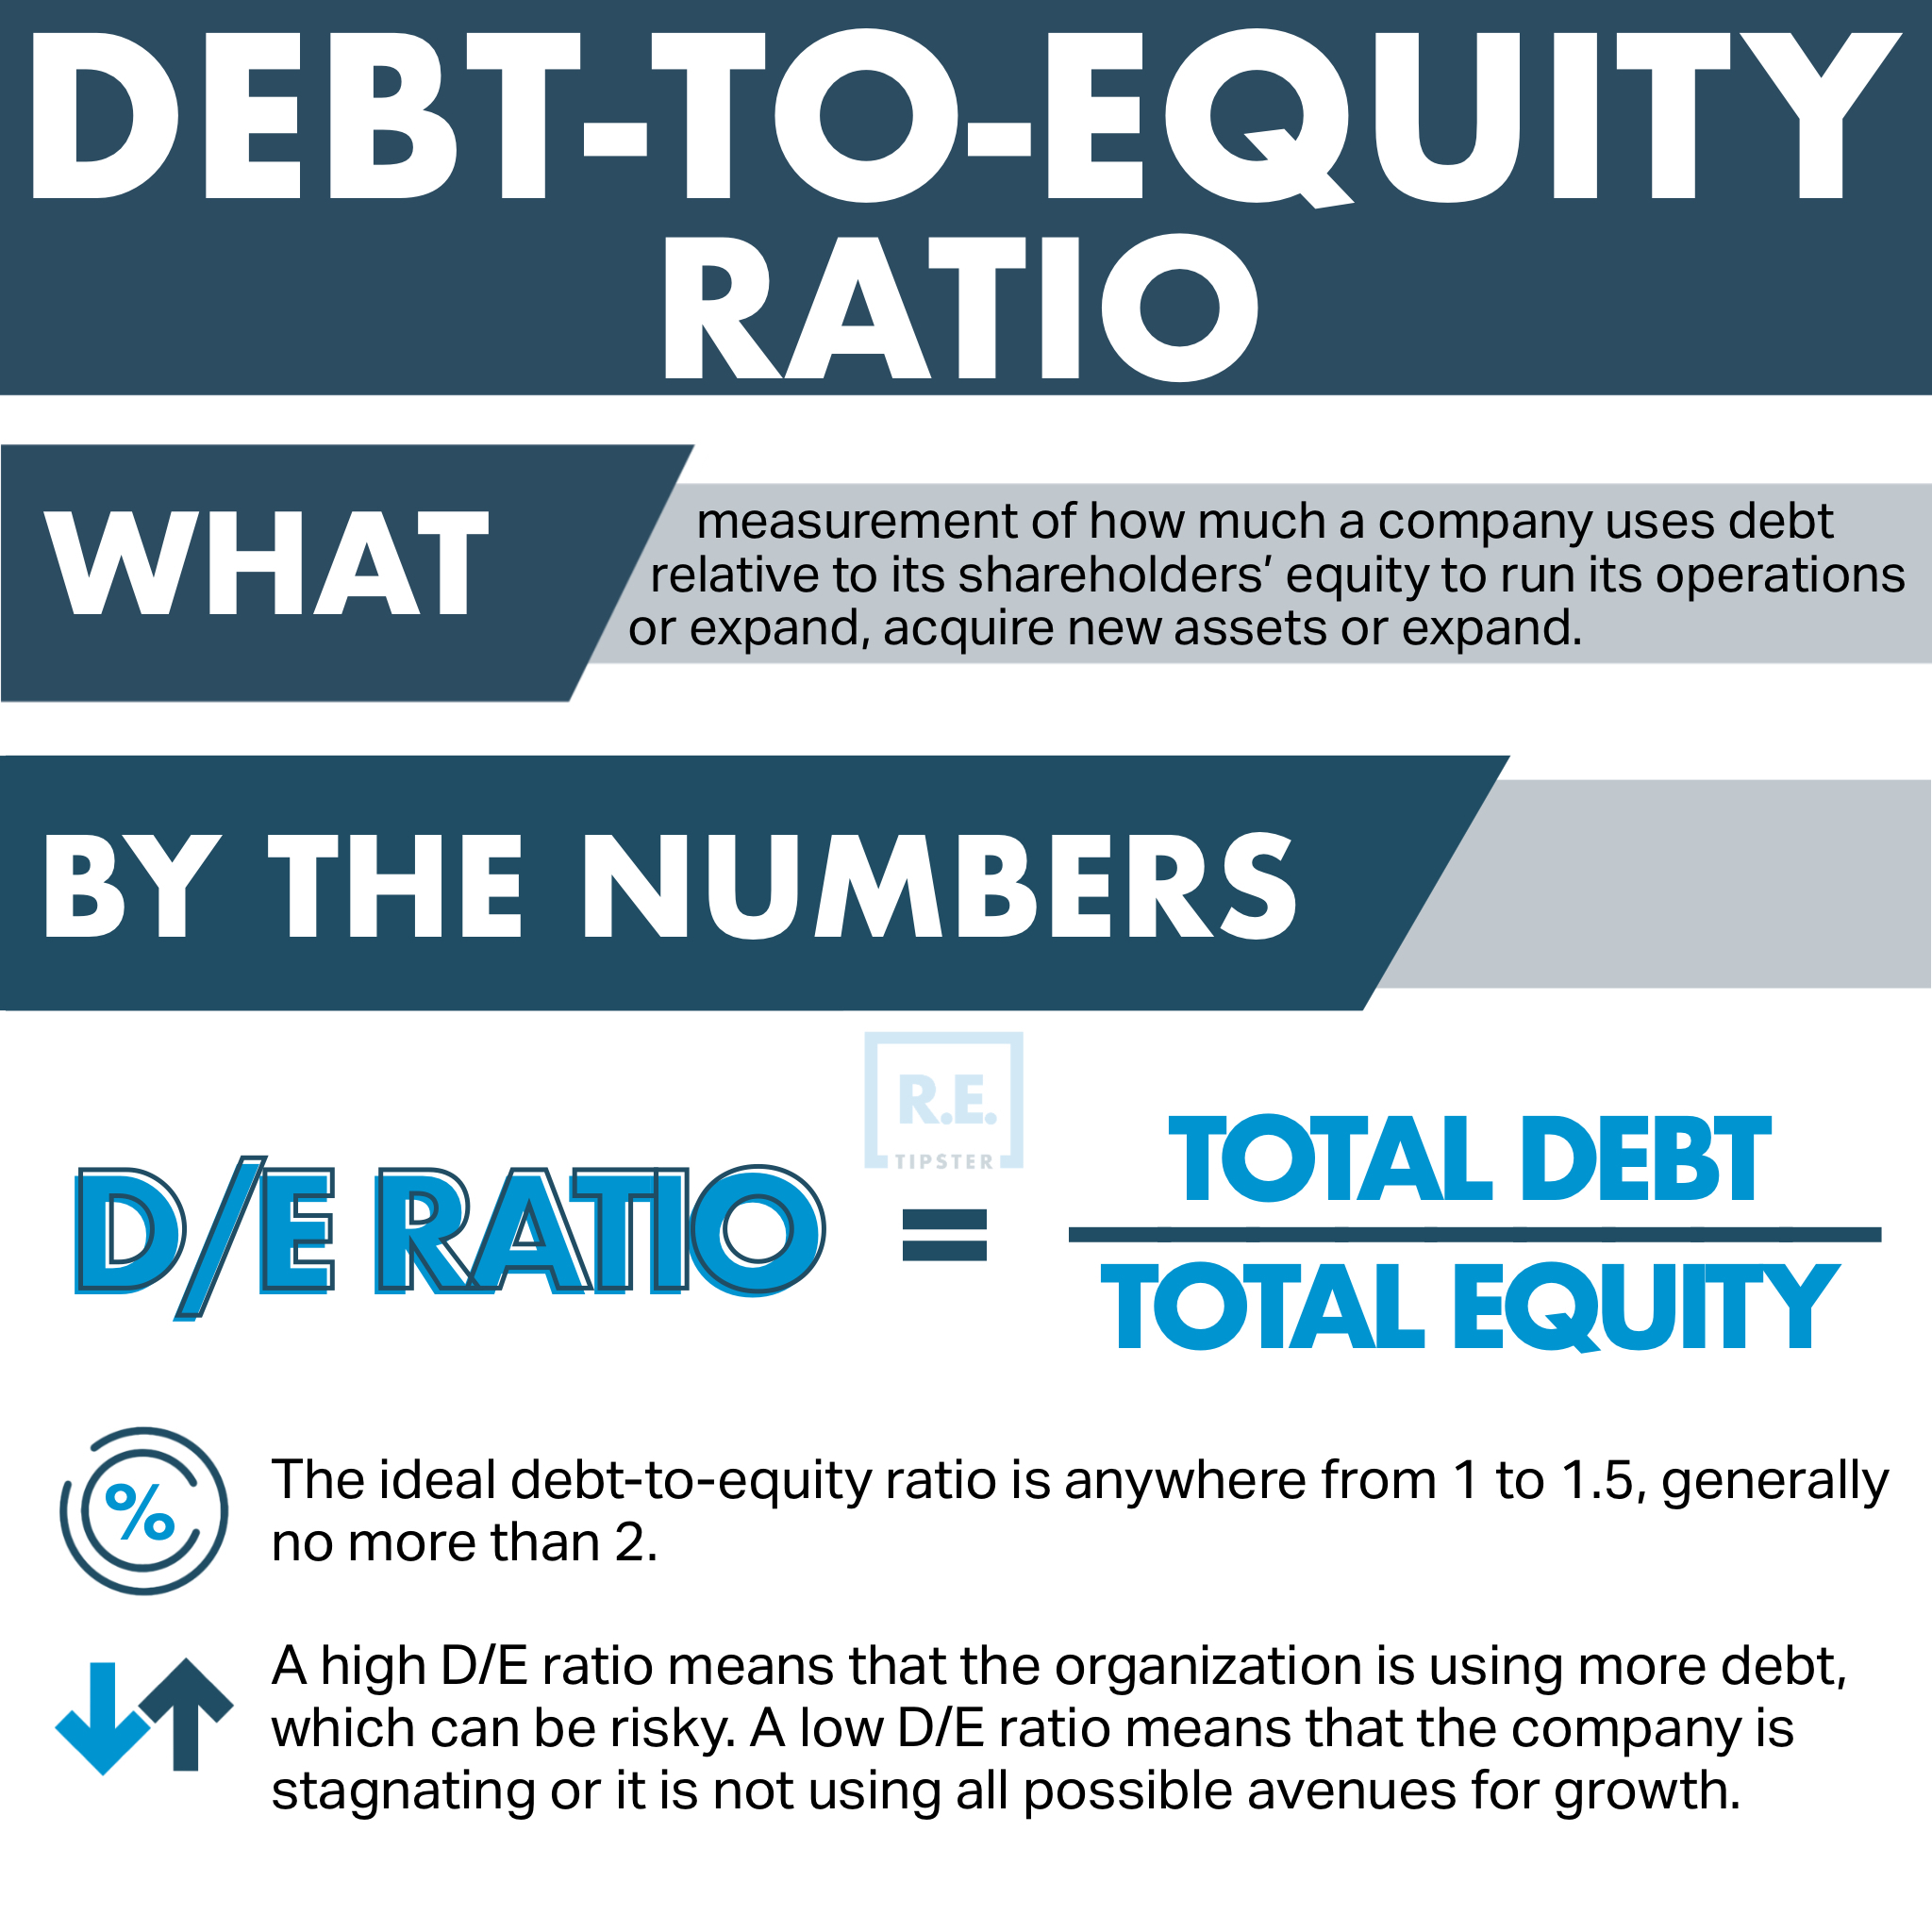
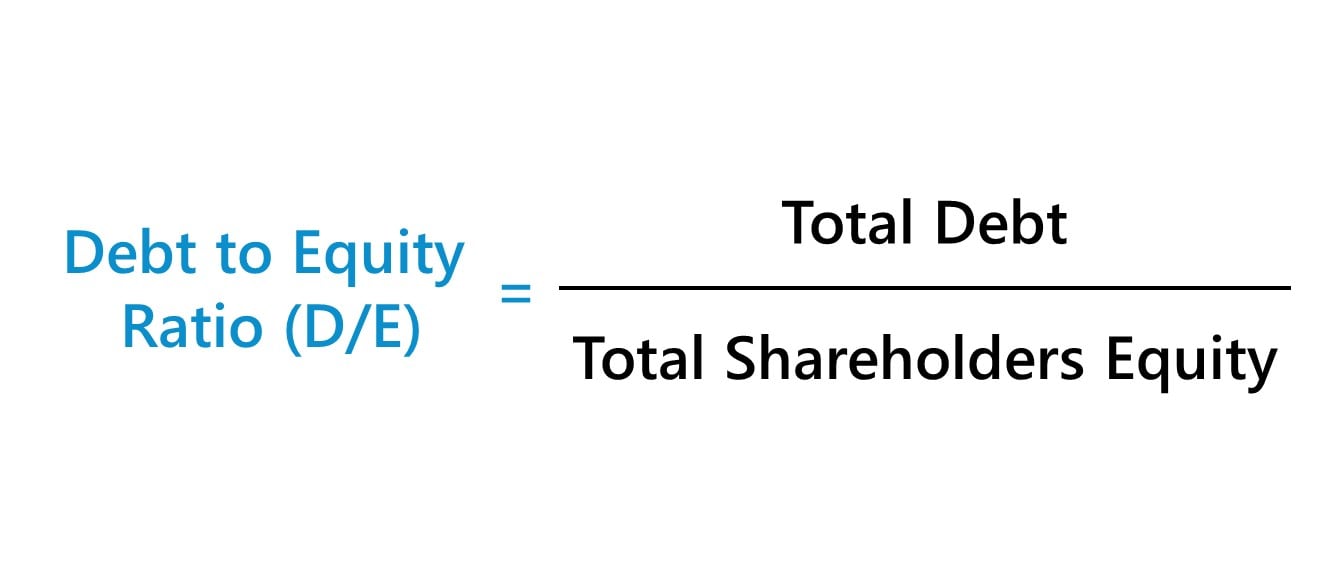
The mathematical expression is straightforward:
Debt-to-Equity Ratio = Total Liabilities / Total Shareholders’ Equity.
“Total Liabilities” encompasses all the company’s financial obligations. This includes both current liabilities (debts due within a year, such as accounts payable and short-term loans) and long-term liabilities (such as bonds issued, long-term leases, and pension obligations). “Total Shareholders’ Equity,” on the other hand, represents the amount of money that would be returned to shareholders if all assets were liquidated and all debts paid off. It consists of the initial capital invested in the company plus retained earnings accumulated over time.
Distinguishing Between Short-Term and Long-Term Liabilities
While the standard D/E ratio uses total liabilities, sophisticated investors often look closer at the composition of that debt. A company with a high D/E ratio driven primarily by long-term, low-interest bonds is in a very different position than a company whose debt is comprised of high-interest, short-term credit lines. The former suggests a calculated, long-term growth strategy, while the latter might signal a looming liquidity crisis. Understanding this distinction is vital for accurate financial assessment.
Shareholders’ Equity: More Than Just Book Value
It is important to remember that the “equity” in the D/E ratio is the book value, not the market value. In many cases, especially for established companies with significant brand power or proprietary technology, the market value of the equity is much higher than what is recorded on the balance sheet. For a “Money” professional, recognizing the gap between book equity and market capitalization is essential to avoid misinterpreting a high D/E ratio as a sign of weakness when it might simply reflect conservative accounting.
What the Ratio Reveals About Financial Health
The D/E ratio is a primary indicator of financial risk. It measures the extent to which a company is “leveraged.” In the context of business finance, leverage refers to the use of borrowed capital for an investment, expecting the profits made to be greater than the interest payable.
Measuring Leverage and Risk
The ratio essentially tells us the “cushion” a company has. If a company has a D/E ratio of 2.0, it means for every dollar of equity owned by shareholders, the company owes two dollars to creditors. This indicates a higher risk profile because the company is obligated to make interest payments regardless of its profit levels. If revenue dips, a highly leveraged company may struggle to meet these fixed obligations, potentially leading to bankruptcy. Conversely, a low D/E ratio suggests a more conservative financing approach with less reliance on external debt.
The Cost of Capital vs. Control
One of the most insightful aspects of the D/E ratio is what it reveals about a company’s capital structure strategy. Equity capital is “expensive” in the sense that it requires giving up ownership and sharing future profits with more people. Debt, however, is often “cheaper” because interest payments are tax-deductible, and creditors do not have a claim on future profits beyond the agreed interest. A company with a moderate D/E ratio is often trying to balance the lower cost of debt with the safety and control provided by equity.
Industry Benchmarks: Why Context Matters
There is no universal “good” D/E ratio. What constitutes a healthy ratio depends heavily on the industry. For example, capital-intensive industries like utilities, manufacturing, or telecommunications often carry high D/E ratios (often 2.0 or higher) because they require massive upfront investments in infrastructure that are financed through long-term debt. In contrast, service-based businesses or software companies often have very low D/E ratios because they have fewer physical assets to pledge as collateral and generate high cash flows that can fund growth internally.
Interpreting High vs. Low D/E Ratios
Investors and business owners must look beyond the raw number to understand the narrative behind the ratio. A high or low ratio is not inherently good or bad; it is a signal that requires further investigation.
The Risks of Over-Leveraging
A high D/E ratio is a red flag if it is rising over time without a corresponding increase in earnings. This suggests that the company is borrowing money just to stay afloat or is over-extending itself on projects that aren’t yielding a return. In a rising interest rate environment, high leverage becomes even more dangerous, as the cost of servicing that debt increases, eating into net profit margins.
When a High Ratio is a Growth Signal
On the flip side, a high D/E ratio can be a sign of a “growth” phase. If a company takes on debt to build a new factory or acquire a competitor, the D/E ratio will spike. However, if these investments lead to significantly higher future earnings, the debt is seen as a strategic tool rather than a burden. In the world of “Online Income” and “Side Hustles,” this is equivalent to taking out a small business loan to purchase inventory that you know will sell at a 300% markup.
The Conservative Approach: Low D/E Benefits
A low D/E ratio (typically below 1.0) indicates a company that is primarily funded by its owners. This is often seen as a sign of financial stability and “staying power.” Such companies are better positioned to weather economic downturns because they don’t have the constant pressure of massive interest payments. However, an excessively low D/E ratio might also suggest that management is too conservative and is missing out on growth opportunities that could be safely funded through leverage.
Limitations of the Debt-to-Equity Ratio
While powerful, the D/E ratio is not a perfect metric. Relying on it in isolation can lead to a skewed perception of a company’s financial standing.
Intangible Assets and Equity Distortion
One major limitation is that the D/E ratio relies on “Total Shareholders’ Equity,” which is based on the book value of assets. In the modern economy, much of a company’s value lies in intangible assets like patents, brand reputation, and intellectual property. These are often not fully captured on the balance sheet. Consequently, a company might appear to have very little equity (leading to a high D/E ratio) despite having immense market value and earning potential.
Variations in Accounting Practices
Different companies may use different accounting methods for depreciation or inventory valuation, which can affect the “Equity” portion of the ratio. Furthermore, some companies utilize “off-balance-sheet” financing, where certain liabilities are kept off the main financial statements through complex legal structures. To get a true picture, a diligent financial analyst must look at the “Total Debt” specifically (interest-bearing liabilities) rather than just “Total Liabilities.”
Strategic Decision-Making Using D/E
The D/E ratio is more than just a reporting tool; it is a vital instrument for strategic planning in business finance and personal investing.
For Investors: Assessing Stocks
When evaluating potential stock investments, the D/E ratio helps you assess the “risk-reward” profile of a company. If you are a conservative investor looking for steady dividends, you might gravitate toward companies with lower D/E ratios. If you are looking for high-growth “alpha,” you might look for companies with higher leverage that are successfully using that debt to expand their market share.
For Entrepreneurs: Planning Capital Structure
If you are running a business or a side hustle, the D/E ratio helps you decide how to fund your next move. Should you take on a partner (Equity) or take out a bank loan (Debt)? By monitoring your D/E ratio, you can ensure you remain attractive to lenders while maintaining enough control over your business. Most banks have specific D/E requirements for business loans; staying within these bounds is essential for maintaining access to credit.
Conclusion: The Vital Role of D/E in Financial Literacy
The Debt-to-Equity ratio is a cornerstone of financial analysis within the “Money” niche. It offers a window into the soul of a company’s financial strategy, revealing its appetite for risk, its operational efficiency, and its long-term viability. By understanding what the D/E ratio measures—and what it doesn’t—investors and business owners can make more informed, data-driven decisions.
Ultimately, the goal is balance. Whether in personal finance or corporate boardrooms, the objective is to use leverage as a tool for progress without allowing it to become a weight that pulls the enterprise under. By keeping a close eye on the D/E ratio, you can navigate the complex waters of the financial world with greater confidence and insight.
aViewFromTheCave is a participant in the Amazon Services LLC Associates Program, an affiliate advertising program designed to provide a means for sites to earn advertising fees by advertising and linking to Amazon.com. Amazon, the Amazon logo, AmazonSupply, and the AmazonSupply logo are trademarks of Amazon.com, Inc. or its affiliates. As an Amazon Associate we earn affiliate commissions from qualifying purchases.