Spectrometers are fascinating instruments that unlock the secrets hidden within light. While the word itself might sound complex, the core function of a spectrometer is elegantly simple: to separate light into its constituent wavelengths, much like a prism splits white light into a rainbow. This ability to analyze the spectral signature of light makes spectrometers indispensable tools across a vast array of scientific, industrial, and technological fields. From identifying unknown substances to monitoring environmental pollution and even aiding in the development of cutting-edge materials, spectrometers are the unsung heroes of modern innovation.
At its heart, a spectrometer works by interacting with electromagnetic radiation, most commonly visible light, but also extending into ultraviolet, infrared, and even X-ray regions of the spectrum. When radiation encounters matter, it can be absorbed, transmitted, reflected, or emitted. The specific wavelengths of radiation that interact with a sample in these ways are unique to the chemical composition and physical state of that sample. A spectrometer captures this interaction and translates it into a spectrum – a graph that plots the intensity of radiation against its wavelength. This spectral fingerprint then provides a wealth of information that scientists and engineers can interpret.

The fundamental principle behind spectrometry is the interaction of light with matter, governed by the laws of quantum mechanics and electromagnetism. Different atoms and molecules possess unique energy levels. When light of a specific wavelength (and therefore energy) interacts with these atoms or molecules, it can cause electrons to jump to higher energy levels (absorption) or fall back to lower energy levels, emitting photons of specific wavelengths (emission). By measuring which wavelengths are absorbed or emitted, we can deduce the identity and concentration of the substances present.
The Fundamental Components and Operation of a Spectrometer
To understand what a spectrometer does, it’s crucial to appreciate its internal workings. While designs can vary significantly depending on the specific application and the type of electromagnetic radiation being analyzed, most spectrometers share a common set of core components. These components work in concert to capture light, disperse it, and detect the resulting spectrum.
Light Source and Sample Interaction
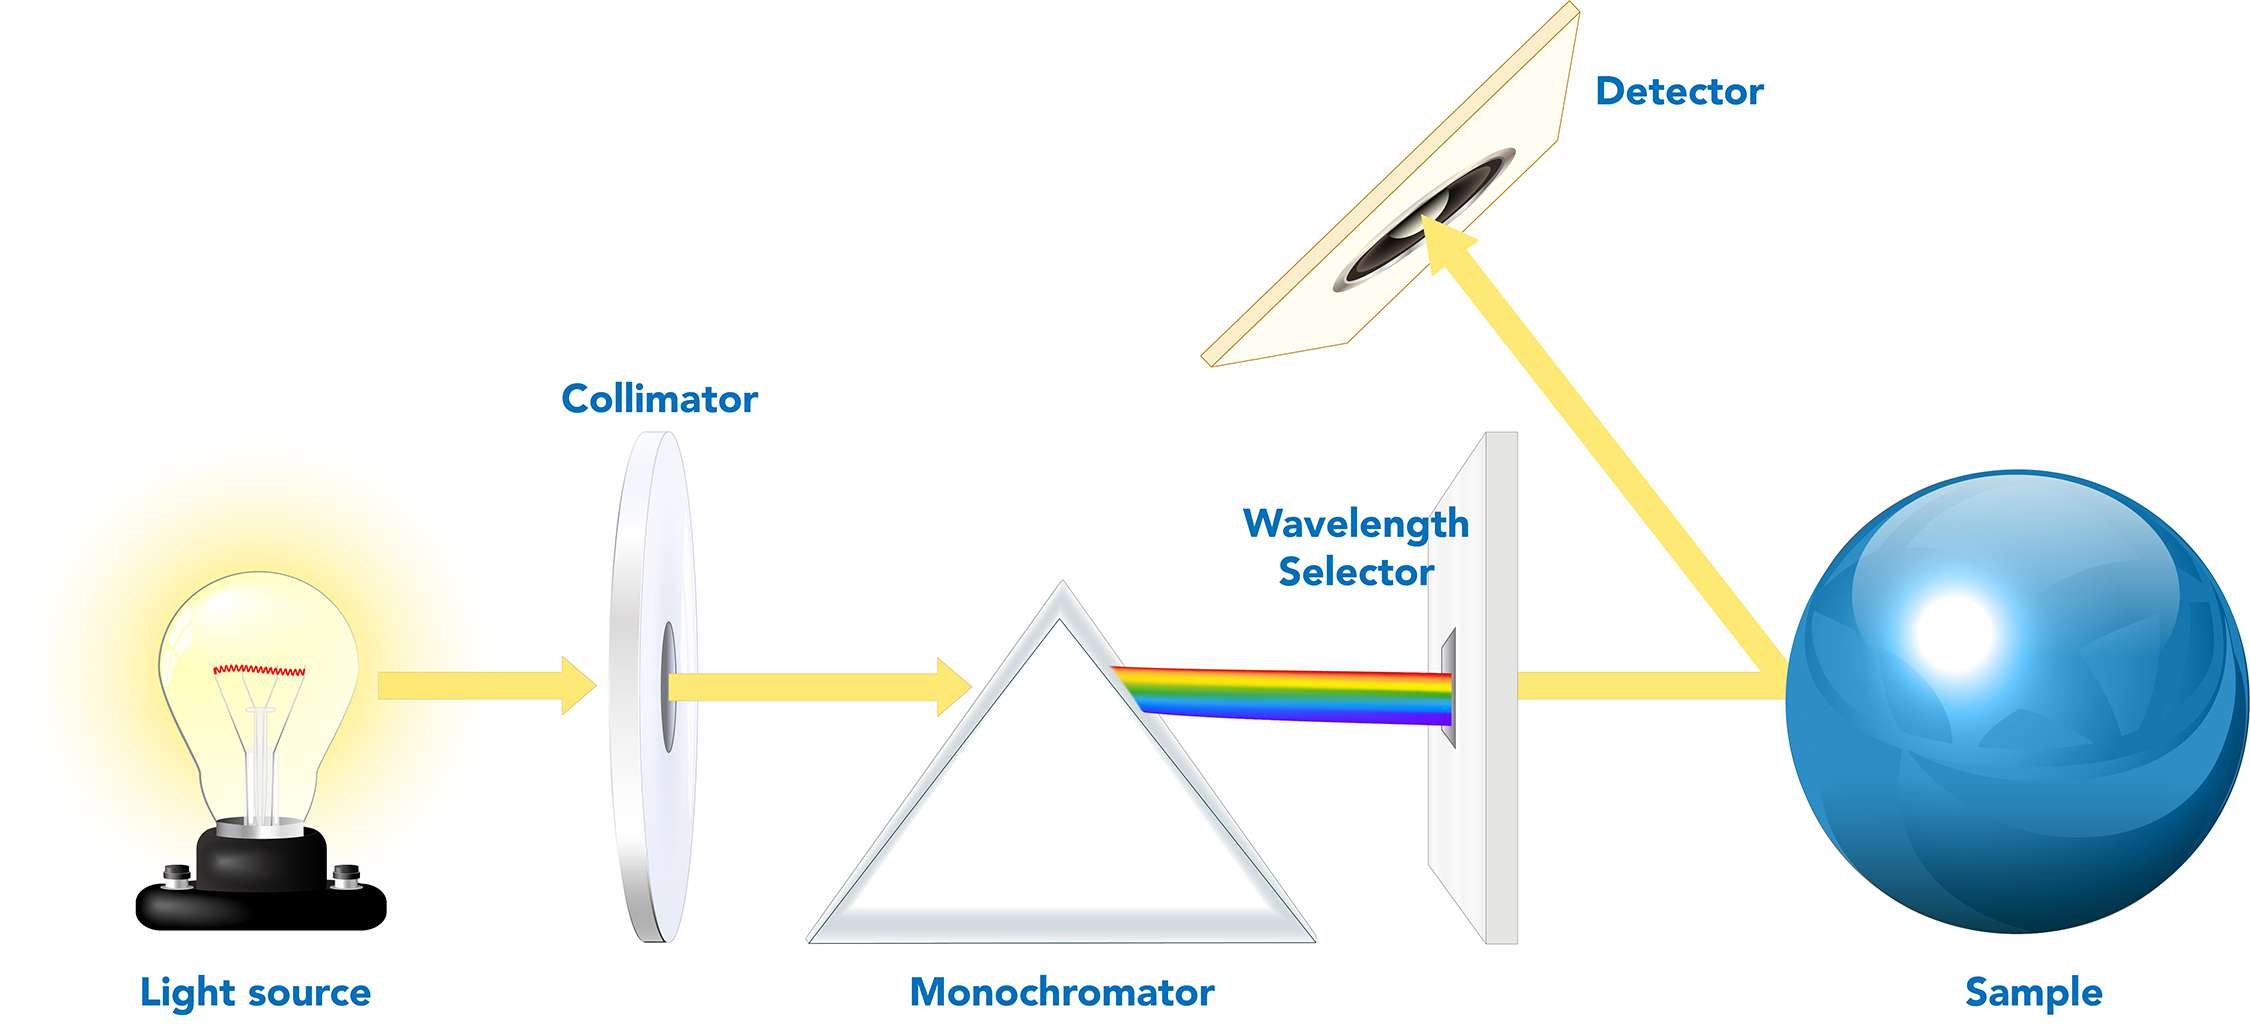
The journey of analysis begins with a light source. This source emits electromagnetic radiation that is directed towards the sample being studied. The nature of the light source is critical and depends on the spectral range of interest. For visible light analysis, a tungsten filament lamp or a LED might be used. For UV spectroscopy, deuterium lamps are common, while for infrared analysis, specialized thermal emitters are employed.
As the radiation interacts with the sample, several phenomena can occur. Absorption is a primary mechanism, where the sample absorbs specific wavelengths of light. This absorbed energy can cause molecular vibrations or electronic transitions within the sample’s atoms and molecules. Transmission occurs when light passes through the sample, with certain wavelengths being attenuated more than others due to absorption. Emission is another vital process, where the sample itself emits light, often after being excited by an external energy source (like a laser or an electric current). This is the principle behind techniques like fluorescence spectroscopy. Reflection and Scattering are also important, where light bounces off the surface of a sample or is deflected in various directions, respectively. The spectrometer is designed to capture and analyze the light that results from these interactions.
Wavelength Dispersion: The Heart of Separation
Once the light has interacted with the sample, it contains information encoded in its spectral content. The next crucial step is to separate this light into its individual wavelengths. This is achieved by a wavelength-dispersing element, the “heart” of any spectrometer. The two most common types of dispersing elements are prisms and diffraction gratings.
A prism, typically made of glass or quartz, works based on the principle of refraction. Different wavelengths of light are bent at slightly different angles as they pass through the prism. White light, for instance, is composed of all visible wavelengths; as it enters a prism, each wavelength is refracted at a unique angle, spreading the light out into a spectrum of colors.
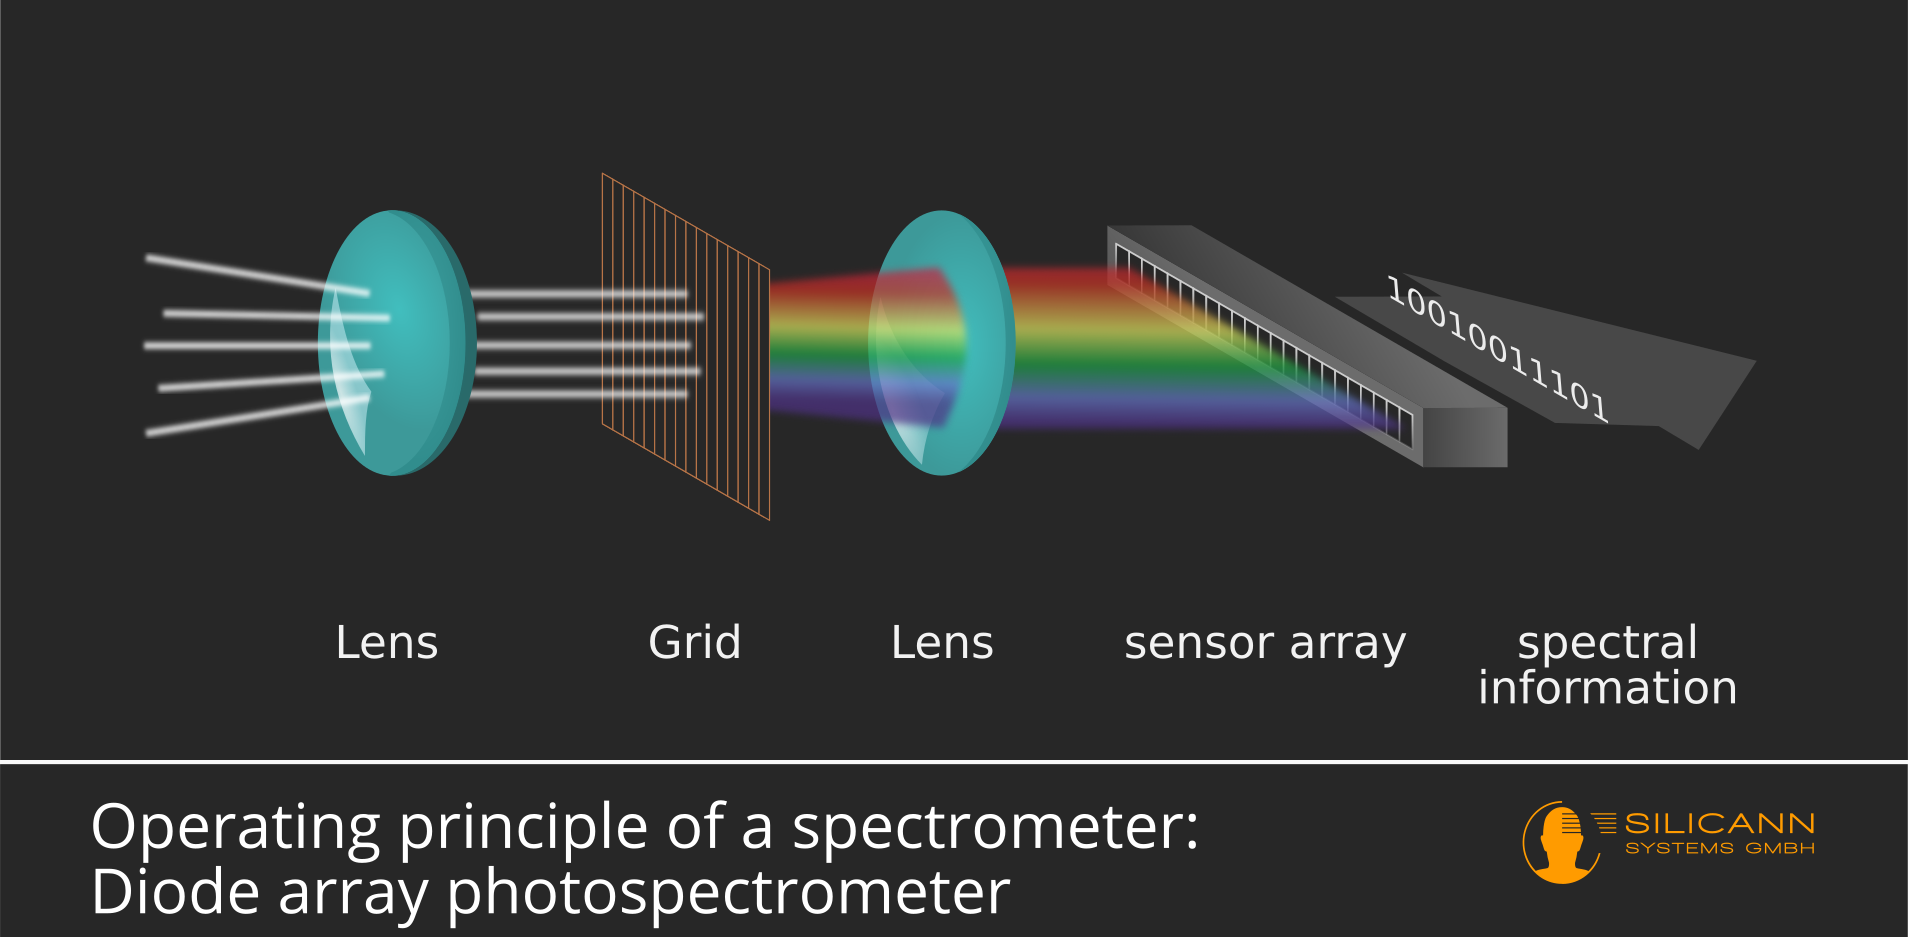
A diffraction grating is a more versatile and often more precise dispersing element. It consists of a surface with thousands of parallel, closely spaced lines. When light strikes a diffraction grating, it is diffracted. Similar to wave interference, the light waves at different angles constructively and destructively interfere. This interference pattern causes different wavelengths of light to be directed at different angles, effectively separating them. Diffraction gratings are often preferred for their higher resolution and ability to be used across a wider range of wavelengths compared to prisms.
Detection: Capturing the Spectral Data
The separated wavelengths of light then fall onto a detector. The detector’s role is to measure the intensity of light at each specific wavelength. Again, the type of detector employed is highly dependent on the spectral range being analyzed and the sensitivity required.
For visible and near-infrared regions, photodiodes and Charge-Coupled Devices (CCDs) are common. CCDs, similar to those used in digital cameras, are arrays of pixels that convert incoming photons into electrical signals. This allows for simultaneous detection of multiple wavelengths, leading to faster acquisition times. For ultraviolet light, photomultiplier tubes (PMTs) or silicon photodiodes are often used. For infrared spectroscopy, specialized detectors like thermopiles, bolometers, or Mercury Cadmium Telluride (MCT) detectors are employed, as these materials are sensitive to the lower energy photons in the infrared spectrum.
The electrical signals generated by the detector are then processed by electronics and typically converted into digital data. This data is then sent to a computer for analysis and visualization, where it is often presented as a graph – the spectrum.
The Diverse Applications of Spectrometry in Technology
The ability to precisely analyze light has propelled spectrometry into a cornerstone technology across numerous industries. Its applications are so pervasive that it’s difficult to imagine modern science and technology without it. From the mundane to the highly sophisticated, spectrometers are working behind the scenes to ensure quality, drive innovation, and deepen our understanding of the universe.
Material Science and Quality Control
One of the most significant contributions of spectrometers is in the realm of material science and quality control. Spectrometers can rapidly and non-destructively identify the elemental and molecular composition of substances. This is critical for ensuring that materials meet precise specifications.
In manufacturing, spectrometers are used to verify the composition of raw materials and finished products. For instance, in the production of plastics, a spectrometer can confirm that the correct additives are present in the right proportions. In the pharmaceutical industry, they are essential for identifying active pharmaceutical ingredients, detecting impurities, and ensuring the consistency of drug formulations. This is crucial for patient safety and regulatory compliance. Metallurgy relies heavily on spectrometers to analyze the composition of alloys, ensuring they have the desired strength, conductivity, or corrosion resistance. By analyzing the light emitted or absorbed by a metal sample, its elemental makeup can be determined with remarkable accuracy.
Furthermore, forensics utilizes spectrometry for identifying unknown substances found at crime scenes, such as explosives, drugs, or trace evidence. The unique spectral fingerprint of a substance can be a crucial piece of evidence in criminal investigations. In the field of art conservation, spectrometers can help identify pigments used in historical artworks without damaging the delicate surfaces, aiding in restoration efforts and authentication.
Environmental Monitoring and Analysis
The environmental impact of human activities is a growing concern, and spectrometers play a vital role in monitoring and mitigating these effects. Their ability to detect and quantify specific substances, even at very low concentrations, makes them indispensable for environmental protection.
In air quality monitoring, spectrometers can detect and measure various pollutants, such as nitrogen oxides (NOx), sulfur dioxide (SO2), ozone (O3), and volatile organic compounds (VOCs). This data is crucial for assessing the health risks associated with air pollution and for developing strategies to reduce emissions. For example, Fourier-transform infrared (FTIR) spectrometers are commonly used for continuous monitoring of industrial emissions.
Water quality analysis also benefits immensely from spectrometry. Spectrometers can be used to detect and quantify a wide range of contaminants in water, including heavy metals, nitrates, phosphates, and organic pollutants. This is vital for ensuring the safety of drinking water and for monitoring the health of aquatic ecosystems. For instance, atomic absorption spectroscopy (AAS) is a powerful technique for measuring trace levels of metals in water.
Moreover, spectrometers are employed in remote sensing applications, such as analyzing the spectral signatures of the Earth’s surface from satellites or aircraft. This allows scientists to monitor deforestation, track the spread of wildfires, assess crop health, and study climate change by analyzing the absorption and reflection of sunlight by different materials. The spectral data can reveal information about the chlorophyll content in vegetation, the mineral composition of soils, and the presence of atmospheric aerosols.
Research and Development in Advanced Technologies
Spectrometry is not just about analysis; it’s a powerful tool for discovery and innovation, driving forward research and development in many cutting-edge fields.
In astronomy, spectrometers are used to analyze the light from distant stars, galaxies, and nebulae. By examining the spectral lines, astronomers can determine the chemical composition, temperature, velocity, and even the magnetic field of celestial objects. This information is fundamental to our understanding of the universe, from the formation of stars to the nature of dark matter. For example, the redshift of spectral lines provides evidence for the expansion of the universe.
In the field of semiconductor manufacturing, spectrometers are used to characterize thin films and monitor the etching processes involved in creating microchips. The precise control over material properties at the nanoscale is critical for the performance of modern electronics. Techniques like ellipsometry, which is closely related to spectrometry, are used to measure the thickness and optical properties of these thin films.
The development of new materials is also heavily reliant on spectrometry. Researchers use it to understand the electronic and optical properties of novel compounds, such as those used in solar cells, LEDs, and advanced sensors. By analyzing how these materials interact with light, scientists can optimize their design and performance. For instance, Raman spectroscopy is often used to identify molecular vibrations and study the structural properties of nanomaterials.
Furthermore, in biotechnology and medicine, spectrometers are used for a multitude of purposes. DNA sequencing utilizes spectrographic techniques to identify the fluorescently labeled bases. Medical diagnostics employ spectroscopy for non-invasive imaging and analysis of tissues, aiding in the detection of diseases like cancer. For example, near-infrared spectroscopy (NIRS) is used to monitor blood oxygenation and tissue perfusion non-invasively.
The Future of Spectrometry: Miniaturization and Artificial Intelligence
The evolution of spectrometry is far from over. As technology advances, we are witnessing a trend towards smaller, more portable, and more intelligent spectrometers, opening up even more possibilities for their application.
Miniaturization and Ubiquitous Sensing
One of the most significant recent developments in spectrometry is miniaturization. Traditionally, spectrometers have been relatively large, complex, and expensive laboratory instruments. However, advances in micro-optics, integrated photonics, and sensor technology are leading to the development of handheld and even wearable spectrometers.
These miniaturized spectrometers are revolutionizing fields that require on-site, real-time analysis. Imagine a farmer using a handheld spectrometer to assess the nutrient content of soil or the ripeness of fruit directly in the field. Consider a first responder equipped with a device capable of quickly identifying hazardous chemicals. In the realm of consumer electronics, we are starting to see the integration of spectral sensors into smartphones, allowing for applications like personalized skin analysis or the identification of food ingredients.
This trend towards ubiquitous sensing means that spectral analysis will become more accessible and integrated into our daily lives. It democratizes access to powerful analytical capabilities, enabling a wider range of users and applications. This miniaturization is achieved through the use of micro-electromechanical systems (MEMS) components, advanced integrated optics, and highly sensitive micro-detectors, all packaged into compact and robust devices.
The Role of Artificial Intelligence and Machine Learning
As spectrometers become more prevalent and generate vast amounts of spectral data, the integration of Artificial Intelligence (AI) and Machine Learning (ML) is becoming increasingly crucial. Raw spectral data can be complex and challenging to interpret manually, especially when dealing with subtle variations or unknown substances. AI and ML algorithms can process and analyze this data far more efficiently and accurately than traditional methods.
Pattern recognition is a key area where AI excels. ML models can be trained on large datasets of known spectra to identify specific compounds, classify materials, or detect anomalies with remarkable speed and precision. This is particularly valuable in applications like medical diagnostics, where subtle spectral changes might indicate the presence of disease, or in industrial quality control, where deviations from expected spectral profiles can signal a production issue.
Predictive analytics is another powerful application. By analyzing historical spectral data, AI can help predict trends, forecast potential problems, or optimize processes. For instance, in agriculture, spectral analysis combined with AI could help predict crop yields or identify the early signs of disease outbreaks. In environmental monitoring, AI could be used to forecast pollution levels based on real-time spectral measurements.
Furthermore, AI can assist in the development of new spectrometer designs and analytical techniques. By simulating and optimizing optical pathways or detector configurations, AI can accelerate the innovation cycle in spectrometer technology itself. The combination of increasingly sophisticated hardware and intelligent software promises to unlock new frontiers in our ability to understand and interact with the world around us through the analysis of light.
aViewFromTheCave is a participant in the Amazon Services LLC Associates Program, an affiliate advertising program designed to provide a means for sites to earn advertising fees by advertising and linking to Amazon.com. Amazon, the Amazon logo, AmazonSupply, and the AmazonSupply logo are trademarks of Amazon.com, Inc. or its affiliates. As an Amazon Associate we earn affiliate commissions from qualifying purchases.