The intersection of medicine and advanced computation has transformed the way we understand the human body. Nowhere is this more evident than in the field of diagnostic imaging, specifically Magnetic Resonance Imaging (MRI). When a patient asks, “What does a herniated disc look like on an MRI?” they are not just asking about a medical condition; they are inquiring about a complex digital reconstruction of biological data. In the realm of modern technology, an MRI is less of a photograph and more of a sophisticated data visualization produced by high-frequency physics and advanced software algorithms.

Understanding the “look” of a herniated disc requires a deep dive into the technology that captures it. From the superconducting magnets that align subatomic particles to the AI-driven software that highlights nerve impingement, the visualization of a spinal injury is a triumph of digital engineering.
The Physics of the Frame: How MRI Technology Captures Spinal Integrity
To understand what a herniated disc looks like on a screen, one must first understand the hardware and software protocols that generate the image. Unlike X-rays, which use ionizing radiation to capture bone density, MRI technology utilizes the behavior of hydrogen protons in the body’s water molecules.
Proton Alignment and Radiofrequency Pulses
The MRI scanner is essentially a massive, high-powered magnet (measured in Tesla units, typically 1.5T or 3.0T). When a patient enters the bore, the magnetic field aligns the spins of hydrogen protons in their spinal tissues. The technology then introduces a radiofrequency (RF) pulse that knocks these protons out of alignment. As the protons “relax” back into their original state, they emit energy signals.
Sophisticated sensors capture these signals, and a process known as the Fourier Transform—a cornerstone of digital signal processing—converts this raw data into the pixels that form the cross-sectional images of the spine. On the monitor, the disc appears not as a solid object, but as a gradient of signal intensities.
Resolution and Slice Thickness: T1 vs. T2 Weighting
In the tech world, we often discuss “resolution” in terms of megapixels or 4K displays. In MRI technology, resolution is determined by “slice thickness” and “pulse sequences.” To visualize a herniated disc, radiologists use different “filters” or sequences:
- T1-Weighted Images: These are excellent for viewing the anatomy of the spinal cord and the fat within the vertebrae. In a T1 sequence, the disc typically appears darker and provides high-contrast “mapping” of the spinal structure.
- T2-Weighted Images: These are the “gold standard” for identifying pathology. Because T2 sequences make water and fluid (like cerebrospinal fluid) appear bright white, a herniated disc—which often involves the leakage of the gel-like nucleus pulposus—is highlighted against the dark background of the outer disc ring.
Identifying the Anomaly: Digital Signatures of a Herniated Disc
When looking at the digital output, a healthy intervertebral disc resembles a symmetrical, well-contained oval between two vertebrae. On an MRI, a herniated disc presents as a specific “digital signature” or an architectural deviation from this symmetry.
Pixel Intensity and the “Bulge” Protocol
The most recognizable feature of a herniated disc on an MRI is the “out-pouching” of material. In technical terms, this is a change in the boundary detection of the disc’s edge. On a T2-weighted image, the center of the disc (the nucleus) should be bright, indicating high hydration. A herniated or “dark” disc often signifies “black disc disease” or desiccation, where the tech-detected signal intensity drops because the disc has lost its water content.
When the inner material escapes through a tear in the annulus fibrosus, the MRI captures a “protrusion” or “extrusion.” On the screen, this looks like a dark, localized mass encroaching into the bright, white space of the spinal canal. Software tools allow clinicians to measure this encroachment down to the millimeter, providing a data-driven assessment of how much the disc is compressing surrounding structures.
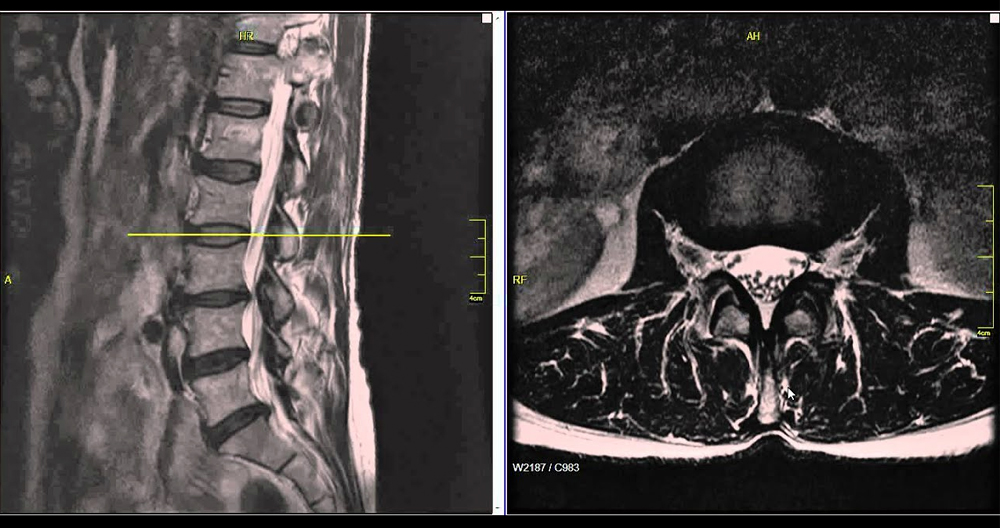
The Sagittal and Axial Views: 3D Mapping of the Nerve Root
To get a full “3D” understanding of the injury, the software generates images in multiple planes.
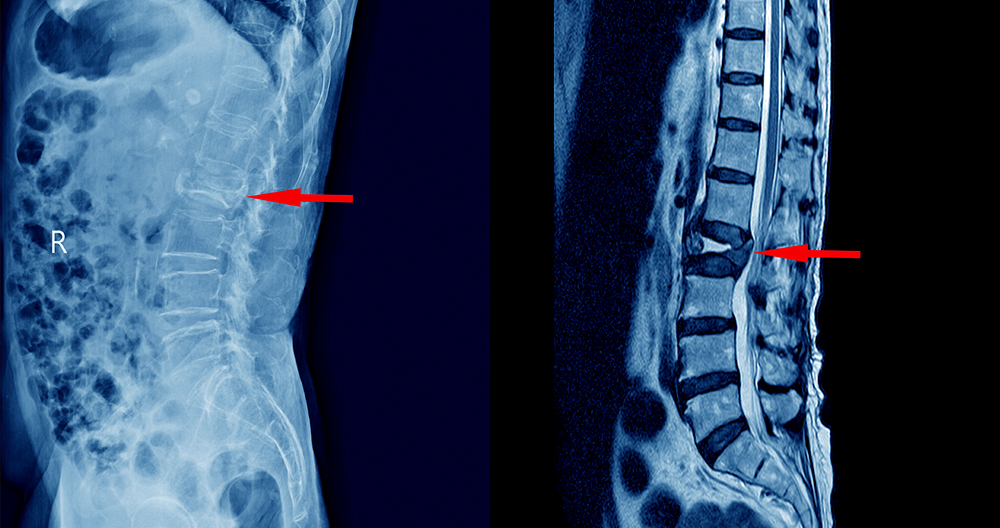
- Sagittal View (Side Profile): This tech-view allows the viewer to see the entire vertical stack of the spine. A herniation looks like a “bead” or “button” of dark material pushing backward into the spinal canal.
- Axial View (Bird’s Eye): This view provides a cross-section of a single disc. It is here that the technology most clearly demonstrates nerve impingement. The “thecal sac” (which contains the nerves) is a circular white area; a herniation appears as a dark indentation into that circle, often looking like a “bite” taken out of the nerve space.
AI and Machine Learning: Automating Disc Detection
The future of interpreting what a herniated disc looks like lies in Artificial Intelligence (AI) and Machine Learning (ML). As the volume of medical imaging data grows, the tech industry has stepped in to provide automated diagnostic tools that can assist radiologists in identifying subtle spinal shifts.
Computer-Aided Detection (CAD) Systems
Modern radiology workstations are now integrated with CAD systems. These software suites use pattern recognition algorithms to scan thousands of “slices” in seconds. By comparing a patient’s scan against a database of millions of labeled “healthy” vs. “herniated” images, the AI can flag potential herniations with a high degree of accuracy. For the technologist, the software places a digital “bounding box” around the area of concern, ensuring that even minor protrusions are not overlooked during a manual review.
Deep Learning Models in Radiomics
We are currently seeing a shift toward “Radiomics”—the extraction of large amounts of quantitative data from medical images. Instead of a human simply saying “that looks like a herniation,” deep learning models can analyze the texture, pixel distribution, and edge gradients of the disc. These tools can predict the “age” of a herniation or the likelihood that it will respond to conservative treatment based on its digital density and signal-to-noise ratio. This transition from “qualitative” viewing to “quantitative” data analysis is the next frontier in medical tech.
The Future of Medical Visualization: From 2D Slices to Immersive Tech
As we move beyond traditional flat monitors, the visualization of spinal pathology is entering the world of immersive technology and ultra-high-definition imaging.
Augmented Reality (AR) in Surgical Planning
One of the most exciting trends in the tech space is the use of MRI data to create 3D holographic models. Using software like Unity or specialized medical engines, engineers can convert the 2D slices of an MRI into a 3D volume. Surgeons can then wear AR headsets (like the Microsoft HoloLens or Apple Vision Pro) to “see” the herniated disc inside the patient’s body before making an incision. The “look” of the herniated disc in this context is a translucent, 3D object that can be rotated, scaled, and navigated in real-time.
High-Field MRI (7T) and Granular Diagnostics
The “next gen” of hardware is the 7-Tesla (7T) MRI. Most current clinical MRIs are 1.5T or 3T. The 7T scanners, which are currently moving from research labs to specialized clinics, provide a signal-to-noise ratio that is exponentially higher. This allows for “ultra-high-resolution” imaging where the microscopic fibers of the disc’s outer ring can be seen. At this level of tech, a herniated disc doesn’t just look like a “bulge”; it looks like a complex structural failure, showing every micro-tear and individual nerve filament involved.
The Digital Integration of Spine Health
When we answer the question of what a herniated disc looks like on an MRI, we are describing a sophisticated digital reconstruction. It is the result of high-end hardware (superconducting magnets), precision physics (RF pulses), and cutting-edge software (AI and 3D rendering).
The technology has moved far beyond simple “pictures.” Today, a herniated disc on an MRI is a data point in a larger ecosystem of digital health. It is a map used for robotic surgeries, a dataset for machine learning models, and a high-resolution visualization that allows for unprecedented diagnostic accuracy. As MRI technology continues to evolve—moving toward faster scan times, higher resolutions, and AI-integrated interpretation—the “look” of pathology will become even clearer, allowing for faster interventions and better patient outcomes through the power of technology.
aViewFromTheCave is a participant in the Amazon Services LLC Associates Program, an affiliate advertising program designed to provide a means for sites to earn advertising fees by advertising and linking to Amazon.com. Amazon, the Amazon logo, AmazonSupply, and the AmazonSupply logo are trademarks of Amazon.com, Inc. or its affiliates. As an Amazon Associate we earn affiliate commissions from qualifying purchases.