The intersection of medical science and high-end technology has transformed the way we visualize the human body’s internal landscape. Among the most critical applications of this synergy is the use of ultrasound technology to detect carotid artery disease. When we ask, “What does a blocked carotid artery look like on ultrasound?” we are not merely asking for a visual description; we are diving into a complex world of signal processing, fluid dynamics software, and high-frequency acoustic engineering.
For the modern tech enthusiast or healthcare professional, understanding this visualization is an exercise in appreciating how hardware and software collaborate to render invisible threats visible. This article explores the technological architecture behind carotid ultrasounds, the digital manifestations of arterial blockages, and the emerging AI tools that are redefining diagnostic accuracy.

The Physics of Sound: How Ultrasound Hardware Visualizes Vascular Obstruction
At its core, an ultrasound machine is a highly sophisticated data acquisition and processing unit. To visualize a blocked carotid artery, the technology relies on the principles of high-frequency sound waves—far beyond the range of human hearing—and their interactions with various tissue densities.
Piezoelectric Transducers and Signal Acquisition
The journey begins at the transducer, the handheld probe used by the sonographer. This device contains piezoelectric crystals that function as both transmitters and receivers. When an electric current is applied, these crystals vibrate, sending ultrasonic pulses into the neck. As these waves hit different structures—skin, muscle, vessel walls, and blood—they bounce back.
The technology’s ability to distinguish a “blocked” artery depends on the sensitivity of these crystals. A healthy artery wall appears as a smooth, distinct line, while a blockage—often composed of calcified plaque—reflects sound waves differently. The hardware must be capable of distinguishing between “hyperechoic” (bright) signals, which indicate hard, calcified plaque, and “hypoechoic” (dark) signals, which might indicate softer, more dangerous fatty deposits.
B-Mode Imaging: Mapping the Architecture of Plaque
B-Mode, or Brightness Mode, is the foundational software layer of a carotid ultrasound. It converts the intensity of the returning echoes into a 2D grayscale image. On a high-resolution display, a blocked carotid artery reveals itself as an intrusion into the “lumen,” or the open channel of the vessel.
Engineers have developed sophisticated edge-detection algorithms that allow the software to trace the boundaries of these blockages. A significant technological hurdle in B-mode imaging is “speckle reduction.” This is a digital filtering process that removes the graininess inherent in acoustic imaging, allowing for a crisp visualization of the plaque’s surface. Is the plaque smooth, or is it “ulcerated” (craggy and unstable)? The tech’s ability to render these textures is vital, as irregular surfaces are more likely to trigger a stroke.
Doppler Technology: Visualizing Fluid Dynamics and Velocity Shifts
Visualizing the blockage itself is only half the battle. To understand the severity of a blockage, the technology must analyze the movement of blood. This is achieved through Doppler Shift technology, a marvel of real-time physics and digital signal processing (DSP).
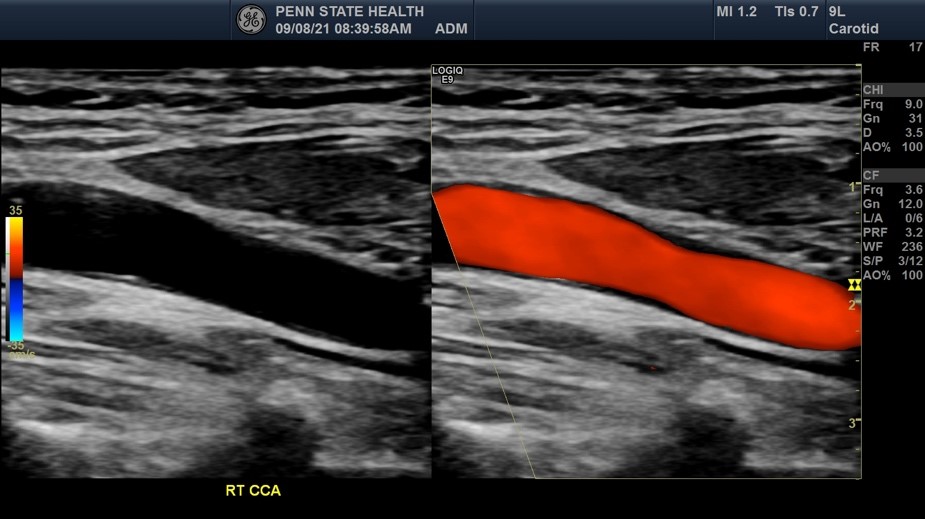
Color Doppler: The Spectrum of Turbulence
Color Doppler is the software overlay that provides a “heat map” of blood flow. By calculating the change in frequency of sound waves bouncing off moving red blood cells, the system assigns colors based on direction and speed. Typically, red represents flow toward the probe, and blue represents flow away.
In a healthy carotid artery, the color is uniform and steady. However, when the technology encounters a blockage, the “look” of the ultrasound changes dramatically. Because the blood must squeeze through a narrower opening, it speeds up—a phenomenon known as the Venturi effect. On the screen, this appears as “aliasing” or a mosaic of colors. Instead of a smooth red or blue, the tech displays a chaotic mix of bright yellows and greens, signaling high-velocity turbulence. This digital visual is the primary indicator that the hardware has detected a significant narrowing (stenosis).
Spectral Doppler: Quantifying the Percentage of Blockage
While Color Doppler provides a visual map, Spectral Doppler provides the data. This technology generates a waveform—a graph of blood flow velocity over time. The software measures the “Peak Systolic Velocity” (PSV).
From a technical standpoint, the accuracy of this measurement depends on the “Doppler Angle,” a setting the operator must calibrate within the software. If the angle is off, the velocity calculation will be incorrect. Advanced ultrasound systems now include “Angle Correction” tools that use automated software to ensure the data aligns with the vessel’s geometry. When the PSV exceeds certain thresholds (e.g., 125 cm/s or 230 cm/s), the algorithms categorize the blockage into specific percentage brackets, such as 50-69% or >70% stenosis.

The AI Revolution: Enhancing Diagnostic Accuracy through Machine Learning
As we look toward the future of vascular imaging, the focus is shifting from the hardware’s ability to capture images to the software’s ability to interpret them. Artificial Intelligence (AI) and Machine Learning (ML) are becoming integrated components of the ultrasound tech stack.
Automated Plaque Characterization Algorithms
Identifying a blockage is one thing; predicting if it will break off and cause a stroke is another. Tech companies are now developing AI modules that perform “Automated Plaque Characterization.” By analyzing thousands of historical scans, these algorithms can detect patterns in the grayscale pixels that the human eye might miss.
These AI tools can quantify the “Gray Scale Median” (GSM) of a plaque. A low GSM indicates a lipid-rich, unstable blockage that looks “black” or “dark” on the screen and is highly dangerous. The integration of AI allows for a more objective, data-driven assessment, moving away from the subjective “eyeballing” of images by a human technician.
Reducing Human Error with Intelligent Edge Detection
One of the greatest challenges in ultrasound technology is “operator dependency.” The quality of the scan often depends on the skill of the person holding the probe. New software suites are addressing this by using real-time AI guidance.
These systems use intelligent edge detection to identify the carotid bulb and the bifurcation (the point where the artery splits) automatically. Once identified, the software can automatically place the Doppler sample volume in the optimal position to get the most accurate velocity reading. This “Auto-IMT” (Intima-Media Thickness) software can measure the thickness of the artery wall to a fraction of a millimeter, providing a digital early warning system for cardiovascular disease long before a major blockage forms.
Future Trends in Vascular Imaging Technology
The evolution of what a blocked carotid artery looks like on ultrasound is increasingly tied to the miniaturization of hardware and the expansion of cloud-based diagnostics.
Handheld Ultrasound Devices and Telehealth Integration
We are moving away from the era of bulky, refrigerator-sized ultrasound machines. Companies like Butterfly Network and Philips have developed “Ultrasound-on-a-Chip” technology. These handheld probes connect directly to a smartphone or tablet, utilizing the mobile device’s CPU and GPU to process the imaging data.
In this context, the “look” of a blocked artery becomes accessible in a primary care setting or even a remote clinic. The data is instantly uploaded to the cloud, where remote specialists can use collaborative software to review the scan in real-time. This democratization of technology ensures that the visualization of arterial health is no longer confined to high-end radiology suites.
3D/4D Reconstruction and Virtual Reality Diagnostics
Traditional ultrasound provides a 2D slice of a 3D vessel. However, modern high-end software can now perform “3D Reconstruction.” By stitching together multiple 2D slices, the computer creates a rotatable, volumetric model of the carotid artery.
When a blockage is viewed in 3D, its topography becomes much clearer. Surgeons can use Virtual Reality (VR) headsets to “fly through” the digital reconstruction of the patient’s artery, planning their intervention with a level of spatial awareness that was previously impossible. This transition from flat images to interactive 3D environments represents the next frontier in how we perceive and treat vascular disease.
Conclusion
When examining what a blocked carotid artery looks like on ultrasound, we are witnessing the pinnacle of modern signal processing and digital visualization. From the raw physics of piezoelectric transducers to the sophisticated AI algorithms that interpret blood flow turbulence, every pixel on the screen is the result of immense technological innovation.
As software continues to evolve, the clarity with which we can see these blockages—and the accuracy with which we can predict their behavior—will only improve. In the tech-driven landscape of modern medicine, the ultrasound is no longer just a camera; it is a powerful computational tool that decodes the silent signals of the human body, turning complex data into life-saving visual insights.
aViewFromTheCave is a participant in the Amazon Services LLC Associates Program, an affiliate advertising program designed to provide a means for sites to earn advertising fees by advertising and linking to Amazon.com. Amazon, the Amazon logo, AmazonSupply, and the AmazonSupply logo are trademarks of Amazon.com, Inc. or its affiliates. As an Amazon Associate we earn affiliate commissions from qualifying purchases.