
In the dynamic and data-driven world of technology, understanding performance metrics is not just beneficial; it’s crucial for success. Whether you’re developing software, managing cloud infrastructure, analyzing user behavior, or optimizing digital marketing campaigns, you’ll inevitably encounter statistical concepts that help quantify and compare performance. Among these, the concept of the “percentile” stands out as a particularly powerful tool. When you see a metric reported as being in the “90th percentile,” it signifies a significant level of performance, often indicating that a particular item or data point outperforms a vast majority of its peers. This article delves into what the 90th percentile truly means in a technological context, exploring its applications, implications, and how to interpret it effectively.
The Foundation of Percentiles: Quantifying Relative Standing
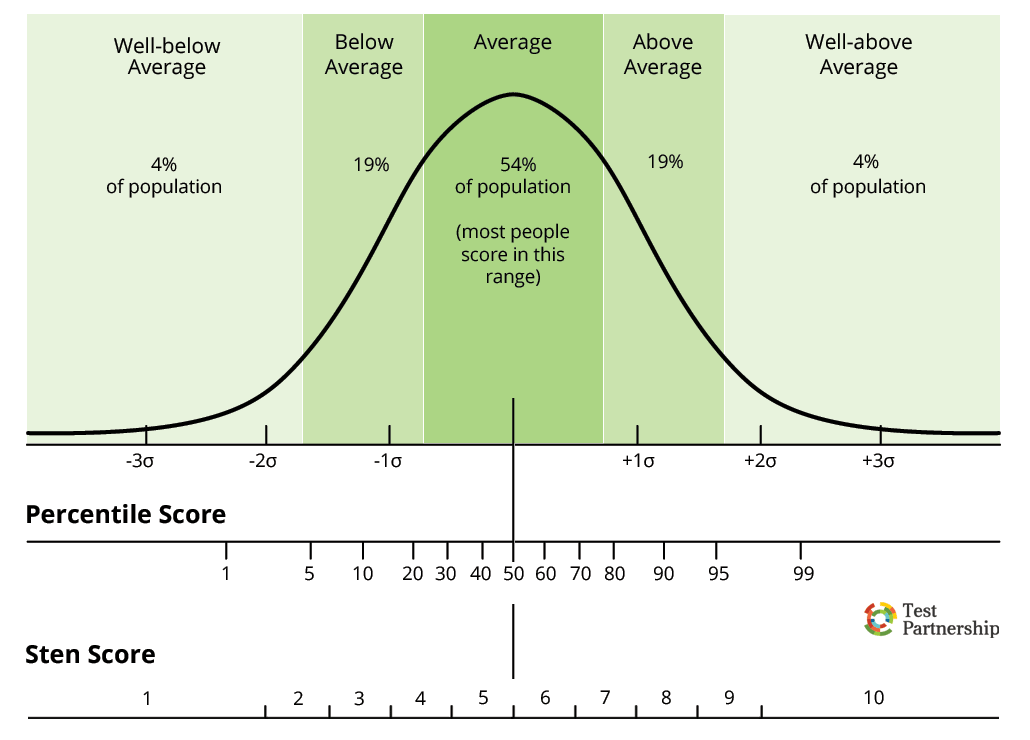
At its core, a percentile is a measure used in statistics indicating the value below which a given percentage of observations in a group of observations fall. For instance, if a score is in the 75th percentile, it means that 75% of the scores are lower than that score, and 25% are higher. This provides a relative ranking, allowing us to understand how an individual data point compares to the entire distribution of data.
Defining Percentiles: A Clearer Picture
To truly grasp the 90th percentile, let’s first solidify the understanding of percentiles in general. Imagine a dataset representing the response times of a web server over an hour. If we were to sort these response times from fastest to slowest, the 50th percentile would be the median response time – the point where half the responses were faster and half were slower. The 10th percentile would represent a very fast response time, outperforming 90% of all recorded response times. Conversely, the 90th percentile represents a response time that is slower than only 10% of all recorded response times, meaning 90% of the response times were faster than this specific value.
The Significance of the 90th Percentile: Setting Benchmarks
The 90th percentile is particularly significant because it highlights a performance level that is far above average. In technology, achieving or surpassing the 90th percentile often signifies excellence. It indicates that your system, application, or process is performing exceptionally well compared to the majority. This benchmark is frequently used to set aspirational goals, identify areas of strength, and understand where improvements are most needed. For example, if a cloud service guarantees 99.99% uptime, this reliability is often measured against a baseline that considers various failure scenarios, and achieving such high uptime means your service is performing in the upper echelons of availability metrics.
Applications of the 90th Percentile in Technology
The utility of the 90th percentile permeates various facets of the technology landscape. From software development and system performance monitoring to user experience and AI model evaluation, this metric provides invaluable insights into how systems and processes are functioning relative to their potential or to industry standards.
Performance Metrics in Software and Infrastructure
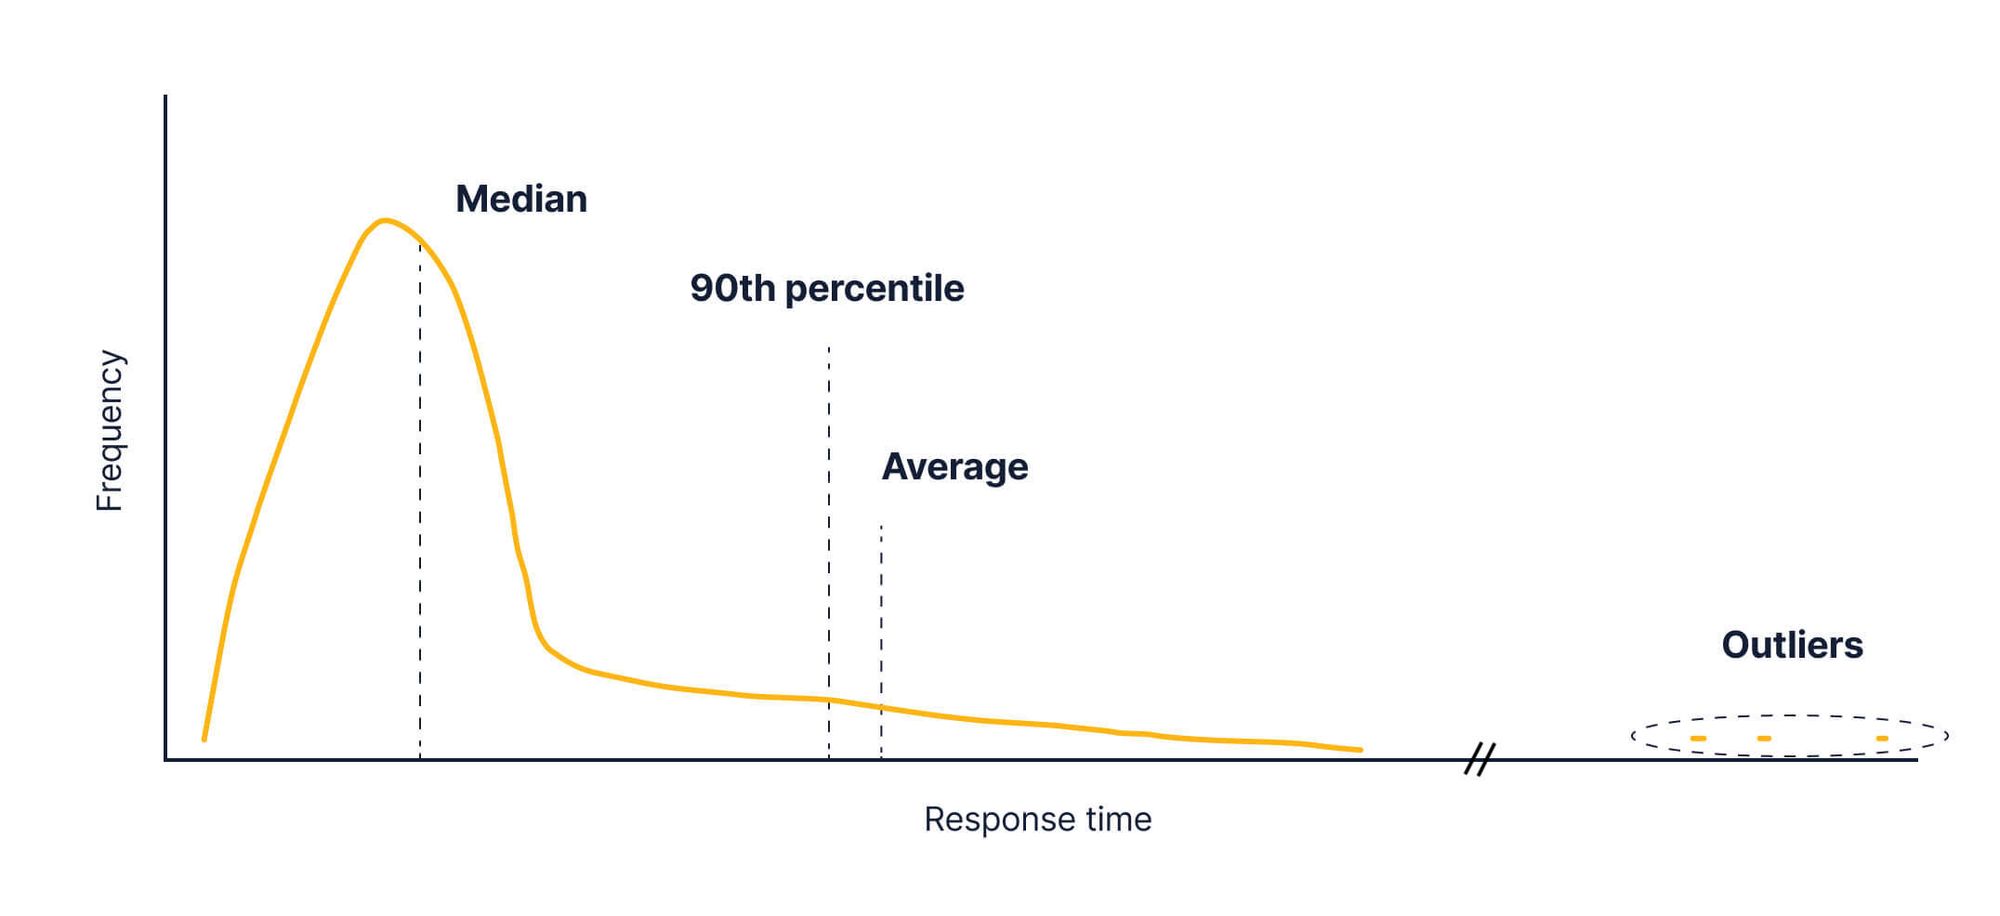
In the realm of software development and IT operations, the 90th percentile is a cornerstone for understanding performance. Latency, or response time, is a critical metric for web applications, APIs, and microservices. When developers or operations teams talk about the “90th percentile latency,” they are referring to the response time that is slower than only 10% of all requests. This means that 90% of users are experiencing response times faster than this value. This is far more insightful than looking at the average latency, which can be skewed by a few extremely fast or slow responses. For instance, if the average response time is 50ms, but the 90th percentile latency is 500ms, it indicates that while most requests are fast, a significant portion of users are experiencing a noticeably slower experience. This understanding is crucial for identifying bottlenecks, optimizing code, and ensuring a smooth user experience.
Similarly, for infrastructure like databases or network devices, metrics such as query execution time, network throughput, or disk I/O operations are often reported using percentiles. A 90th percentile query time that is well within acceptable limits suggests that the database is performing efficiently for the vast majority of queries, even accounting for occasional slower ones. This allows for proactive capacity planning and resource allocation, ensuring that systems can handle peak loads without degrading performance for most users.
User Experience and Application Responsiveness
The user experience (UX) is profoundly influenced by application responsiveness. In the context of web and mobile applications, the 90th percentile of load times or interaction times is a direct indicator of how well the application is performing for most of its users. If the 90th percentile page load time is consistently below a few seconds, it suggests a positive user experience. Conversely, if this metric creeps up, it signals potential frustration for a significant segment of the user base, prompting investigation into image optimization, code efficiency, or server-side processing.
Beyond simple load times, other user interaction metrics can also be analyzed. For example, the time it takes for a complex feature to render, or the delay between a user action and the system’s response, can be vital. By focusing on the 90th percentile, product managers and UX designers can identify and address issues that affect the majority of users, ensuring that the application remains engaging and efficient, rather than just optimizing for the few outliers.
AI Model Evaluation and Benchmarking
In the rapidly evolving field of Artificial Intelligence, the 90th percentile plays a crucial role in evaluating and benchmarking the performance of machine learning models. When assessing models for tasks like image recognition, natural language processing, or predictive analytics, accuracy is often not the sole criterion.
For instance, in object detection models, while the average precision might be high, understanding the 90th percentile of detection times is critical for real-time applications like autonomous driving or video surveillance. A model that is highly accurate but takes too long to process frames will be unusable in such scenarios. Similarly, in natural language understanding, the 90th percentile of processing time for a complex query can determine the feasibility of a chatbot’s responsiveness in a live customer service environment.
Furthermore, when comparing different AI models or algorithms, the 90th percentile can be used to establish robust benchmarks. A model that consistently achieves a higher 90th percentile performance across various datasets and tasks is generally considered more reliable and efficient for real-world deployment. This metric helps in moving beyond theoretical performance and into practical, deployment-ready capabilities.
Interpreting the 90th Percentile: Nuances and Best Practices
While the 90th percentile is a powerful indicator, its interpretation requires careful consideration to avoid missteps and ensure actionable insights. Understanding its context and comparing it with other metrics are key to deriving maximum value.
Context is King: Comparing Apples to Apples
The true meaning of the 90th percentile is always relative to the dataset and the specific metric being measured. A 90th percentile latency of 100ms for a simple API might be excellent, whereas a 90th percentile latency of 100ms for a critical financial transaction could be catastrophic. Therefore, it’s essential to compare the 90th percentile against established benchmarks, historical data, or the performance of similar systems.
For instance, in cloud computing, different service tiers will have different expected performance characteristics. A 90th percentile response time that meets the SLA (Service Level Agreement) for a particular tier is considered good. Without this context, a number by itself can be misleading. Similarly, when evaluating a new feature’s performance, comparing its 90th percentile metrics before and after deployment helps gauge the impact of changes.
Beyond the 90th: Considering Other Percentiles
While the 90th percentile offers a valuable glimpse into upper-tier performance, it’s not the only percentile that matters. Understanding other percentiles provides a more comprehensive view of the data distribution.
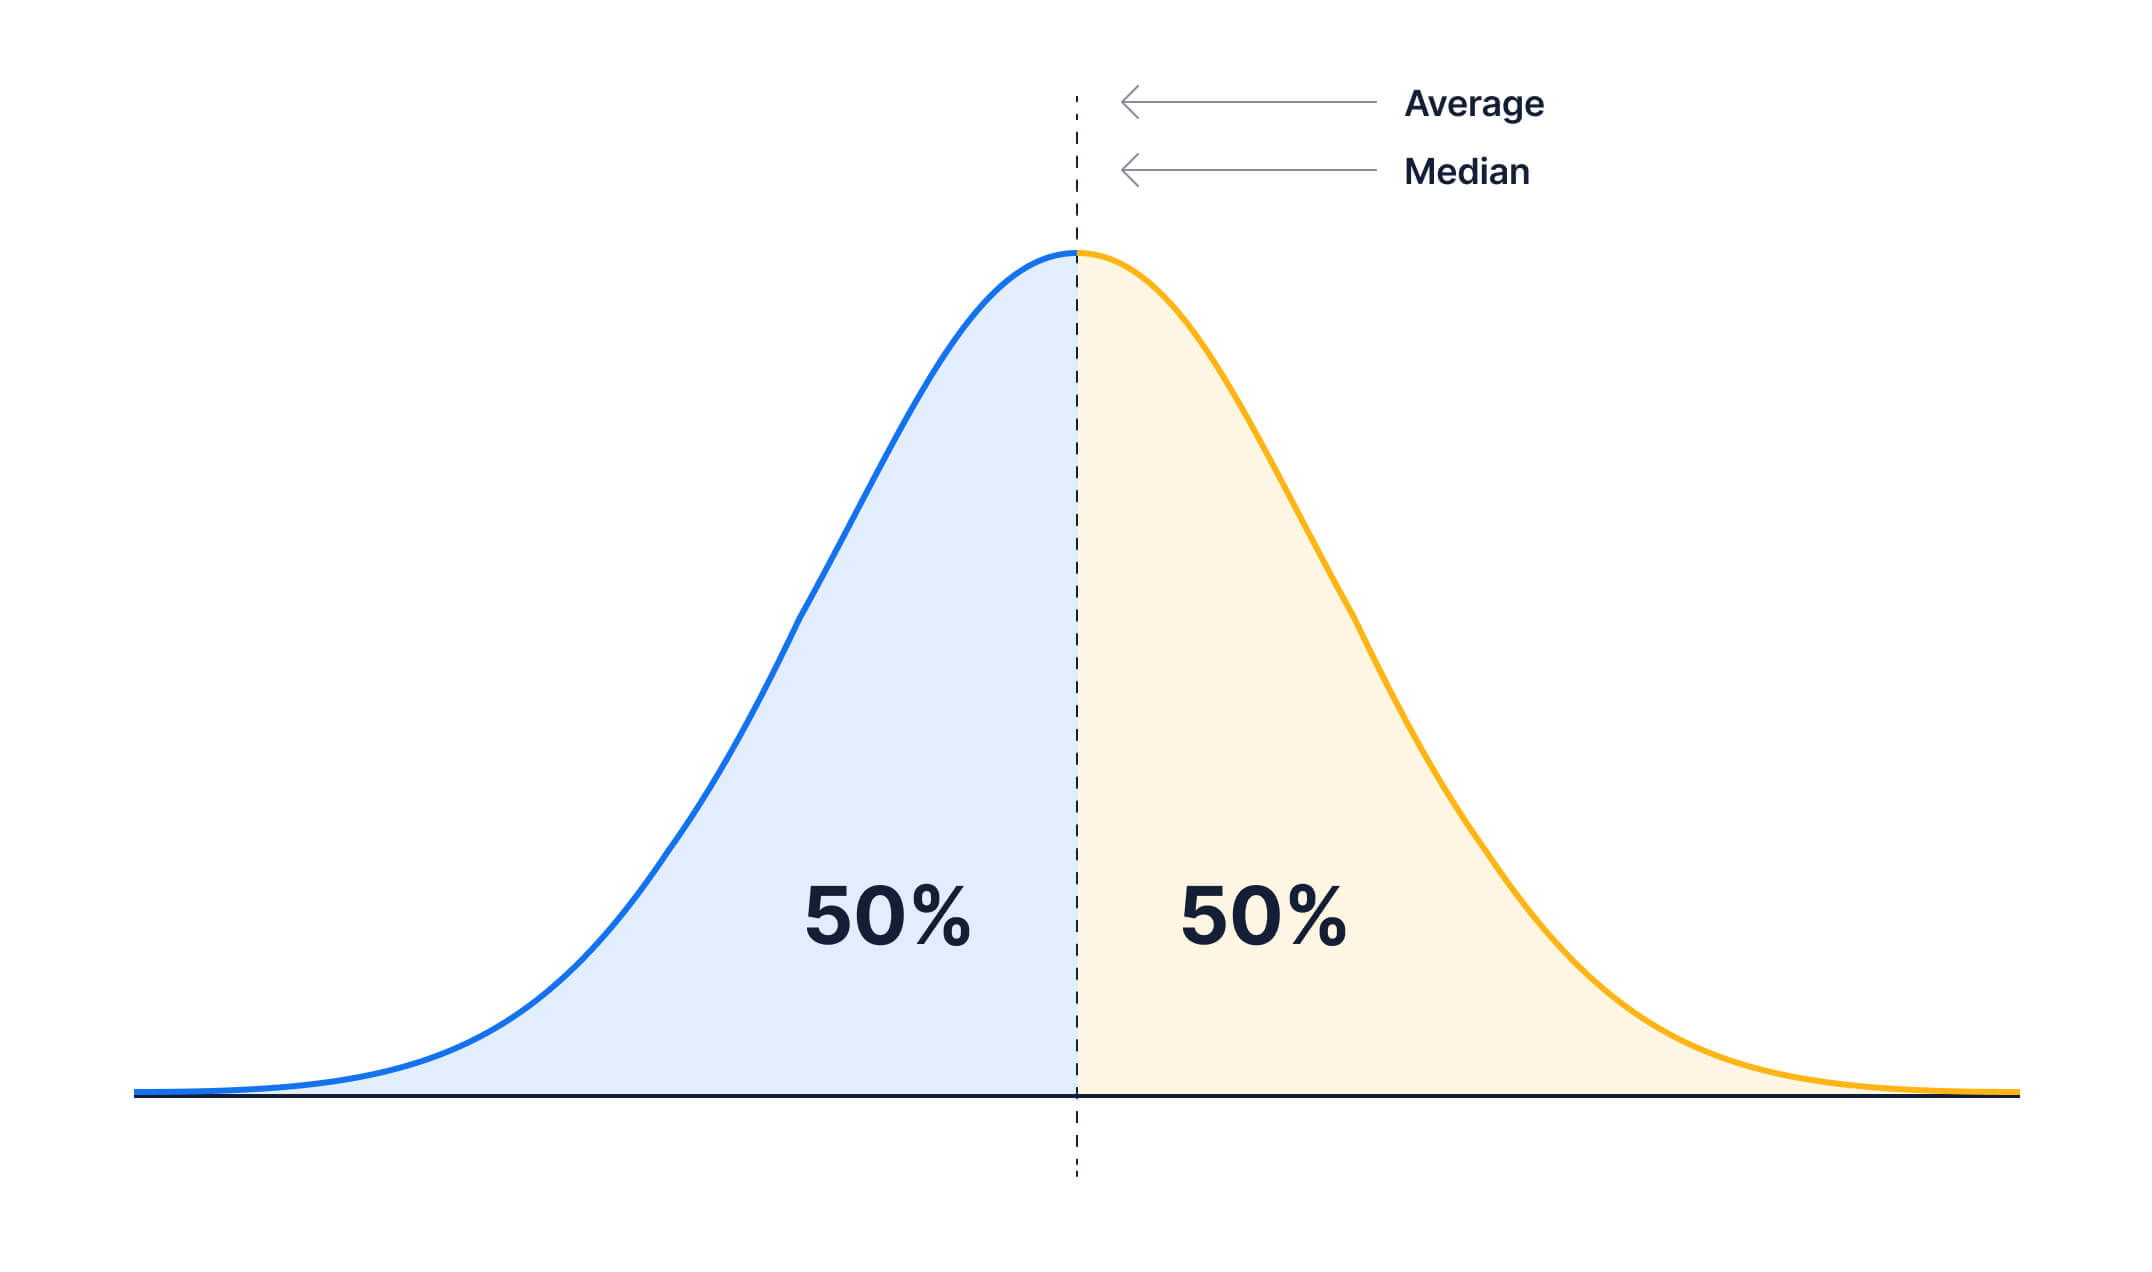
- The 50th Percentile (Median): This represents the typical experience. If the median is good but the 90th percentile is poor, it indicates that while most users have a good experience, a significant minority are struggling.
- The 95th and 99th Percentiles: These represent even more extreme performance levels. Focusing on the 95th or 99th percentile can help identify and address the worst-case scenarios, which can be crucial for mission-critical applications where even rare failures have significant consequences. For example, in cybersecurity, the 99th percentile of login attempt response times might be scrutinized to ensure that even under heavy load or attack conditions, legitimate users aren’t excessively delayed.
- The 10th and 5th Percentiles: These indicate the best-case performance. While less commonly the primary focus, they can be useful for understanding system capacity and the absolute fastest possible outcomes.
By looking at a range of percentiles, from the median up to the 99th, you gain a holistic understanding of system behavior, enabling more targeted improvements and risk mitigation strategies.
Actionable Insights: From Data to Improvement
The ultimate goal of analyzing percentiles is to drive improvement. When you observe a 90th percentile metric that falls short of expectations, it signals a need for investigation and optimization. This could involve:
- Code Profiling: Identifying inefficient algorithms or resource-intensive operations within the software.
- Infrastructure Scaling: Adding more resources (CPU, memory, network bandwidth) to handle increased demand.
- Database Optimization: Tuning queries, indexing, or refactoring database schemas.
- Caching Strategies: Implementing or improving caching mechanisms to reduce redundant computations or data fetches.
- Network Latency Reduction: Optimizing network routes or deploying content delivery networks (CDNs).
Conversely, when the 90th percentile metric is exceptionally strong, it highlights successful strategies and areas of excellence that can be maintained or even leveraged in other parts of the system.
Conclusion: The 90th Percentile as a Compass for Tech Excellence
In the complex and ever-evolving landscape of technology, the 90th percentile serves as a vital compass, guiding us towards understanding and achieving exceptional performance. It moves us beyond the often-deceptive simplicity of averages to reveal how systems, applications, and processes truly perform for the vast majority of their users and operations. By diligently interpreting and acting upon metrics reported at the 90th percentile, technology professionals can ensure robust, responsive, and reliable systems, ultimately driving user satisfaction and achieving business objectives in an increasingly competitive digital world. Mastering this metric is not just about understanding data; it’s about building and maintaining technology that excels.
aViewFromTheCave is a participant in the Amazon Services LLC Associates Program, an affiliate advertising program designed to provide a means for sites to earn advertising fees by advertising and linking to Amazon.com. Amazon, the Amazon logo, AmazonSupply, and the AmazonSupply logo are trademarks of Amazon.com, Inc. or its affiliates. As an Amazon Associate we earn affiliate commissions from qualifying purchases.