The Technological Core: How Ultrasound Images are Formed
At its heart, an ultrasound system is a sophisticated piece of technology that harnesses the power of high-frequency sound waves, far beyond the range of human hearing, to create real-time images of internal body structures. The process begins with a transducer, a handheld device containing piezoelectric crystals. When an electrical current is applied to these crystals, they vibrate, generating ultrasonic sound waves that are then directed into the body.
Transducers and Piezoelectric Principles
The magic of the transducer lies in its ability to both emit and receive sound waves. The piezoelectric effect, a core principle in ultrasound technology, describes the property of certain materials to generate an electric charge when mechanical stress is applied, and conversely, to undergo mechanical deformation when an electric field is applied. In an ultrasound transducer, these crystals oscillate at frequencies typically ranging from 2 to 18 megahertz (MHz). The emitted sound waves travel through tissues, and when they encounter boundaries between different tissue types—such as muscle and fat, or fluid and solid organs—a portion of the sound wave is reflected back to the transducer as an “echo.”
Echoes, Data Acquisition, and Grayscale Rendering
Upon returning to the transducer, these echoes cause the piezoelectric crystals to vibrate, converting the mechanical energy back into electrical signals. These electrical signals are then sent to the ultrasound machine’s central processing unit (CPU), a powerful onboard computer. The CPU measures three critical parameters of each echo: the time it took to return (indicating depth), the direction from which it returned, and its amplitude (strength). Stronger echoes typically indicate denser or more reflective structures, while weaker echoes come from softer tissues or fluid.
Sophisticated software algorithms within the CPU translate this raw data into a two-dimensional grayscale image. The strength of the echo dictates the brightness of the pixel on the display: stronger echoes are typically rendered as brighter white or light gray, while weaker echoes appear darker gray, and areas with no echoes (like fluid-filled cysts) appear black. This grayscale image provides fundamental anatomical information, revealing shapes, sizes, and relative densities of structures. However, for dynamic processes like blood flow, more advanced technological modes are employed, bringing color into the diagnostic spectrum.
Unlocking Dynamics: The Power of Color Doppler Technology
While grayscale ultrasound excels at anatomical visualization, it offers limited insight into the dynamic processes occurring within the body, particularly the flow of blood or other fluids. This is where Color Doppler technology, a revolutionary advancement in diagnostic imaging, comes into play, leveraging the fundamental principles of physics to visualize motion.
The Doppler Effect: A Fundamental Principle
The very foundation of Color Doppler is the Doppler effect, a phenomenon first described by Austrian physicist Christian Doppler. It states that the perceived frequency of a wave changes if the source of the wave and the observer are in relative motion. A familiar example is the changing pitch of a siren as an ambulance approaches and then recedes. In ultrasound, the sound waves emitted by the transducer are the “source,” and red blood cells within blood vessels act as “reflectors” that are in motion.
When ultrasonic waves encounter moving blood cells, their frequency changes. If the blood cells are moving towards the transducer, the frequency of the reflected sound wave increases (a positive Doppler shift). Conversely, if the blood cells are moving away from the transducer, the frequency of the reflected wave decreases (a negative Doppler shift). The ultrasound machine’s advanced signal processing software precisely measures these minute frequency shifts.
Color Flow Mapping (CFM): Visualizing Blood Flow Direction and Velocity
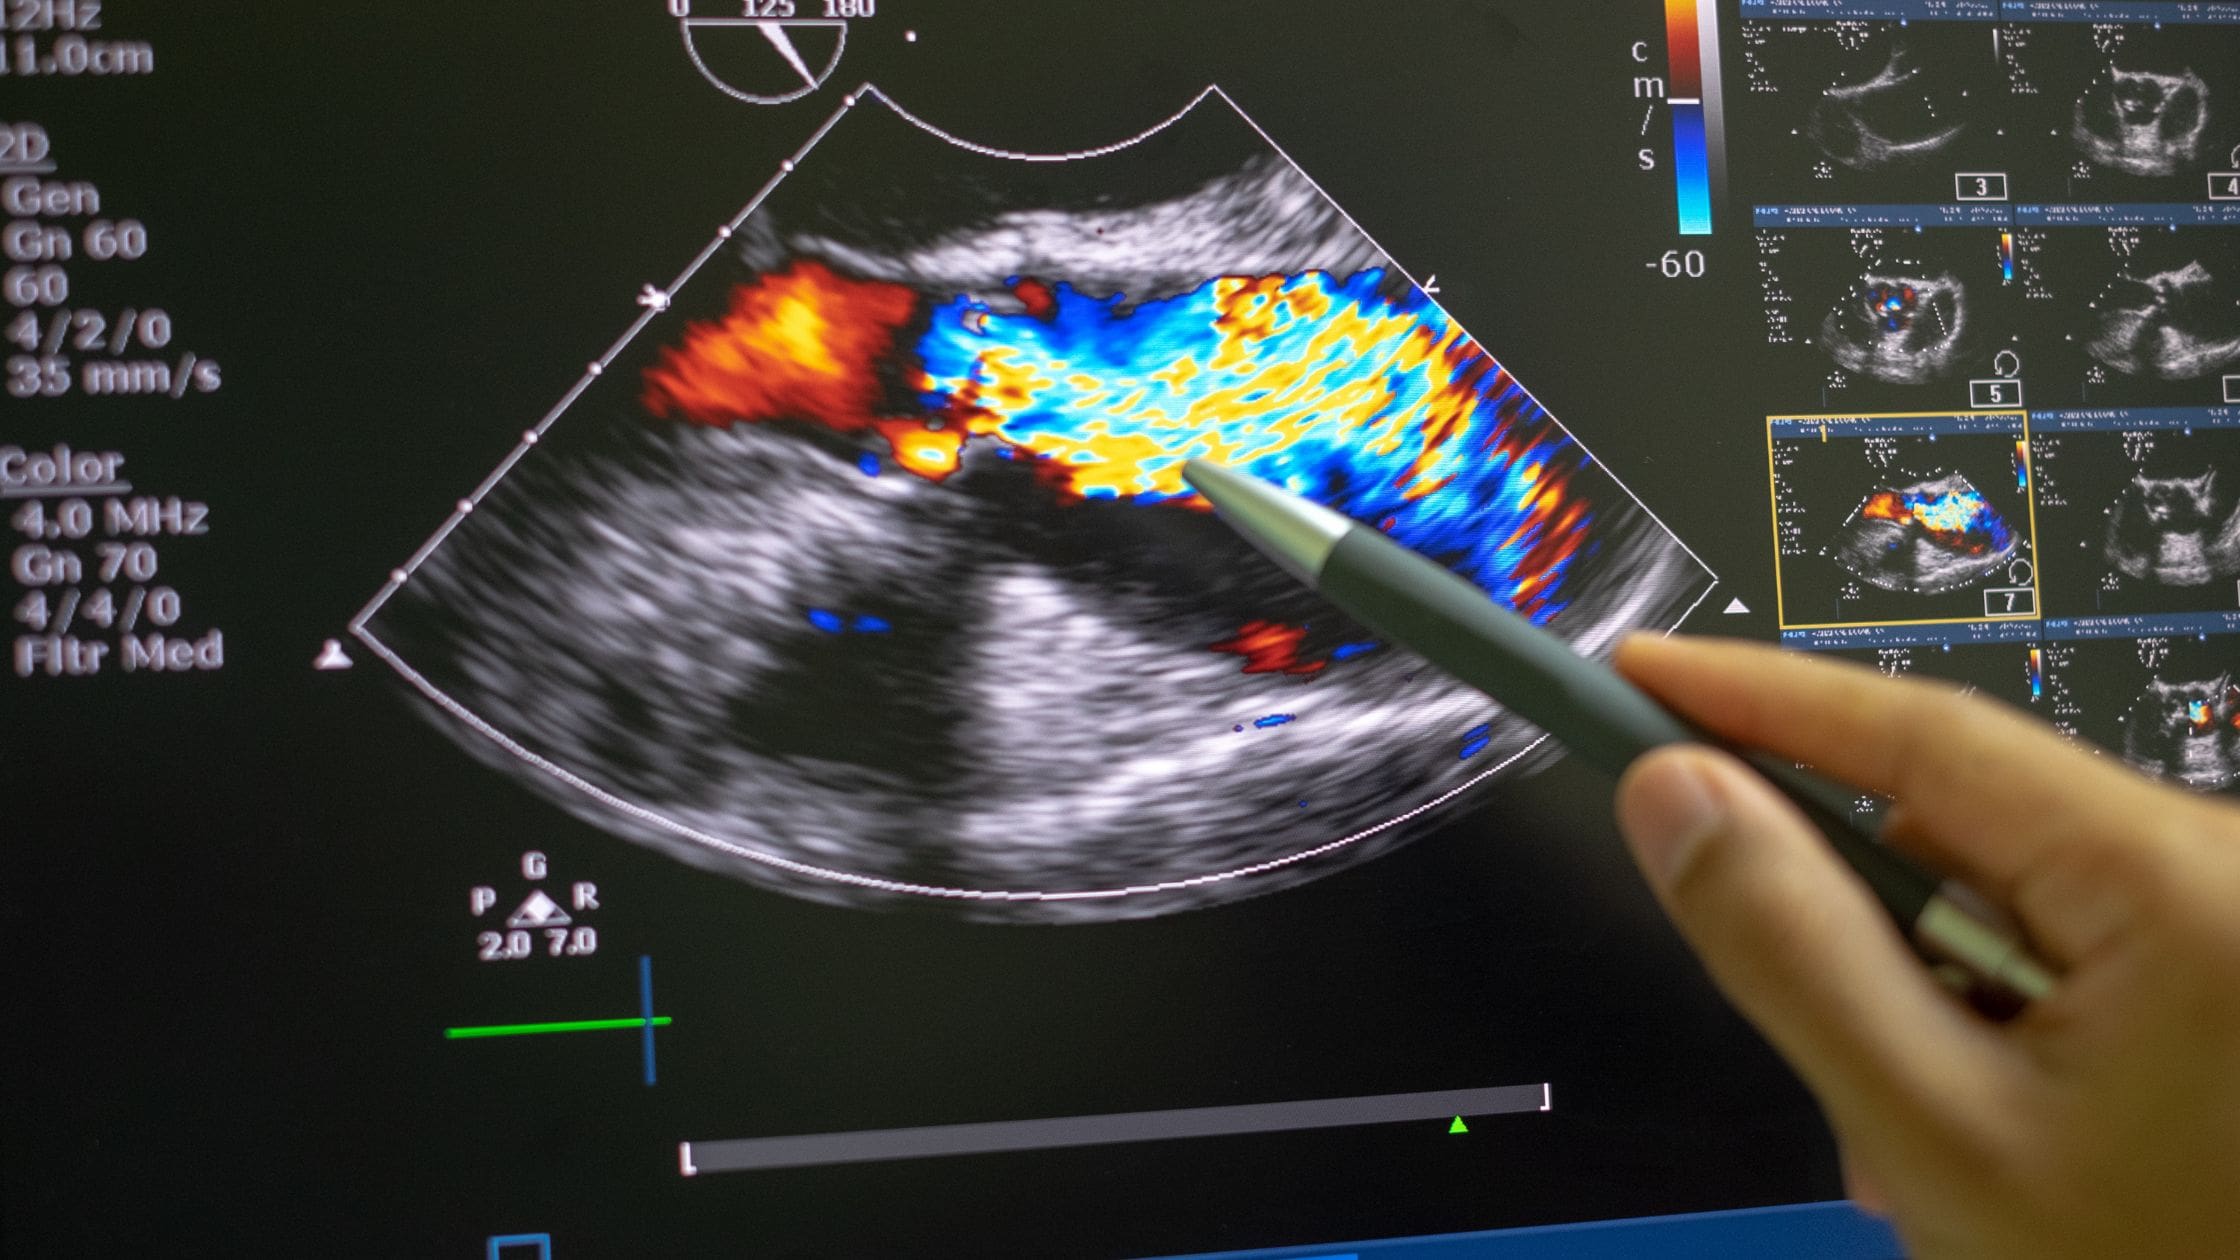
Color Flow Mapping (CFM) is the most common application of Color Doppler. The ultrasound system’s software processes the detected Doppler shifts and, based on their magnitude and direction, assigns a specific color to represent the blood flow. A conventional color map is employed, where red typically indicates blood flow towards the transducer, and blue indicates blood flow away from the transducer.
The intensity or saturation of these colors often corresponds to the velocity of the flow: brighter shades of red or blue denote higher velocities, while darker shades suggest slower flow. A color bar, usually displayed on the side of the ultrasound screen, provides a key to this mapping, showing the range of velocities corresponding to the color spectrum. This visual overlay onto the grayscale anatomical image allows clinicians to immediately assess the presence, direction, and speed of blood flow within vessels and organs. Algorithms continuously calculate these velocities and dynamically update the color overlay in real-time, providing an intuitive, instantaneous view of hemodynamic processes.
Power Doppler: Sensitivity Over Direction
While CFM is excellent for showing direction and velocity, it can sometimes struggle with very slow flow rates or in very small vessels, especially when the angle between the ultrasound beam and the blood vessel is suboptimal. To address this, Power Doppler (also known as Color Angio) was developed.
Technologically, Power Doppler operates differently. Instead of measuring the frequency shift itself, it focuses on the amplitude or strength of the Doppler signal, which is directly related to the concentration of red blood cells in motion. It essentially detects the presence of blood flow, regardless of its direction or precise velocity.
The color displayed in Power Doppler typically uses a single hue, often shades of orange or yellow, with varying intensity. Brighter shades indicate a stronger Doppler signal, implying more blood cells in motion, but without conveying directional information. This makes Power Doppler highly sensitive to low-velocity flows in tiny vessels, such as those found within tumors or inflamed tissues, where traditional CFM might not detect a signal. It excels in applications requiring confirmation of perfusion rather than detailed flow dynamics.
Beyond Blood Flow: Specialized Color Applications in Medical Imaging
The integration of color into ultrasound technology extends far beyond simple blood flow visualization, offering deeper insights into tissue characteristics and organ function through specialized imaging modes. These advanced applications leverage sophisticated signal processing and proprietary algorithms to translate various physiological and biomechanical properties into intuitive color maps.
Tissue Doppler Imaging (TDI): Mapping Myocardial Motion
Tissue Doppler Imaging (TDI) represents a significant technological leap, shifting the focus from blood flow to the motion of the heart muscle itself. Unlike standard Doppler, which filters out signals from slow-moving tissue to highlight blood, TDI is specifically designed to detect and measure the velocities of myocardial tissue. This is crucial for assessing cardiac function, particularly the relaxation and contraction patterns of the heart chambers.
The ultrasound system’s software tracks the low-frequency, high-amplitude signals generated by the moving heart muscle. These velocities are then mapped onto a color scale, similar to CFM. For instance, in some TDI modes, colors like red and blue might indicate myocardial motion towards or away from the transducer during different phases of the cardiac cycle, while shades of green or yellow could represent other velocity parameters. By providing quantitative data on myocardial velocities, TDI aids in the early detection of various cardiac pathologies, offering insights into systolic and diastolic function that might not be apparent from standard grayscale images.
Elasto-Sonography: Quantifying Tissue Stiffness with Color
Elasto-sonography, or elastography, is another cutting-edge application that uses color to represent a tissue’s mechanical properties, specifically its stiffness or elasticity. The principle behind elastography is that diseased tissues, such as tumors or fibrotic lesions, often have different stiffness compared to healthy surrounding tissue.

Technologically, elastography methods vary, but they generally involve applying a controlled mechanical force (either external compression by the transducer or internal shear waves generated by the ultrasound machine) to the tissue. The ultrasound system then measures the resulting tissue deformation or the speed at which shear waves propagate through the tissue. Softer tissues deform more easily and shear waves travel slower, while stiffer tissues resist deformation and shear waves travel faster.
The software processes these measurements and generates a real-time color map overlaid on the grayscale image. A common convention uses a spectrum from blue to red, where blue often signifies softer tissues and red indicates stiffer tissues. This color coding provides a visual, quantitative assessment of tissue stiffness, which is invaluable in diagnosing conditions like liver fibrosis, breast lesions, and thyroid nodules, often reducing the need for invasive biopsies.
Contrast-Enhanced Ultrasound (CEUS): Microbubble Dynamics
Contrast-Enhanced Ultrasound (CEUS) employs specialized microbubble contrast agents to significantly improve the visibility and characterization of blood flow, especially in organs with complex vascularity like the liver and kidneys. These microbubbles are injected intravenously and are smaller than red blood cells, allowing them to remain entirely intravascular.
Technologically, CEUS systems use specific ultrasound frequencies and software algorithms designed to detect the strong, non-linear echoes produced by these microbubbles. Unlike conventional Doppler, which relies on the small echoes from red blood cells, CEUS capitalizes on the highly reflective nature of the microbubbles. The system can then display the microbubble perfusion within tissues in real-time, often using distinct color overlays or specific display modes that highlight the contrast agent’s presence. This enhanced visualization allows for precise assessment of lesion vascularity, differentiation between benign and malignant masses, and monitoring of treatment response, providing dynamic perfusion information that grayscale and even standard color Doppler may miss.
The Operator Interface and Interpretive Algorithms: Optimizing Color Displays
The accurate interpretation of colors on an ultrasound screen is not solely dependent on the inherent technology but also heavily influenced by the expertise of the sonographer and the intelligent algorithms embedded within the system’s software. The interface allows for critical adjustments that fine-tune the color display, while sophisticated processing minimizes artifacts and harnesses emerging AI capabilities.
Gain, Scale, and Wall Filter: Fine-Tuning the Digital Output
Ultrasound machines provide operators with an array of software controls to optimize color images. Three of the most critical are Gain, Scale (or Pulse Repetition Frequency – PRF), and Wall Filter.
- Gain: This setting controls the overall amplification of the received Doppler signals. Technologically, increasing the gain boosts the brightness and extent of the color display. Too much gain can introduce “color noise” or artifactual color in areas without flow, while too little gain may obscure legitimate, slower flows. The optimal gain setting ensures that all real flow is visualized without excessive clutter.
- Scale (PRF): This parameter adjusts the velocity range that the system can accurately detect and display. A higher PRF allows for the detection of faster blood flow velocities without aliasing (the phenomenon where flow velocities exceed the detectable range, causing them to wrap around and be displayed in the opposite direction). Conversely, a lower PRF is used for detecting slower flows. The system’s algorithms dynamically map the detected velocities to the chosen color scale based on the current PRF setting.
- Wall Filter: Also known as a “high-pass filter,” the wall filter digitally removes low-frequency, high-amplitude Doppler signals originating from stationary or very slow-moving tissue, which could otherwise mask the much weaker signals from flowing blood. This technical adjustment is crucial for distinguishing blood flow from tissue motion, especially in areas adjacent to pulsatile vessels or moving organs like the heart.
Color Artifacts: Technological Limitations and Misinterpretations
Despite advanced algorithms, ultrasound color imaging is susceptible to various artifacts, which are unwanted or incorrect representations of anatomical or physiological data. Understanding these technological limitations is key to accurate interpretation.
- Aliasing: This common artifact occurs when the velocity of blood flow exceeds the Nyquist limit, the maximum velocity that can be accurately measured by the system at a given PRF. The software then incorrectly interprets the high-frequency shift as a shift in the opposite direction, causing a “wrap-around” effect where red flow may suddenly appear blue, or vice versa. This is a purely digital display artifact resulting from insufficient sampling rate.
- Angle Dependence: The accuracy of Doppler velocity measurements is highly dependent on the angle between the ultrasound beam and the direction of blood flow. Optimal measurements occur when the beam is parallel (or nearly parallel) to the flow. As the angle approaches 90 degrees, the Doppler shift approaches zero, making flow undetectable. Modern systems incorporate algorithms for angle correction, but steep angles can still lead to underestimation of velocity or loss of color signal.
- Flash Artifact (Motion Artifact): Rapid movement of the transducer or patient can cause large, sudden Doppler shifts from tissue, leading to a transient, widespread burst of color (a “flash”) across the image, obscuring true blood flow. Advanced software algorithms attempt to suppress these sudden, non-physiological shifts, but careful operator technique remains paramount.
Advancements in Software and AI for Enhanced Color Interpretation
The future of color ultrasound interpretation is increasingly intertwined with advanced software development and artificial intelligence (AI). AI and machine learning (ML) algorithms are being trained on vast datasets of ultrasound images, including intricate color patterns.
These intelligent systems are designed to:
- Automate optimization: Dynamically adjust gain, PRF, and wall filter settings in real-time to achieve optimal color visualization, reducing operator variability.
- Artifact reduction: More effectively identify and suppress color artifacts, such as aliasing and flash, improving the clarity and reliability of the display.
- Quantitative analysis: Automatically measure and quantify flow velocities, volumes, and perfusion indices from color Doppler data, providing objective, reproducible metrics.
- Diagnostic assistance: Highlight suspicious areas of abnormal flow or tissue stiffness, guiding the sonographer’s attention and potentially aiding in early diagnosis.
These AI-driven enhancements promise to make color ultrasound even more powerful, efficient, and accessible, refining the meaning derived from every hue.
The Evolving Landscape of Ultrasound Technology and Color Imaging
The journey of ultrasound technology, from its grayscale origins to sophisticated color-coded diagnostics, continues to evolve at a rapid pace. Innovations in hardware, software, and computational power are pushing the boundaries, promising even more detailed, accessible, and intelligent imaging solutions.
3D/4D Color Volume Rendering: Spatial and Temporal Depth
A significant technological leap in ultrasound imaging is the transition from 2D slices to 3D and 4D volumetric data acquisition, now seamlessly integrated with color Doppler capabilities. Instead of a single flat image, a 3D ultrasound machine acquires multiple adjacent 2D slices, which are then stitched together by powerful rendering software to create a three-dimensional volume. When combined with color Doppler, this technology allows for the visualization of blood flow patterns within complex anatomical structures in a spatial context.
4D ultrasound takes this a step further by adding the dimension of time, displaying these 3D volumes in real-time. This dynamic view allows clinicians to observe intricate flow patterns, such as those within the fetal heart or complex vascular malformations, as they unfold. The rendering algorithms are highly sophisticated, enabling the user to rotate, slice, and manipulate the volumetric data, gaining a comprehensive understanding of anatomical relationships and hemodynamic characteristics that would be impossible with traditional 2D color Doppler. This fusion of spatial, temporal, and color information represents a pinnacle of diagnostic visualization.
Miniaturization, Portability, and Tele-Ultrasound
The trend towards miniaturization and increased computational efficiency is transforming where and how color ultrasound is utilized. Historically confined to specialized departments, advanced color Doppler capabilities are now available in highly portable, even handheld, devices. These compact systems leverage powerful, energy-efficient processors and streamlined user interfaces to deliver diagnostic-quality color images at the point of care.
This portability has opened doors for tele-ultrasound, where examinations can be performed in remote or resource-limited settings by non-expert personnel, with real-time color images and data transmitted securely over networks to specialists located elsewhere for immediate interpretation. This democratization of advanced diagnostic tools extends the reach of sophisticated color imaging to underserved populations, allowing for earlier detection and intervention in a wider array of medical conditions, leveraging cloud-based platforms and secure communication protocols.

Future Directions: AI-Driven Predictive Analytics and Augmented Reality
Looking ahead, the evolution of color ultrasound is increasingly directed towards intelligent systems that move beyond mere image display and interpretation. AI and machine learning are poised to revolutionize the field through predictive analytics. By analyzing vast datasets of color Doppler patterns, tissue elastography maps, and CEUS perfusion curves, AI algorithms will be able to identify subtle biomarkers or patterns indicative of disease progression or treatment response, potentially predicting patient outcomes with greater accuracy than human analysis alone. This involves complex pattern recognition and statistical modeling of color-coded information.
Furthermore, augmented reality (AR) is emerging as a disruptive technology. Imagine a surgeon wearing AR glasses that overlay real-time color Doppler information directly onto the patient’s body during a procedure, highlighting critical vessels or tumor boundaries. Such integration would provide an unprecedented level of guidance, fusing digital color data with the physical world. This confluence of advanced imaging, AI, and AR promises a future where color on an ultrasound screen not only reveals what is happening within the body but also proactively guides diagnosis, intervention, and prediction, cementing its role as a cornerstone of modern medical technology.
aViewFromTheCave is a participant in the Amazon Services LLC Associates Program, an affiliate advertising program designed to provide a means for sites to earn advertising fees by advertising and linking to Amazon.com. Amazon, the Amazon logo, AmazonSupply, and the AmazonSupply logo are trademarks of Amazon.com, Inc. or its affiliates. As an Amazon Associate we earn affiliate commissions from qualifying purchases.