
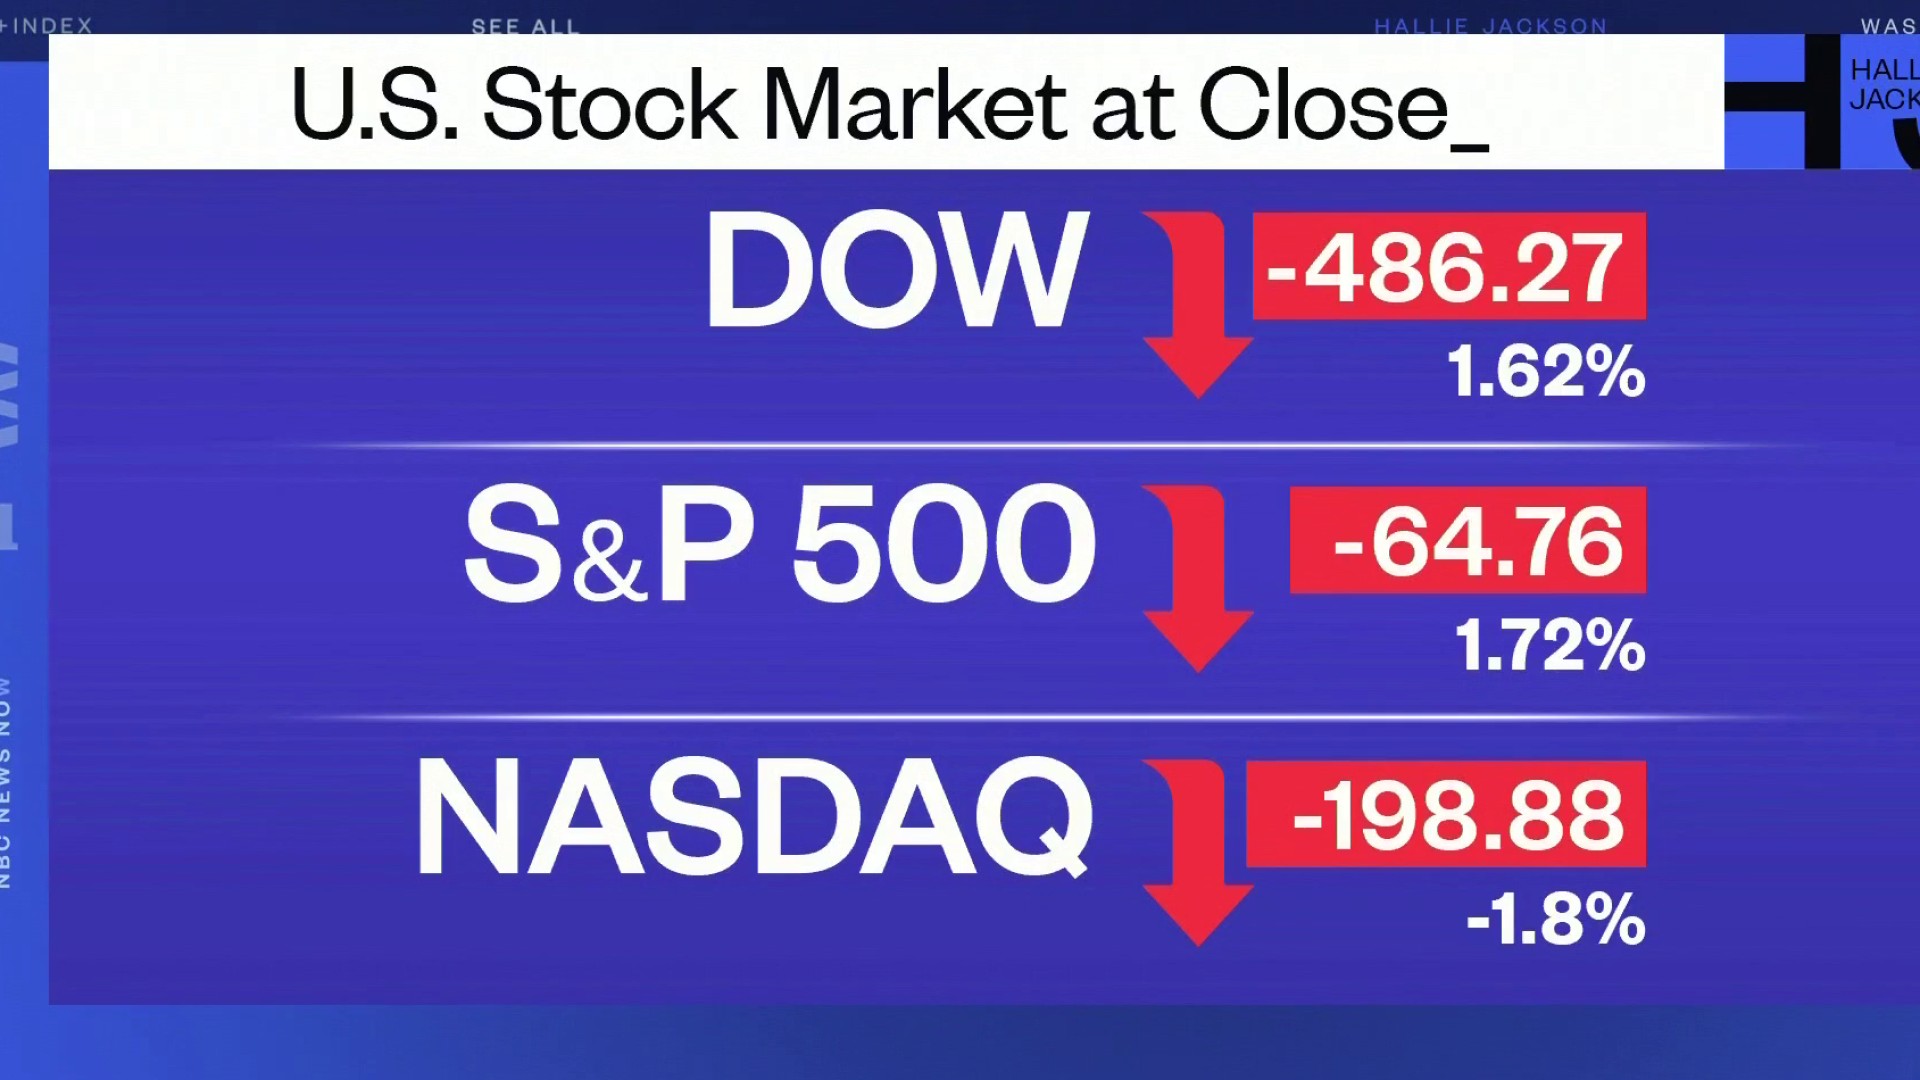
Every afternoon at 4:00 PM Eastern Time, a flurry of activity descends upon the financial world. Traders, institutional investors, and retail enthusiasts alike pivot their attention toward the “closing bell.” When people ask, “What did the markets close at today?” they are rarely asking for a single number. Instead, they are seeking a pulse check on the global economy, the health of their retirement portfolios, and a signal of what might happen when the opening bell rings tomorrow morning.
Understanding the closing figures of the major indices—the Dow Jones Industrial Average, the S&P 500, and the Nasdaq Composite—requires more than just looking at a green or red arrow. It demands an appreciation for the mechanics of the market, the psychological triggers of the trading day, and the broader macroeconomic trends that drive capital flow.
Decoding the Daily Close: Why the Final Bell Matters
The closing price of a security is the most accurate valuation of that asset during the regular trading session. While stock prices fluctuate wildly throughout the day based on news, rumors, and high-frequency trading algorithms, the closing price represents the final consensus between buyers and sellers after all information has been digested.
The Closing Auction and Price Discovery
The final minutes of the trading day are often the most volatile. This is due to the “closing auction,” a process designed to consolidate liquidity and determine a single price for each stock. Institutional investors, such as mutual funds and ETFs, often wait until the end of the day to execute large trades to ensure they receive a price close to the official daily benchmark. This concentration of volume makes the closing price a “clean” data point used by analysts to calculate moving averages and other technical indicators.
Market Psychology: The “Smart Money” Flow
There is an old adage on Wall Street: “Amateurs open the market, professionals close it.” The theory suggests that the morning’s volatility is driven by retail investors reacting to overnight news, while the final hour of trading—often called the “Power Hour”—is dominated by institutional players who have had the entire day to analyze the data. If a market closes near its daily highs, it signals confidence and momentum. Conversely, a “selling into the close” scenario often suggests that big players are de-risking ahead of the next session.
The Role of After-Hours Trading
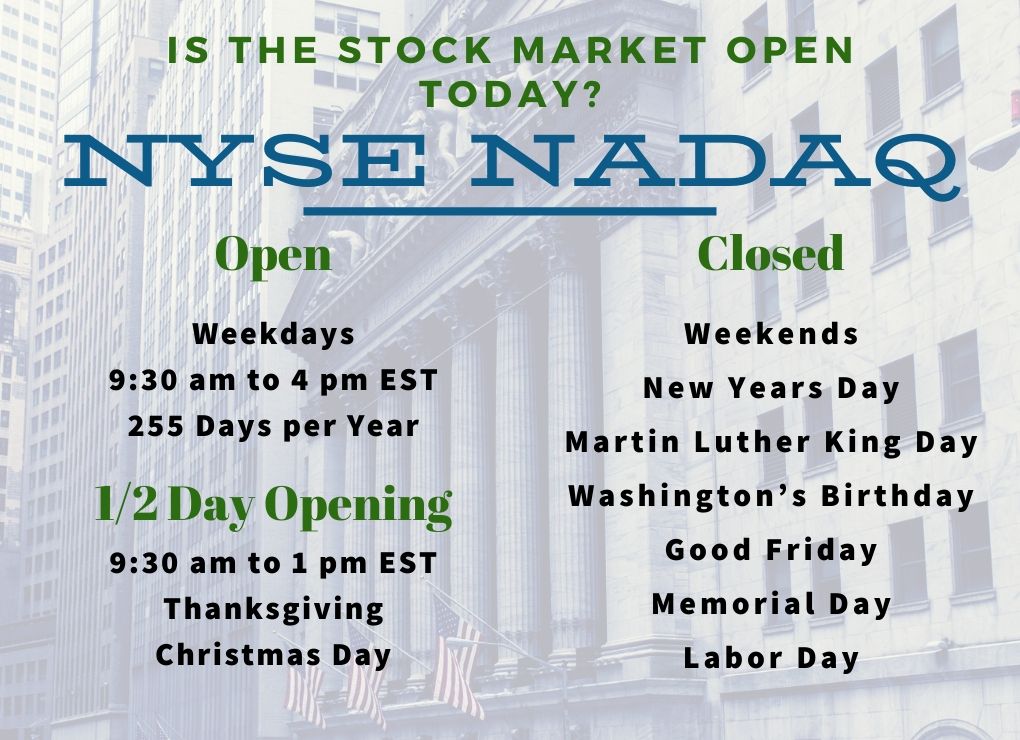
While the official close happens at 4:00 PM, the market never truly sleeps. After-hours trading allows for the exchange of shares until 8:00 PM. However, these sessions have lower liquidity and wider spreads. When a major company reports earnings after the bell, the “close” can become irrelevant within minutes as the stock price reacts to the new financial data in the extended session.
The Major Indices: Navigating the Dow, S&P 500, and Nasdaq
To answer what the markets did today, one must look at the three primary barometers of American equity. Each tells a different story about the economy.
The Dow Jones Industrial Average (DJIA)
The Dow is the oldest and perhaps most famous index, consisting of 30 “blue-chip” companies. Because it is price-weighted, a higher-priced stock has a greater influence on the index’s movement than a lower-priced one, regardless of the company’s actual size. When the Dow closes up, it usually indicates strength in traditional sectors like industrials, banking, and consumer staples. It is the pulse of the “old economy.”
The S&P 500: The Professional Standard
Most financial advisors and institutional managers view the S&P 500 as the definitive representation of the U.S. stock market. Covering 500 of the largest publicly traded companies, it is market-cap-weighted, meaning giants like Apple, Microsoft, and Amazon carry the most weight. When you see the S&P 500 close at a record high, it reflects a broad-based optimism across multiple sectors, from healthcare to energy.
The Nasdaq Composite: The Growth Engine
The Nasdaq is heavily weighted toward technology and growth-oriented companies. It is the index most sensitive to interest rate changes and innovation cycles. A strong close in the Nasdaq often indicates a high “risk-on” appetite among investors, suggesting they are willing to pay a premium for future earnings in sectors like artificial intelligence, biotechnology, and software.
Interpreting Market Volatility and Sector Performance
A market’s closing number is a snapshot, but the story is found in the “why.” To truly understand the day’s performance, an investor must look at sector rotation and macroeconomic catalysts.
Sector Rotation and Relative Strength
On any given day, the market may close “flat,” yet beneath the surface, a massive shift of capital could be occurring. For example, if the tech sector is down but the energy and utility sectors are up, it suggests a “defensive” posture. Investors may be moving money out of risky growth stocks and into “value” stocks that pay dividends and provide essential services. Tracking which sectors lead or lag the daily close helps investors identify where the “smart money” is moving.
The Influence of the Federal Reserve
In the current financial landscape, perhaps no entity influences the daily close more than the Federal Reserve. Investors hang on every word from Fed officials regarding inflation and interest rates. If the markets close sharply lower after a Fed announcement, it usually means investors fear that higher rates will cool the economy too much, hurting corporate profits. Conversely, a close in the green following economic data might suggest a “Goldilocks” scenario—an economy that is neither too hot (inflationary) nor too cold (recessionary).
Earnings Season and Corporate Guidance
Four times a year, the daily close is dictated by corporate earnings reports. When a “bellwether” company like Walmart or JP Morgan reports better-than-expected profits and, more importantly, provides positive “guidance” for the future, it can lift the entire index. A market that closes higher during earnings season is a market that believes corporate America is resilient enough to weather economic headwinds.
The Emotional Intelligence of Investing: Avoiding the “Daily Noise” Trap
While it is natural to check what the markets closed at today, there is a psychological danger in over-indexing on daily fluctuations. For the long-term investor, the daily close is often “noise”—a temporary vibration in a much larger trend.
The Danger of Recency Bias
Recency bias is the tendency to believe that what happened today will continue to happen tomorrow. If the market closes down 2% today, an emotional investor might feel an urge to sell everything to “protect” their capital. However, history shows that the market’s best days often follow its worst. Missing just a few of the market’s top-performing days can significantly devalue a portfolio over decades.
Volatility as Opportunity
Professional investors often view a “red” close not as a loss, but as a discount. Volatility is the price of admission for the long-term returns provided by the equity markets. Understanding that a market close is merely a temporary valuation allows an investor to maintain a disciplined “Dollar Cost Averaging” strategy, where they invest a fixed amount regularly regardless of whether the market closed up or down.
Rebalancing and Strategy
Rather than reacting to the daily close, successful investors use the data to inform their periodic rebalancing. If a massive rally in tech stocks causes that sector to take up a disproportionate share of your portfolio, a high closing price might be a signal to trim some gains and move them into underperforming sectors, adhering to the “buy low, sell high” philosophy.
Tools for Tracking and Managing Your Portfolio in Real-Time
In the digital age, the data behind the daily close is more accessible than ever. However, the quality of your tools determines the quality of your insights.
Fintech Apps and Real-Time Data
Gone are the days when you had to wait for the next morning’s newspaper to see stock prices. Apps like Robinhood, Fidelity, and Schwab provide real-time streaming data. For more advanced investors, platforms like Bloomberg or Morningstar offer “depth of book” data, showing the buy and sell orders that are lining up before the closing bell.
Utilizing Financial News Wisely
When checking the market close, it is helpful to cross-reference the numbers with reputable financial journalism. Outlets like The Wall Street Journal, CNBC, and Financial Times provide the “narrative” behind the numbers. They help distinguish between a “technical sell-off” (where prices drop because they hit a certain threshold) and a “fundamental sell-off” (where prices drop because the underlying economy has changed).

Automated Wealth Management
For those who find the daily fluctuations of the market stressful, robo-advisors and automated wealth management tools offer a solution. These platforms are designed to ignore the daily “close” and focus on long-term algorithmic goals. They handle the rebalancing and tax-loss harvesting automatically, ensuring that your financial strategy remains sound whether the Dow is up 500 points or down 500 points.
The question “What did the markets close at today?” is the start of a journey into the world of finance. While the numbers provide a snapshot of the present, your reaction to those numbers defines your financial future. By understanding the mechanics of the close, the composition of the indices, and the psychological traps of daily trading, you can transform from a passive observer into a strategic participant in the global economy. Wealth is rarely built in a single trading session; it is built through the disciplined accumulation of sessions, year after year, regardless of where the bell rings today.
aViewFromTheCave is a participant in the Amazon Services LLC Associates Program, an affiliate advertising program designed to provide a means for sites to earn advertising fees by advertising and linking to Amazon.com. Amazon, the Amazon logo, AmazonSupply, and the AmazonSupply logo are trademarks of Amazon.com, Inc. or its affiliates. As an Amazon Associate we earn affiliate commissions from qualifying purchases.