
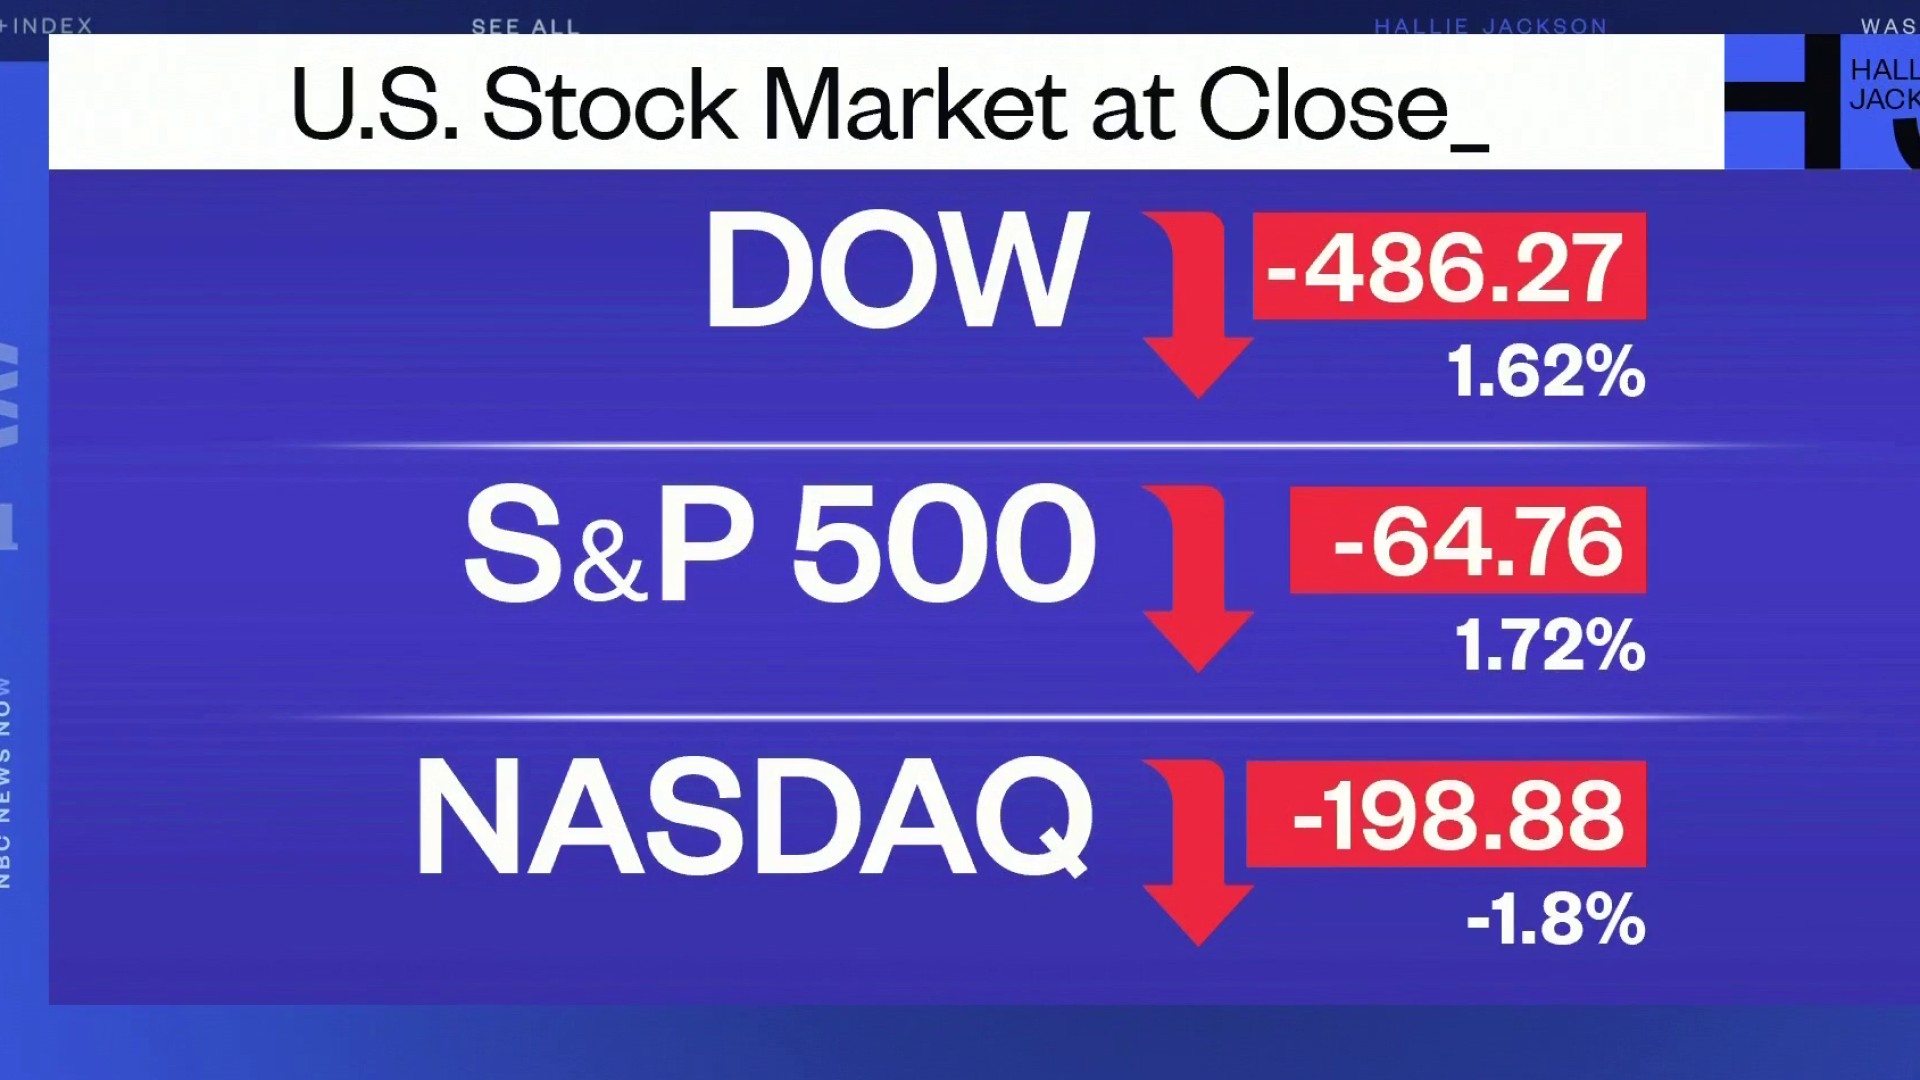
In the world of finance, few questions are as ubiquitous as “What did the Dow close at yesterday?” For the casual observer, the answer—a five-digit number followed by a green or red percentage—is a simple temperature check of the American economy. For the seasoned investor, however, that number represents the culmination of global sentiment, corporate earnings, and macroeconomic shifts.
The Dow Jones Industrial Average (DJIA) is more than just a headline; it is a legacy index that has shaped how we perceive market health for over a century. To truly understand what happened “yesterday” on Wall Street, one must look beyond the closing figure and delve into the mechanics of the index, the factors driving its movement, and how these fluctuations should influence a long-term financial strategy.
Decoding the Dow Jones Industrial Average (DJIA)
To appreciate the significance of the Dow’s daily close, we must first understand what the index actually is. Established in 1896 by Charles Dow and Edward Jones, the DJIA was originally designed to track the performance of the industrial sector in the United States. While the economy has shifted from heavy manufacturing to technology and services, the Dow remains a primary benchmark for “blue-chip” stocks.
A Brief History of the Index
The Dow began with just 12 companies, most of which were in the railroad, cotton, sugar, and oil industries. Names like American Cotton Oil and Distilling & Cattle Feeding Company have long since vanished, replaced by the modern titans of industry. General Electric was the longest-standing original member until it was removed in 2018. This evolution highlights the index’s primary goal: to reflect the current leaders of the American corporate landscape. Today, the 30 companies that make up the Dow are selected by a committee to ensure they represent the broad health of the U.S. economy.
How the Dow is Calculated: The Price-Weighted Model
Unlike the S&P 500 or the Nasdaq, which are market-capitalization-weighted (meaning larger companies have a bigger impact based on their total value), the Dow is a price-weighted index. This means that companies with a higher stock price have a greater influence on the index’s movement, regardless of their total market cap.
This methodology is often debated by financial experts. For instance, a $1 move in a stock trading at $200 has the same impact on the Dow as a $1 move in a stock trading at $50, even if the latter company is technically “larger” in terms of total valuation. To maintain consistency through stock splits and dividends, the index uses the “Dow Divisor,” a mathematical constant that adjusts the total sum of the stock prices to provide the final index value.
The Significance of “Blue-Chip” Companies
The 30 stocks in the Dow are often referred to as “blue-chip” stocks. This term, borrowed from the world of high-stakes poker where blue chips have the highest value, denotes companies that are well-established, financially sound, and leaders in their respective industries. Because these companies—such as Apple, Goldman Sachs, and Home Depot—are household names with massive global footprints, the Dow is often seen as a proxy for the stability of the global financial system.
Why the Daily Close Matters (and Why It Doesn’t)
When news anchors report on the Dow’s closing price, they are providing a snapshot of the day’s “closing bell” at 4:00 PM EST. This moment is a psychological anchor for the market, marking the end of a session where millions of shares have changed hands.
Measuring Market Sentiment and Investor Confidence
The daily close tells us a story about how investors are feeling. If the Dow closes significantly higher, it often indicates a “risk-on” environment where investors are optimistic about corporate earnings or economic data. Conversely, a sharp drop suggests a “risk-off” sentiment, often triggered by fears of inflation, geopolitical instability, or disappointing financial reports. For the retail investor, tracking these moves can provide a sense of the current economic climate, helping them understand whether the market is in a period of greed or fear.
The Noise of Short-Term Volatility
While the daily close is a useful data point, it is crucial to recognize the “noise” of short-term volatility. Markets can be irrational in the short run. A single headline or a misinterpreted Federal Reserve comment can cause a 500-point swing in the Dow that may be completely reversed within 48 hours. Successful personal finance management requires the ability to distinguish between a temporary market dip and a fundamental shift in economic reality. Focusing too heavily on what the Dow did “yesterday” can lead to emotional decision-making, which is the enemy of long-term wealth accumulation.

The “Closing Bell” Ritual in Modern Electronic Trading
Historically, the closing bell was the literal end of trading. However, in today’s digital age, after-hours trading continues long after the New York Stock Exchange floor has cleared. While the official “close” is recorded at 4:00 PM, prices continue to fluctuate in the extended-hours market based on late-day news or international events. This makes the “yesterday’s close” figure a baseline rather than a definitive finality, serving as the starting point for the “pre-market” activity the following morning.
Interpreting Market Fluctuations for the Long-Term Investor
If you are checking the Dow to manage your retirement savings or personal brokerage account, you need to view the daily numbers through a wider lens. Investing is a marathon, not a sprint, and the Dow’s movements are merely the terrain you must navigate.
Bull Markets vs. Bear Markets
Understanding the Dow involves recognizing broader cycles. A bull market is generally defined as a period where prices rise by 20% or more from recent lows, characterized by optimism. A bear market is the opposite—a 20% decline from recent highs, often accompanied by widespread pessimism. When the Dow closes down for several consecutive days, investors start looking for signs of a bear market. Knowing where we are in this cycle helps investors decide whether to “buy the dip” or tighten their risk management strategies.
The Role of Economic Indicators
The Dow does not move in a vacuum. It is heavily influenced by external economic indicators.
- Inflation (CPI): High inflation often hurts stock prices as it leads to higher costs for companies and lower purchasing power for consumers.
- Interest Rates: When the Federal Reserve raises rates, borrowing becomes more expensive, which can slow down corporate growth and lead to a drop in the Dow.
- Employment Data: Strong jobs reports suggest a healthy economy, which is generally bullish for the 30 industrial giants in the index.
Diversification Beyond the Dow 30
Because the Dow only tracks 30 companies, it is not a complete representation of the entire stock market. A “Money” savvy investor knows that while the Dow might be up, the broader market (represented by the S&P 500) or small-cap stocks (represented by the Russell 2000) might be down. Relying solely on the Dow’s daily close can provide a lopsided view of one’s financial health. Diversification across different indices, asset classes, and sectors is the key to building a resilient portfolio that can withstand the Dow’s inevitable “red days.”
Tools and Strategies for Tracking Financial Health
In the modern financial landscape, you don’t need to wait for the evening news to find out how the Dow performed. However, having access to information is only half the battle; knowing how to use it is what defines a successful investor.
Leveraging Financial Dashboards and Apps
There are countless tools available for tracking the Dow in real-time. Platforms like Yahoo Finance, Bloomberg, and various brokerage apps provide “heat maps” that show which of the 30 Dow components are leading the gains or losses. These tools allow investors to see why the index moved. For example, if the Dow closed down 300 points, a quick glance might show that a massive drop in Boeing or UnitedHealth Group (high-priced stocks) was the primary culprit, rather than a systemic market failure.
Building a Sustainable Investment Plan
Rather than reacting to what the Dow did yesterday, investors should utilize strategies like Dollar-Cost Averaging (DCA). By investing a fixed amount of money at regular intervals—regardless of whether the Dow closed “up” or “down”—you remove the emotional burden of trying to time the market. Over decades, this approach leverages the power of compound interest and the general upward trajectory of the American economy.
The Psychology of Investing: Avoiding Emotional Trading
The greatest risk to a personal finance plan is the human brain. When the Dow plunges, the “fight or flight” response kicks in, tempting many to sell their holdings to “save” what is left. Conversely, when the Dow hits record highs, the “Fear of Missing Out” (FOMO) leads people to buy in at the peak. Understanding that the Dow’s daily close is just one page in a very long book helps maintain the discipline required to stay the course.

Conclusion: The Dow as a Starting Point
“What did the Dow close at yesterday?” is a question about history, but for the investor, it should be a question about the future. The closing number provides a snapshot of where the giants of industry stood at a specific moment in time. However, your financial success is not determined by a single day’s percentage change.
By understanding the mechanics of the DJIA, recognizing the difference between market noise and meaningful trends, and maintaining a diversified, long-term perspective, you can turn a simple daily statistic into a powerful tool for financial growth. The Dow will continue to rise and fall, companies will be added and removed, and the “close” will change every 24 hours. Your goal is to ensure that while the index fluctuates, your personal wealth remains on a steady, informed, and strategic path upward.
aViewFromTheCave is a participant in the Amazon Services LLC Associates Program, an affiliate advertising program designed to provide a means for sites to earn advertising fees by advertising and linking to Amazon.com. Amazon, the Amazon logo, AmazonSupply, and the AmazonSupply logo are trademarks of Amazon.com, Inc. or its affiliates. As an Amazon Associate we earn affiliate commissions from qualifying purchases.