For many investors, the question “What did stocks do today?” is a daily ritual, often asked with a mix of curiosity and trepidation. Whether you are a seasoned trader or a passive investor with a 401(k), the daily fluctuations of the market provide a snapshot of the global economy’s health, investor sentiment, and the shifting tides of corporate profitability. However, understanding what the market did today requires more than just looking at a red or green number on a screen; it requires an analysis of the underlying forces that drive price action.
In this comprehensive exploration, we will break down the mechanics of daily market movements, the factors that influence sentiment, and how you can interpret daily data to make better financial decisions without falling prey to short-term noise.
The Mechanics of Daily Market Movement
When we talk about “the market,” we are usually referring to a collection of indices that serve as proxies for the economy. Understanding how these indices function is the first step in decoding a day’s performance.
Key Indices and What They Tell Us
The three most watched indices in the United States—the Dow Jones Industrial Average (DJIA), the S&P 500, and the Nasdaq Composite—each tell a different story.
The Dow Jones is a price-weighted index of 30 “blue-chip” companies. Because it only includes 30 stocks, it is often seen as a pulse of traditional American industry. If the Dow is up while others are down, it might suggest that investors are seeking safety in established, dividend-paying companies.
The S&P 500 is the most widely used benchmark for the overall U.S. stock market. It is market-cap weighted, meaning larger companies like Apple or Microsoft have a bigger impact on its movement. When the S&P 500 moves, it reflects the collective sentiment of the 500 largest publicly traded companies in America.
The Nasdaq Composite is heavily weighted toward the technology and growth sectors. If the Nasdaq is outperforming the other indices today, it usually indicates a “risk-on” environment where investors are optimistic about future innovation and earnings growth.
The Role of Economic Indicators
Market movements are frequently triggered by the release of economic data. On any given day, “what stocks did” might be a direct reaction to reports on inflation (Consumer Price Index), employment (Non-Farm Payrolls), or consumer spending. For instance, if inflation data comes in higher than expected, stocks may sell off because investors anticipate the Federal Reserve will raise interest rates to cool the economy. Conversely, strong jobs data can be a double-edged sword: it shows economic strength, but it also fuels fears of continued high interest rates.
Factors Influencing Today’s Market Sentiment
The stock market is essentially a giant weighing machine of expectations. Prices move when new information forces investors to re-evaluate what a company—or an entire economy—is worth.
Corporate Earnings and Guidance
During “earnings season,” the daily narrative is almost entirely driven by corporate reports. When a major company reports its quarterly results, the market looks at two things: the actual numbers (revenue and profit) and the “guidance.”
Guidance is the company’s own forecast for the future. A company could report record-breaking profits today, but if its CEO warns of a slowdown in the next quarter, the stock price will likely plummet. This “forward-looking” nature of the market explains why stocks sometimes drop even on seemingly good news. Today’s market performance is often a reflection of how well corporate reality matches investor expectations.
Geopolitical Events and Macroeconomic Shifts
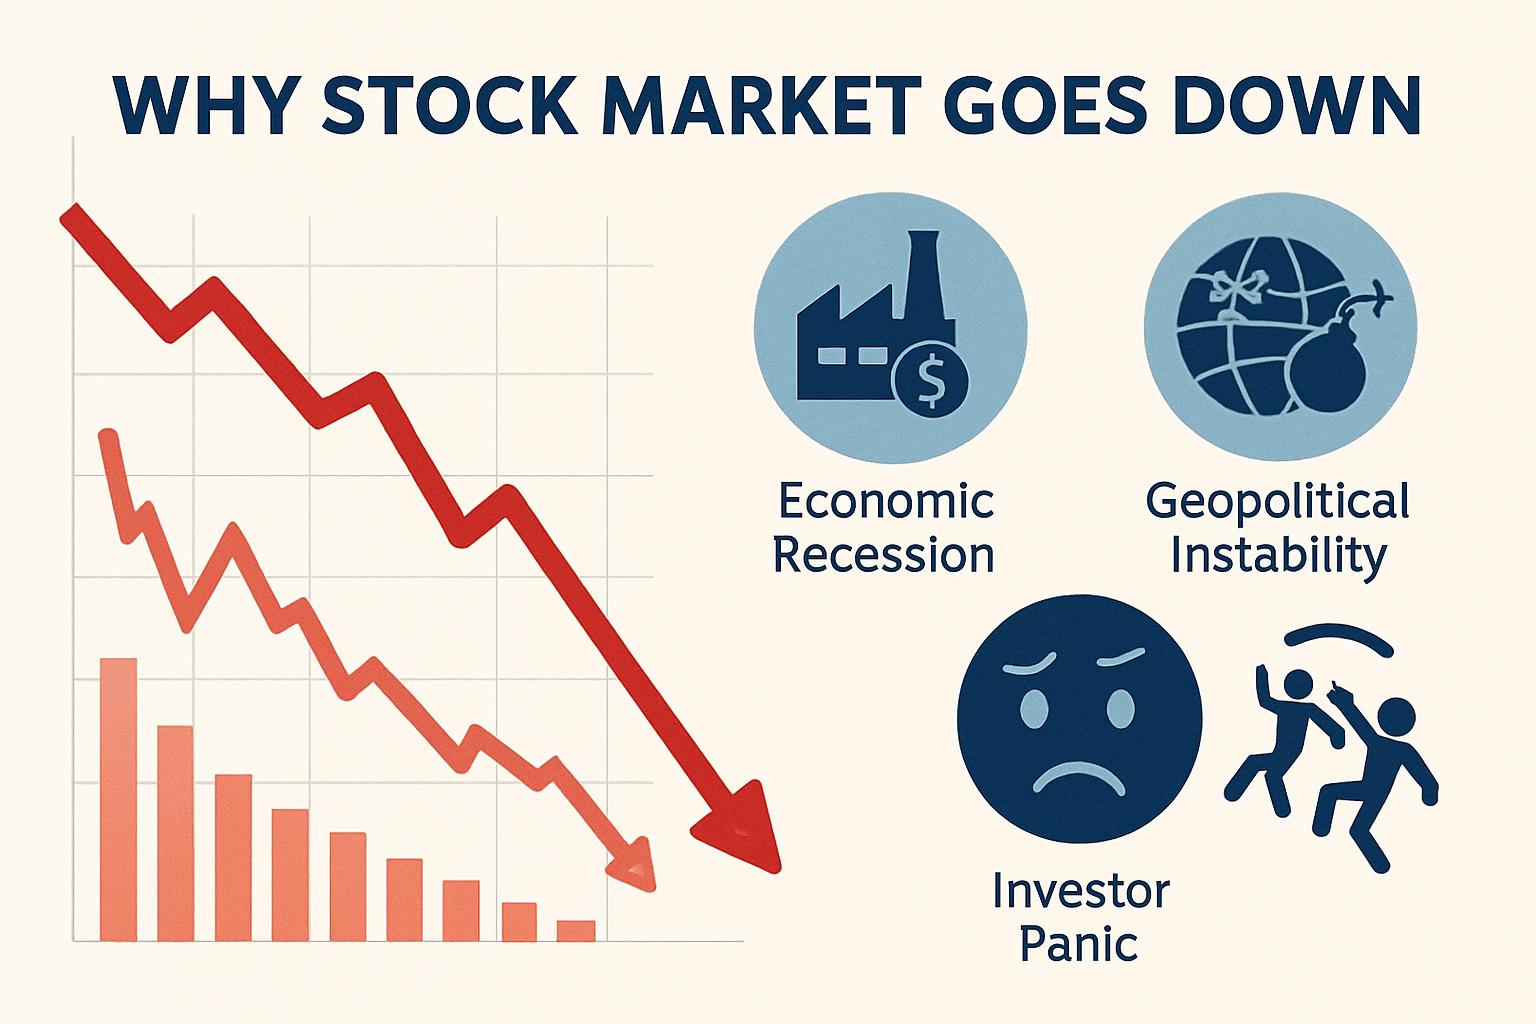
The market does not exist in a vacuum. Geopolitical stability—or the lack thereof—plays a massive role in daily volatility. Tensions in oil-producing regions can spike energy prices, causing a ripple effect across transportation and manufacturing stocks.
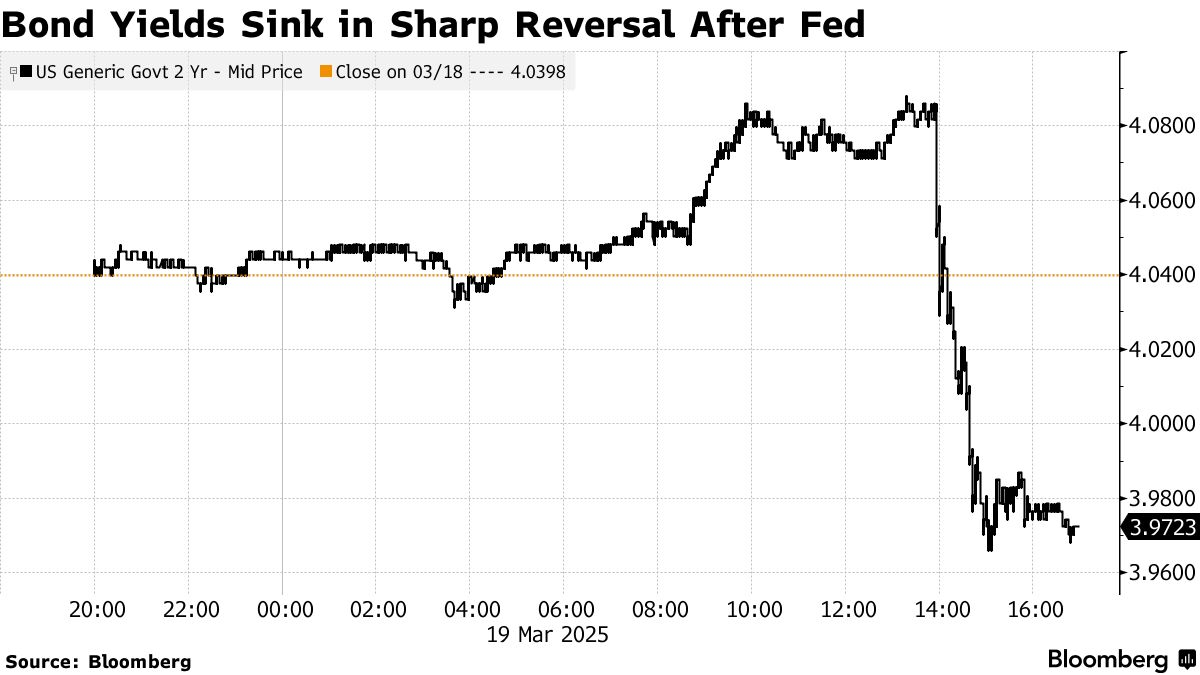
Furthermore, central bank policy remains the most significant driver of market liquidity. The Federal Reserve’s commentary, even outside of scheduled interest rate hikes, can send shockwaves through the market. A single “hawkish” comment (suggesting higher rates) from a Fed official can cause a mid-afternoon sell-off, while a “dovish” tone (suggesting lower rates) can spark a late-day rally.
Decoding Sector Performance
Broad market indices often mask what is happening beneath the surface. To truly understand what stocks did today, one must look at sector rotation—the movement of money from one industry to another.
Growth vs. Value Dynamics
In the financial world, stocks are generally categorized into “Growth” and “Value.” Growth stocks (often tech and biotech) are expected to outpace the market in terms of revenue. They thrive when interest rates are low because their future cash flows are worth more today.
Value stocks (such as banks, energy, and industrials) are companies that appear to be trading for less than their intrinsic worth. On days when the market is “cycling out of tech,” you might see the Nasdaq down while the financial sector is up. This rotation often signals a shift in the broader economic outlook, such as an expectation of rising interest rates or a stabilizing economy.
Defensive Sectors in Volatile Times
When the market is down across the board, “defensive” sectors often stand tall. These include Utilities, Consumer Staples (companies that sell essentials like soap and food), and Healthcare. Because people need these services regardless of the economy, these stocks act as a “safe haven.” Observing which sectors are leading the day can tell you whether the market is in a “risk-on” (aggressive) or “risk-off” (cautious) mood.
The Psychology of Daily Trading vs. Long-Term Investing
While the data of the day is objective, the human reaction to it is often subjective. Understanding the psychology of the “daily snapshot” is vital for maintaining financial sanity.
Overcoming Fear and Greed
The stock market is driven by two primary emotions: fear and greed. On a day when stocks are surging, the “Fear Of Missing Out” (FOMO) can lead investors to buy at the top. On a day when stocks are crashing, panic can lead to selling at the bottom.
“What stocks did today” is often a reflection of these emotional extremes. High volatility—where the market swings wildly in both directions—is a sign of uncertainty. For the disciplined investor, the goal is to view daily movements as data points rather than reasons for emotional reaction.
Why the “Daily Snapshot” Matters (and When It Doesn’t)
For a day trader, today’s movement is everything. For a long-term investor, today’s movement is almost irrelevant to their ultimate goal. However, staying informed about the daily market is still beneficial. It allows you to spot emerging trends, understand the cost of capital, and identify potential buying opportunities.
The danger lies in “checking the scoreboard” too often. Studies have shown that investors who check their portfolios daily are more likely to make impulsive, detrimental trades than those who check quarterly. Today’s market movement is a single frame in a movie that lasts for decades.
Actionable Strategies for Today’s Investor
Knowing what the market did is only half the battle; knowing what to do with that information is where wealth is created.
Rebalancing and Risk Management
If today’s market movement has significantly altered the weight of your portfolio—for example, if a massive tech rally has made your tech holdings 80% of your net worth—it may be time to rebalance. Rebalancing involves selling a portion of your winners and buying underperformers to maintain your original risk profile. This disciplined approach forces you to “buy low and sell high,” which is the fundamental rule of investing that most people struggle to follow.
Leveraging Financial Tools for Real-Time Analysis
In the modern era, you don’t need a Bloomberg Terminal to understand the market. Tools like Yahoo Finance, Morningstar, and various brokerage apps provide “heat maps” that show exactly which sectors are moving and why.
When looking at today’s results, look for the “why” behind the “what.” Did the market drop because of a fundamental economic shift, or was it a “technical correction” after a long period of gains? Use financial news aggregators to cross-reference price movement with news events. This helps you build a mental framework for how different assets react to different stimuli, making you a more resilient investor over time.
Conclusion: Perspective is the Best Investment
At the end of the day, “what stocks did today” is a headline, but your financial plan is the story. The market will always have its days of exuberance and its days of despair. By understanding the indices, monitoring economic indicators, and recognizing the psychological traps of daily volatility, you can move from being a passive observer to an informed participant.
The most successful investors aren’t those who react the fastest to today’s news, but those who can interpret today’s news within the context of the next ten years. Whether the market closed up 2% or down 3% today, the principles of diversification, fundamental analysis, and emotional discipline remain your most valuable assets. Keep your eyes on the daily data, but keep your focus on the long-term horizon.
aViewFromTheCave is a participant in the Amazon Services LLC Associates Program, an affiliate advertising program designed to provide a means for sites to earn advertising fees by advertising and linking to Amazon.com. Amazon, the Amazon logo, AmazonSupply, and the AmazonSupply logo are trademarks of Amazon.com, Inc. or its affiliates. As an Amazon Associate we earn affiliate commissions from qualifying purchases.