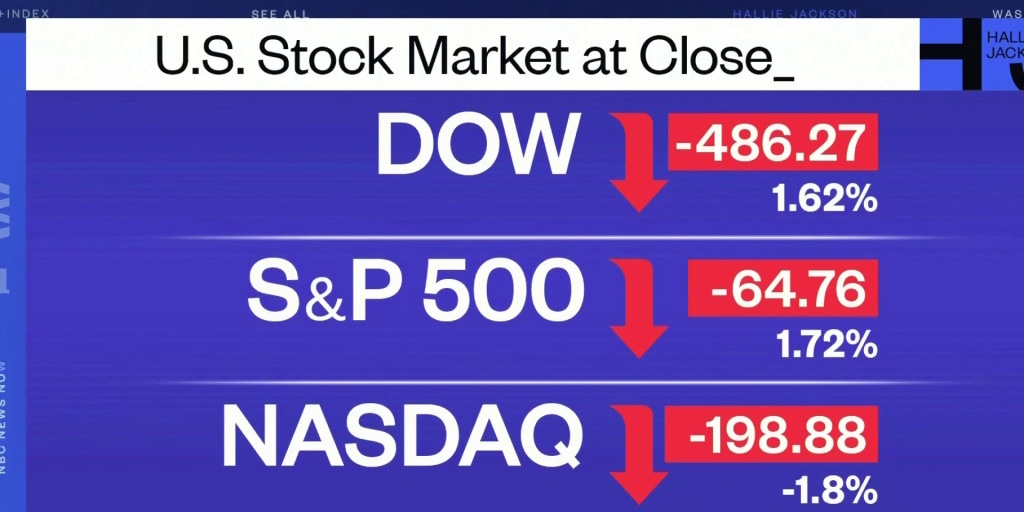
Every afternoon, as the closing bell rings on Wall Street, millions of investors and casual observers alike ask the same fundamental question: “What did the stock market do today?” While the answer can often be distilled into a simple number—the S&P 500 rose 1.2% or the Dow Jones Industrial Average dropped 300 points—the reality behind those figures is a complex tapestry of global economics, investor psychology, and corporate performance.
Understanding what the market did today requires more than just looking at a green or red arrow. It involves dissecting the catalysts that drove the movement, identifying which sectors led the charge, and, most importantly, determining what that movement means for your personal financial strategy. In this deep dive, we explore the mechanics of daily market shifts and how to interpret them through the lens of a sophisticated investor.
Decoding Today’s Market Movements: The Major Indices and Internal Breath
To understand the day’s performance, we must first look at the “Big Three” indices. These benchmarks act as the pulse of the American economy, yet they often tell very different stories based on their underlying components.
The Role of the S&P 500 and the Nasdaq
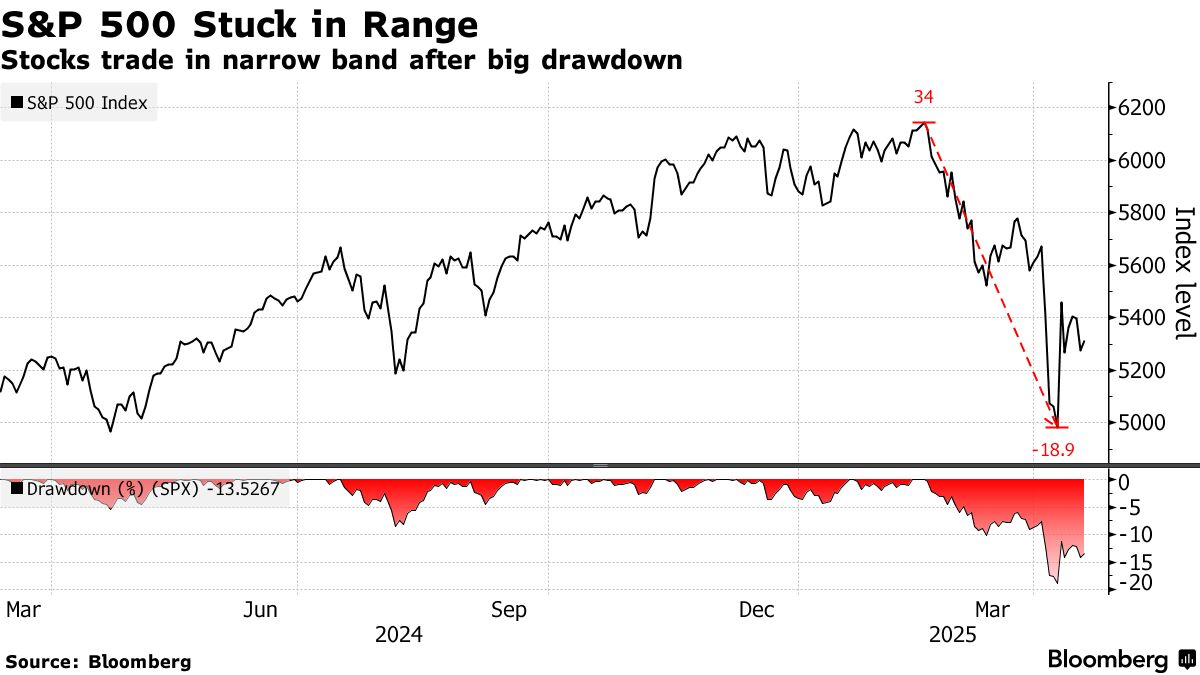
The S&P 500 is widely considered the best single gauge of large-cap U.S. equities. When people ask what the market did, they are usually referring to this index. Because it is market-cap weighted, a few massive technology companies can disproportionately influence its direction. If the S&P 500 rose today despite more stocks falling than rising, it suggests that the “Mega-Cap” names—like Apple, Microsoft, or Nvidia—carried the weight.
In contrast, the Nasdaq Composite is heavily skewed toward the technology and growth sectors. On days when interest rates remain stable or fall, the Nasdaq often outperforms. Conversely, if the Nasdaq lagged today, it might indicate that investors are rotating out of high-valuation growth stocks and into more defensive, “value” plays.
Market Breadth and Sector Performance
A truly insightful look at today’s market requires checking the “breadth.” This refers to how many stocks actually participated in the day’s trend. An index could be up, but if only 30% of its stocks rose, the market is “thin” and potentially fragile.
We also look at sector performance. The market is divided into eleven sectors, such as Energy, Healthcare, and Consumer Discretionary. If the market was down today, but Energy was up, it may signal rising oil prices or geopolitical tensions. If Utilities and Consumer Staples—sectors known as “defensive”—were the only gainers, it suggests that investors were feeling “risk-off,” seeking safety amid uncertainty.
Macroeconomic Catalysts: Why the Market Moved
The stock market does not exist in a vacuum. It reacts instantaneously to data points that hint at the future health of the economy. When we analyze why the market moved today, we almost always find a macroeconomic catalyst at the center.
The Influence of the Federal Reserve and Interest Rates
In the modern era of investing, the Federal Reserve is the most powerful force in the market. Investors spend their days scrutinizing “Fed speak”—the public comments made by central bank officials. If the market surged today, it might be because a Fed governor suggested that interest rate hikes are pausing or that a “pivot” toward rate cuts is on the horizon.
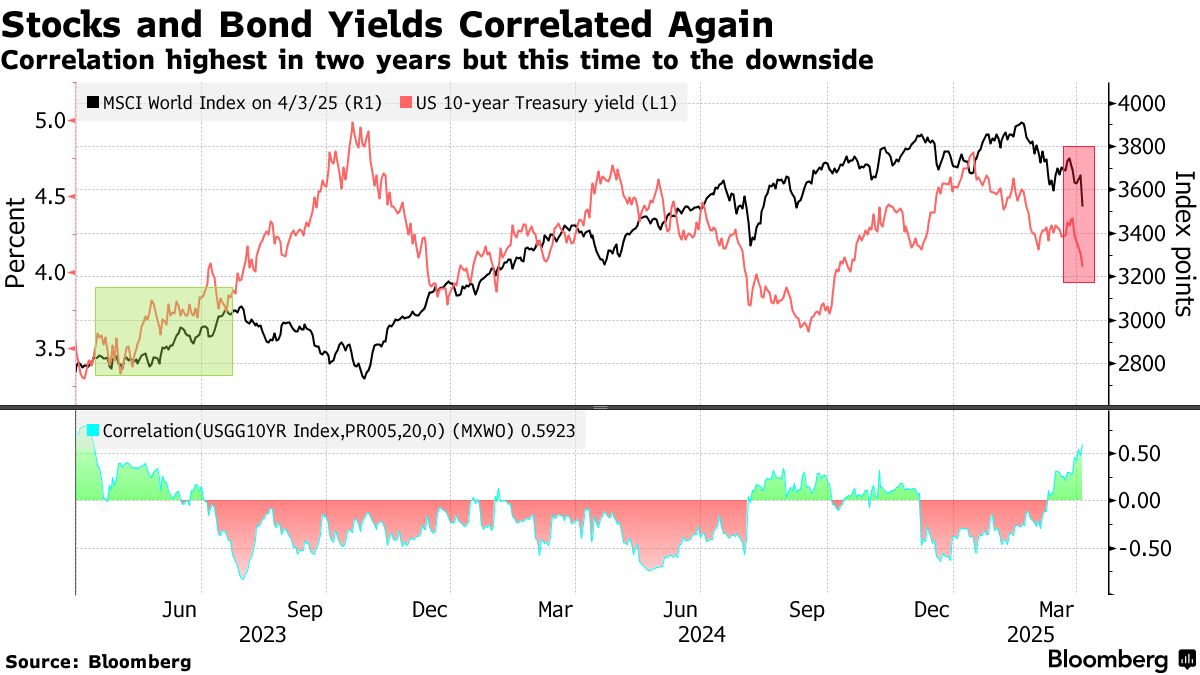
Higher interest rates generally act as a gravitational pull on stock prices; they make borrowing more expensive for companies and make “risk-free” assets like Treasury bonds more attractive compared to stocks. Therefore, today’s market action was likely a direct reaction to the perceived trajectory of the cost of money.
Inflation Data and Employment Reports
Economic reports released in the morning often set the tone for the entire trading day. The Consumer Price Index (CPI) and the Producer Price Index (PPI) are the primary measures of inflation. If today’s data showed that inflation is cooling faster than expected, the market likely rallied on hopes of a more “dovish” central bank.
Employment data, such as the Non-Farm Payrolls report, also plays a critical role. A “hot” jobs report—showing high employment and rising wages—can actually be bad news for the stock market in the short term, as it suggests the economy might be overheating, which could force the Federal Reserve to keep interest rates higher for longer.
Corporate Earnings: The Fundamental Bedrock
While macroeconomics provides the backdrop, corporate earnings are the individual stories that drive the market’s internal mechanics. We are currently in an era where “earnings quality” is paramount.
Why Quarterly Results Move the Needle
Four times a year, during “earnings season,” companies report their financial health to the public. If today’s market saw significant movement in specific stocks, it was likely due to these reports. Investors look at “the beat or the miss”—did the company earn more per share than analysts predicted? Did their revenue grow?
However, a company can report record profits and still see its stock price tumble. This happens when the results were already “priced in,” or when the underlying metrics, such as profit margins, show signs of erosion. The market is forward-looking; it cares less about what a company did in the last three months and more about what it will do in the next twelve.
The Power of Guidance and Forward-Looking Statements
The most important part of an earnings call is often the “guidance”—the company’s own forecast for future performance. If a major retailer warns today that consumer spending is slowing down, it can drag down the entire Consumer Discretionary sector. Conversely, if an AI-focused tech firm raises its revenue outlook, it can ignite a rally across the entire tech landscape. Today’s winners and losers were likely separated by their ability to convince the market that their future growth remains intact.
Navigating the “Noise”: The Psychology of Daily Fluctuations
For the individual investor, “what the market did today” can be a source of significant anxiety. However, professional money management requires a distinction between meaningful signals and temporary noise.
Avoiding the Trap of Day-to-Day Checking
The human brain is wired to find patterns and react to threats. When the market drops 2% in a single day, it feels like a crisis. But in the context of a 10-year investment horizon, a single day’s movement is usually statistically insignificant.
Over-monitoring your portfolio can lead to “loss aversion” bias, where the pain of a loss is felt twice as intensely as the joy of a gain. This often leads to emotional selling—the cardinal sin of personal finance. If the market was volatile today, the best course of action for most long-term investors was likely to do nothing at all.
The Difference Between Volatility and Risk
It is essential to understand that volatility (the speed and magnitude of price changes) is not the same as risk (the permanent loss of capital). Today’s market may have been highly volatile, swinging wildly based on a single news headline. However, if the underlying companies in your portfolio are still profitable and growing, your long-term risk has not necessarily changed. Daily market movements are the price we pay for the long-term returns that equities provide.
Strategic Actions: What to Do With Today’s Information
While reacting emotionally to the market is a mistake, being informed allows you to make strategic adjustments when the time is right.
Rebalancing and Dollar-Cost Averaging
If today’s market movement significantly altered the weight of your portfolio—for example, if a massive tech rally made your portfolio too tech-heavy—it might be a signal to “rebalance.” This involves selling some of your winners and buying assets that have underperformed, effectively “selling high and buying low.”
For those in the accumulation phase of their lives, a “red” day in the market is actually a positive event. Through dollar-cost averaging, your fixed monthly investment buys more shares when prices are lower. Instead of asking “How much did I lose today?”, the savvy investor asks, “How many more shares did I acquire at a discount?”
Monitoring Your Diversification
Today’s market performance often highlights the holes in an investor’s strategy. If your entire portfolio plummeted while the broader market remained flat, it is a sign that you are lacked diversification. True financial health is built on a foundation of uncorrelated assets—stocks, bonds, real estate, and cash—that do not all move in the same direction at the same time.
In conclusion, “what the stock market did today” is a snapshot of a never-ending global auction. While the daily fluctuations are fascinating and provide a wealth of data regarding the current economic climate, they should serve as a tool for insight, not a trigger for impulse. By understanding the indices, the macro drivers, and the corporate fundamentals, you can transform from a passive observer of the market into a disciplined steward of your own financial future.
aViewFromTheCave is a participant in the Amazon Services LLC Associates Program, an affiliate advertising program designed to provide a means for sites to earn advertising fees by advertising and linking to Amazon.com. Amazon, the Amazon logo, AmazonSupply, and the AmazonSupply logo are trademarks of Amazon.com, Inc. or its affiliates. As an Amazon Associate we earn affiliate commissions from qualifying purchases.