
In the fast-paced world of modern finance, the question “What did the stock market do today?” is more than just a casual inquiry; it is a pulse check on the global economy. For the seasoned investor, a single day’s performance can signal the beginning of a new trend or the conclusion of a volatile cycle. For the casual observer, it is often a confusing whirlwind of green and red numbers, ticker symbols, and jargon-heavy commentary.
Understanding the daily movements of the stock market requires looking beyond the closing numbers. It involves analyzing the interplay between indices, interpreting the catalysts behind price shifts, and utilizing the right tools to separate meaningful signals from temporary noise. This article explores the mechanics of daily market performance and provides a framework for understanding what really happens between the opening bell and the final trade.
Understanding Daily Market Indicators and Benchmarks
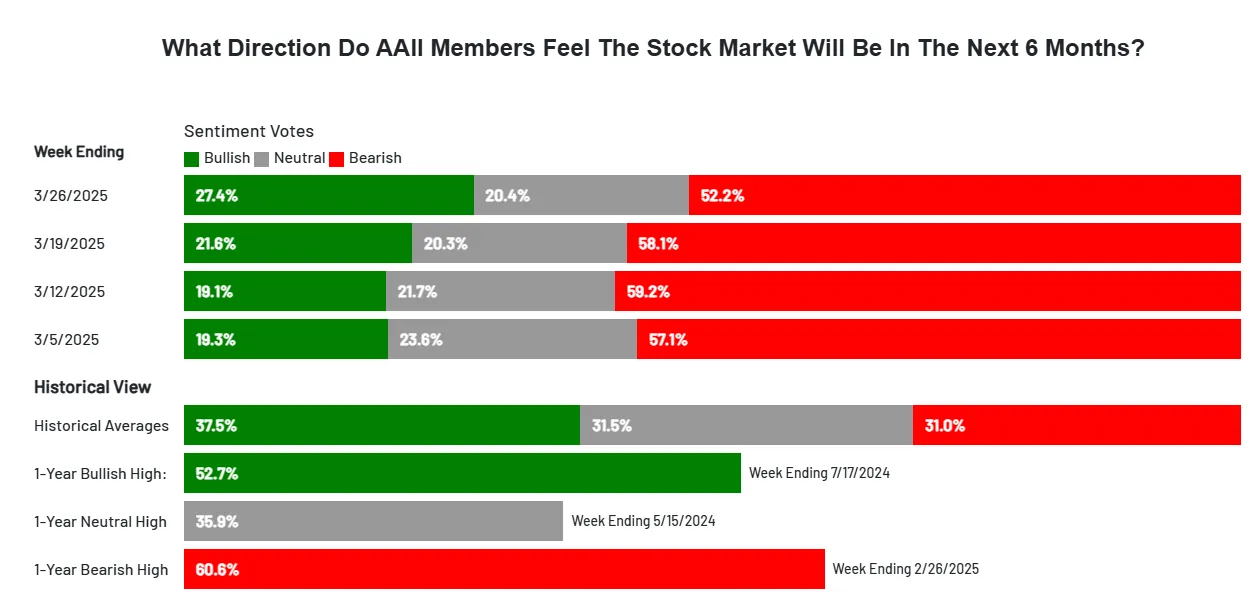
When people ask how the market performed, they are rarely referring to a single company. Instead, they are looking at broad benchmarks that aggregate the performance of hundreds or thousands of stocks. These indices serve as the primary barometers for financial health.
The Role of Major Indices: S&P 500, Dow Jones, and Nasdaq
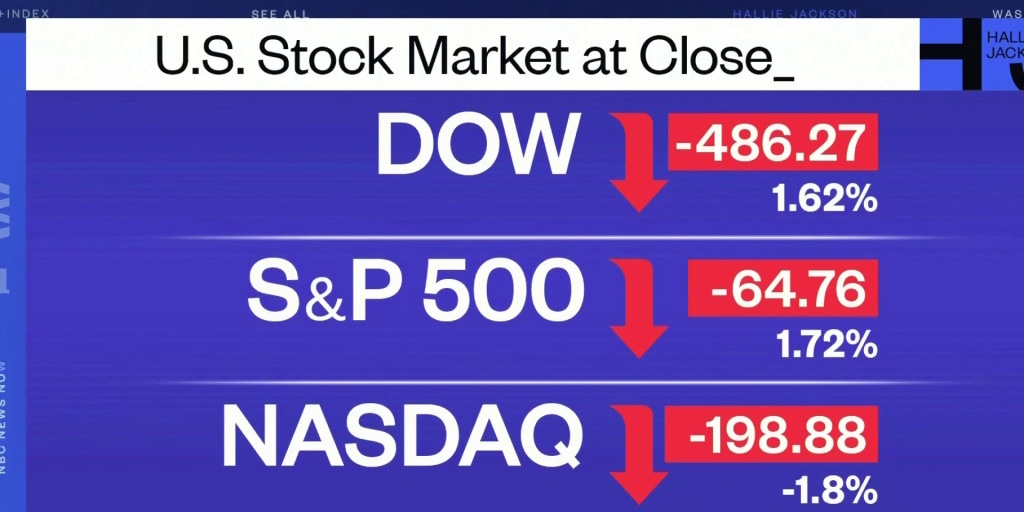
The three most-watched indices in the United States—the S&P 500, the Dow Jones Industrial Average (DJIA), and the Nasdaq Composite—each tell a different story about the day’s trading.
The S&P 500 is widely considered the most accurate representation of the overall U.S. economy because it tracks 500 of the largest publicly traded companies across all sectors. If the S&P 500 is up, it generally indicates broad-based investor confidence. The Dow Jones, composed of 30 “blue-chip” companies, offers a narrower view focused on established industrial and consumer giants. Meanwhile, the Nasdaq is heavily weighted toward technology and growth stocks. On a day when tech is booming but traditional manufacturing is lagging, you might see the Nasdaq soar while the Dow remains flat.
Market Breadth and Sector Performance
A deeper look at daily performance involves “market breadth.” This refers to how many individual stocks participated in the day’s movement. A day where the S&P 500 rises 1% because five massive tech companies surged, while the other 495 stocks fell, is considered a “thin” or “weak” rally. Conversely, “strong breadth” occurs when the majority of stocks across various sectors advance together.
Investors also categorize the market into eleven sectors, such as Energy, Healthcare, and Financials. Analyzing which sectors led or lagged provides insight into the prevailing economic sentiment. For instance, if Defensive sectors like Utilities and Consumer Staples are the only ones in the green, it suggests that investors are nervous and seeking safety.
Decoding Volume and Volatility (VIX)
To understand what the stock market did today, one must also look at “how” it moved. Trading volume—the total number of shares exchanged—indicates the conviction behind a price move. A price jump on high volume suggests strong institutional buying, whereas a move on low volume might be easily reversed.
Furthermore, the CBOE Volatility Index (VIX), often called the “fear gauge,” measures market expectations for near-term volatility. If the market is down and the VIX is spiking, it indicates a high level of uncertainty or panic. If the market is down but the VIX remains stable, it might just be a routine “pullback” or profit-taking session.
The Catalysts Behind Daily Price Movements
Prices do not move in a vacuum. Every daily fluctuation is a reaction to new information being priced into the market. These catalysts generally fall into three categories: macroeconomics, corporate health, and external shocks.
Economic Data Releases and Federal Reserve Policy
The most significant driver of daily market action is often economic data. Reports on inflation (Consumer Price Index), employment (Non-farm Payrolls), and Gross Domestic Product (GDP) are scrutinized by algorithms and human traders alike.
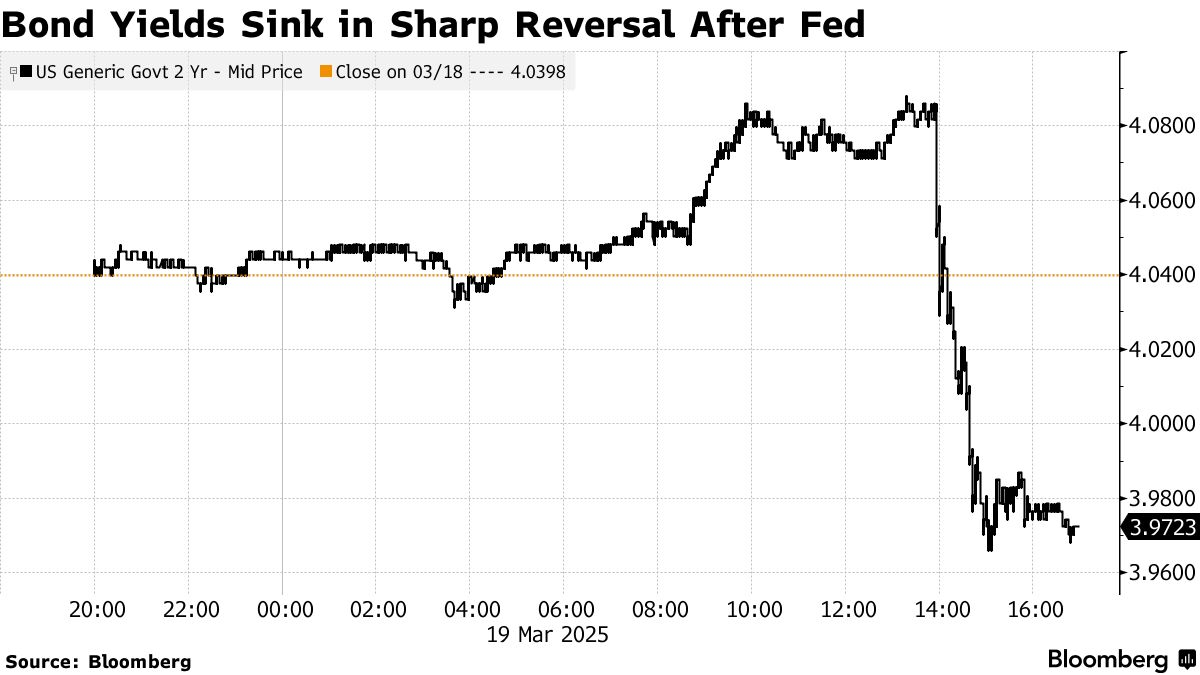
If inflation data comes in higher than expected, the market often reacts negatively because it signals that the Federal Reserve may raise interest rates to cool the economy. Higher interest rates make borrowing more expensive for companies and consumers, which can dampen future earnings. Consequently, a single “hot” inflation report can cause a sharp sell-off in a matter of minutes.
Corporate Earnings Reports and Guidance
While macro data sets the stage, individual company performance provides the drama. During “earnings season,” hundreds of companies report their quarterly financial results. These reports are pivotal because they reveal the actual profitability of the businesses investors own.
However, the market is forward-looking. A company might report record-breaking profits for the past quarter, but if its management provides “weak guidance” (a pessimistic outlook for the future), the stock price may still plummet. When a “mega-cap” company like Apple or Microsoft reports, its individual performance can be large enough to swing the entire S&P 500.
Geopolitical Events and Global Sentiments
In an interconnected global economy, events happening thousands of miles away impact domestic stock prices. Geopolitical tensions, trade disputes, or changes in foreign central bank policies can create ripples. For example, an escalation of conflict in an oil-producing region can send energy prices higher, which might hurt airline stocks but buoy petroleum companies. Understanding what the market did today often requires a glance at the global news cycle to see if external shocks influenced investor behavior.
Tools and Platforms for Real-Time Analysis
In the digital age, individual investors have access to the same real-time data that was once reserved for Wall Street professionals. Utilizing these tools allows for a more nuanced understanding of daily market activity.
Financial News Networks and Terminals
While traditional news outlets provide summaries, dedicated financial platforms like Bloomberg, CNBC, and Reuters offer minute-by-minute updates. For the active investor, these sources provide the “why” behind the “what.” They filter through the noise to identify the specific headline or data point that triggered a sudden market swing.
Mobile Apps and Trading Dashboards
Modern brokerage apps (such as Charles Schwab, Fidelity, or Robinhood) have democratized market data. Most of these platforms provide “Daily Gainers and Losers” lists, which highlight the most volatile stocks of the day. They also offer real-time “Level 2” data, showing the bid and ask prices that represent the immediate supply and demand for a stock.
Utilizing Heat Maps and Technical Charts
Visualizing the market is often more effective than reading a list of numbers. Market Heat Maps (found on sites like Finviz) use color-coded blocks to show the performance of different sectors and companies at a glance. Larger blocks represent larger companies, and the intensity of the green or red color shows the magnitude of the price change.
Technical analysts use candlestick charts to see the “intra-day” story. A candlestick shows where a stock opened, how high and low it went during the day, and where it closed. A long “wick” on the bottom of a candle suggests that although the stock dropped significantly during the day, buyers stepped in to push it back up before the close—a sign of underlying strength.
Developing a Strategic Mindset for Daily Fluctuations
For many, the habit of checking “what the stock did today” can become a source of anxiety. Developing a professional mindset is essential for long-term financial success and emotional well-being.
Distinguishing Between Noise and Signal
The most important skill an investor can develop is the ability to ignore “noise.” Noise consists of the random, short-term fluctuations caused by day traders, algorithms, and temporary headlines that do not change the long-term value of a company. A “signal” is a piece of information that fundamentally alters the investment thesis—such as a permanent change in industry regulation or a breakthrough technology. Most daily movements are noise. If you are a long-term investor, a 1% drop on a Tuesday afternoon is likely irrelevant to your ten-year goal.
The Psychology of “Checking the Ticker”
Behavioral finance teaches us that “loss aversion” makes the pain of a daily loss feel twice as intense as the joy of a daily gain. Constantly checking the market can lead to overtrading—the tendency to buy and sell too frequently based on short-term emotions. Studies have shown that investors who check their portfolios less frequently often achieve higher returns because they are less likely to make panic-driven decisions during a temporary market dip.
Adjusting Your Portfolio Without Overreacting
While daily fluctuations shouldn’t cause panic, they can provide opportunities for strategic “rebalancing.” If a particular sector has had an extraordinary run over several weeks, it might represent a larger portion of your portfolio than you originally intended. A day of high performance might be a good time to trim that position and move funds into a sector that is currently undervalued. This disciplined approach uses daily market movements to your advantage, turning volatility into a tool for risk management rather than a reason for stress.
In conclusion, “what the stock did today” is a multifaceted story of economic data, corporate performance, and human psychology. By understanding the indices, identifying the catalysts, utilizing the right analytical tools, and maintaining a disciplined mindset, you can navigate the daily ebbs and flows of the market with confidence. Whether the day ends in green or red, the informed investor knows that each day is simply one small piece of a much larger financial journey.
aViewFromTheCave is a participant in the Amazon Services LLC Associates Program, an affiliate advertising program designed to provide a means for sites to earn advertising fees by advertising and linking to Amazon.com. Amazon, the Amazon logo, AmazonSupply, and the AmazonSupply logo are trademarks of Amazon.com, Inc. or its affiliates. As an Amazon Associate we earn affiliate commissions from qualifying purchases.