In the vast and ever-evolving landscape of technology and data science, making informed decisions often hinges on the ability to extract meaningful insights from raw data. While quantitative metrics like averages and medians are crucial, a significant portion of the digital world operates on categorical data – choices, classifications, groups, and attributes. This is where statistical tools like the Chi-Square (χ²) test become indispensable. Far from being an arcane academic exercise, the Chi-Square test is a versatile, powerful, and surprisingly intuitive tool for anyone working with data, particularly in tech environments where A/B testing, user analytics, and machine learning feature engineering are daily realities.

This article will demystify the Chi-Square test, explaining its core principles, outlining its primary applications in technology and data science, discussing its practical implementation, and situating it within the broader data ecosystem. Understanding when and how to wield this statistical workhorse empowers professionals to validate hypotheses, identify relationships, and ultimately drive data-backed innovation.
The Core Principle: Understanding Categorical Data and Hypothesis Testing
At its heart, the Chi-Square test is designed to work with categorical data, which represents qualities or characteristics that cannot be meaningfully expressed numerically. Before diving into its uses, it’s vital to grasp this distinction and the underlying statistical framework.
Distinguishing Categorical from Quantitative Data
Data can broadly be classified into two types: quantitative and categorical.
- Quantitative Data involves numerical values that can be measured or counted (e.g., age, income, website load time, number of clicks). This data can be subjected to arithmetic operations, and often follows distributions that allow for parametric tests like t-tests or ANOVA.
- Categorical Data represents groups or categories (e.g., gender, country of origin, type of operating system, preferred color scheme, yes/no responses). This data can be further subdivided into:
- Nominal Data: Categories with no intrinsic order (e.g., colors, device types).
- Ordinal Data: Categories with a meaningful order but uneven intervals (e.g., customer satisfaction ratings: “poor,” “fair,” “good,” “excellent”).
Traditional parametric tests are often unsuitable for categorical data because means and standard deviations might not be meaningful or interpretable in the same way. The Chi-Square test provides a robust alternative by focusing on frequencies and proportions within these categories.
The Null and Alternative Hypotheses
Like most statistical tests, the Chi-Square operates within the framework of hypothesis testing. This involves setting up two competing statements about a population parameter:
- The Null Hypothesis (H₀): This is the default assumption, stating there is no effect, no relationship, or no difference between groups or distributions. For Chi-Square tests, H₀ typically posits that variables are independent, or that observed frequencies fit an expected distribution.
- The Alternative Hypothesis (H₁ or Hₐ): This is what the researcher is trying to prove, stating that there is an effect, a relationship, or a difference. For Chi-Square, H₁ would suggest that variables are dependent, or that the observed frequencies significantly deviate from the expected.
The Chi-Square test then helps us determine whether the evidence from our sample data is strong enough to reject the null hypothesis in favor of the alternative, usually based on a predefined significance level (e.g., p < 0.05).
Expected vs. Observed Frequencies
The fundamental calculation of a Chi-Square test revolves around comparing observed frequencies with expected frequencies.
- Observed Frequencies (O): These are the actual counts or proportions from your collected sample data for each category.
- Expected Frequencies (E): These are the counts or proportions you would expect to see in each category if the null hypothesis were true (i.e., if there was no relationship or difference, or if the data perfectly matched a theoretical distribution).
The Chi-Square statistic quantifies the discrepancy between these observed and expected frequencies. A larger difference between O and E leads to a larger Chi-Square value, making it more likely that the null hypothesis will be rejected. The formula, though often handled by software, conceptually involves summing the squared differences between observed and expected counts, normalized by the expected counts: Σ((O – E)² / E).
Key Applications of Chi-Square Tests in Tech and Data Science
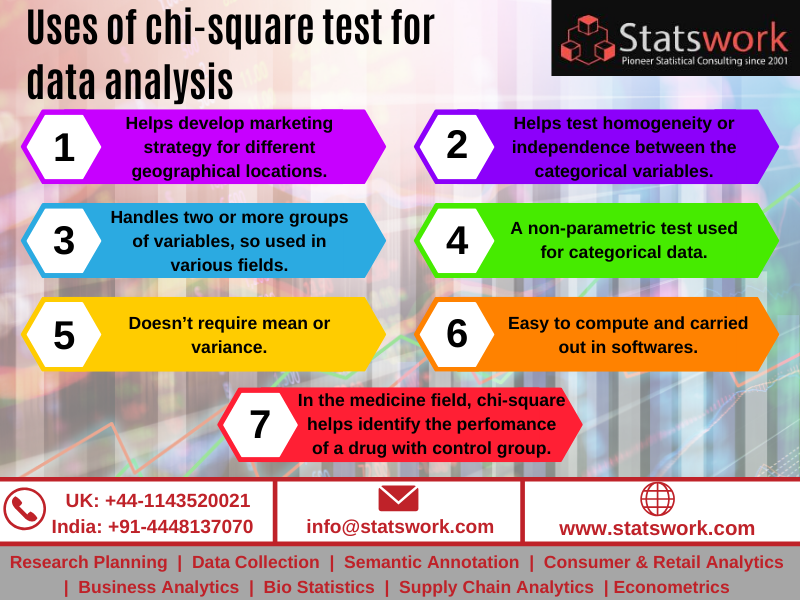
The versatility of the Chi-Square test manifests in its two primary forms: the Goodness-of-Fit test and the Test of Independence (which includes the Test of Homogeneity as a variant). Both have profound implications across various tech domains.
Goodness-of-Fit Test: Evaluating Distributions
The Chi-Square Goodness-of-Fit test is used to determine whether an observed frequency distribution matches an expected theoretical distribution.
- Use Case: Does the data collected from a sample fit a specific pattern or proportion hypothesized for the population?
- Tech Example 1 (User Acquisition): A marketing team expects that user sign-ups should be evenly distributed across four different referral channels (e.g., social media, search engine, direct, partner referral). After running a campaign, they observe specific counts for each channel. A Goodness-of-Fit test can determine if the observed distribution of sign-ups significantly deviates from the expected uniform distribution, indicating that some channels are performing better or worse than anticipated.
- Tech Example 2 (Random Number Generators): Developers of gaming software or security algorithms rely on truly random number generation. A Goodness-of-Fit test can be applied to sequences of numbers generated by an algorithm to check if their observed distribution (e.g., frequency of each digit 0-9) aligns with a theoretical uniform distribution, ensuring the generator is indeed producing random outputs.
Test of Independence: Uncovering Relationships Between Variables
The Chi-Square Test of Independence is arguably its most common application, used to determine if there is a statistically significant relationship between two categorical variables.
- Use Case: Are two categorical variables related, or are they independent of each other?
- Tech Example 1 (A/B Testing): In A/B testing, a common scenario is to compare the conversion rates (e.g., “converted” vs. “not converted”) between two variants of a webpage (e.g., “Variant A” vs. “Variant B”). The Chi-Square test can determine if the observed difference in conversion rates between the two groups is statistically significant, or if it could simply be due to random chance. This helps product managers decide which variant to deploy.
- Tech Example 2 (User Behavior Analytics): A product team might want to know if there’s a relationship between the type of device a user employs (e.g., mobile, tablet, desktop) and their engagement with a new feature (e.g., “used feature” vs. “did not use feature”). A Test of Independence would reveal if device type and feature engagement are independent or if a significant association exists, guiding design choices for different platforms.
- Tech Example 3 (Churn Analysis): Is customer churn (“churned” vs. “retained”) independent of the operating system they primarily use (e.g., iOS vs. Android vs. Web)? Identifying such relationships can help target retention efforts more effectively.
Homogeneity Test: Comparing Population Distributions
While often conceptually similar to the test of independence and sharing the same calculation, the Chi-Square Test of Homogeneity differs in its sampling design. It asks if two or more independent samples come from populations with the same distribution of a single categorical variable.
- Use Case: Do different populations have the same distribution for a categorical variable?
- Tech Example: A global tech company launches the same marketing campaign in two different regions, North America and Europe. They collect data on the primary way users heard about their product (e.g., “social media,” “online ad,” “word-of-mouth”). A Test of Homogeneity would assess whether the distribution of “how users heard about us” is the same across both regions, indicating if the campaign’s impact on awareness channels is consistent globally.
Practical Implementations and Technical Considerations
While the underlying statistics can seem daunting, modern software tools make implementing Chi-Square tests remarkably straightforward, freeing analysts to focus on interpretation rather than manual calculation.
Calculation at a Glance and P-Value Interpretation
The Chi-Square statistic itself is a single value that summarizes the discrepancy between observed and expected frequencies. This value, along with the degrees of freedom (a measure related to the number of categories being compared), is then used to determine a p-value.
- Degrees of Freedom (df): For a Goodness-of-Fit test, df = number of categories – 1. For a Test of Independence, df = (number of rows – 1) * (number of columns – 1).
- P-value: This is the probability of observing data as extreme as, or more extreme than, your sample data if the null hypothesis were true.
- If p < α (significance level, typically 0.05), you reject the null hypothesis, concluding there is a statistically significant relationship or difference.
- If p ≥ α, you fail to reject the null hypothesis, meaning there isn’t enough evidence to conclude a relationship or difference exists.
Software Tools and Libraries
Data scientists and analysts rarely calculate Chi-Square by hand. Programming languages and statistical software streamline the process:
- Python: Libraries like
scipy.stats(specificallychi2_contingencyfor independence andchisquarefor goodness-of-fit) andpandasfor data manipulation are standard. - R: R’s base installation includes functions like
chisq.test()which handles both types of tests. - SQL: While not a statistical package, SQL can be used to aggregate data into the necessary contingency tables, which can then be fed into Python or R.
- Spreadsheet Software: Tools like Excel can perform basic Chi-Square tests, but they are less flexible and scalable for larger, more complex datasets common in tech.
Assumptions and Limitations
Like all statistical tests, the Chi-Square test has specific assumptions that must be met for its results to be valid:
- Independence of Observations: Each observation or participant must be independent of the others. For instance, one user’s action should not influence another’s.
- Expected Frequencies: The expected frequency for each cell in the contingency table should ideally be 5 or greater. If many cells have very low expected counts, the Chi-Square approximation becomes less reliable, and alternative tests (e.g., Fisher’s Exact Test) might be more appropriate.
- Sample Size: A sufficiently large sample size is required for the Chi-Square approximation to be valid.
It’s also important to remember that a significant Chi-Square result only tells you that a relationship exists; it doesn’t indicate the strength or direction of that relationship. For that, other measures like Cramer’s V or odds ratios might be used.
Chi-Square in the Broader Data Science Ecosystem
Beyond its direct applications, the Chi-Square test integrates seamlessly into larger data science workflows, empowering better decision-making and model building.
Enhancing A/B Testing Outcomes
A/B testing is a cornerstone of product development and marketing in tech. While simple percentage comparisons can give a raw idea, the Chi-Square test provides the statistical rigor needed to confirm whether observed differences in conversion rates, click-through rates, or engagement metrics are truly significant. By analyzing the categorical outcomes (e.g., “clicked” vs. “didn’t click” across “Variant A” vs. “Variant B”), the Chi-Square test helps teams avoid launching changes based on random fluctuations, ensuring that product iterations are genuinely improving user experience or business objectives.
Feature Selection for Machine Learning
In machine learning, selecting the most relevant features is crucial for building accurate and efficient models. When dealing with categorical features and a categorical target variable (e.g., predicting customer churn based on product tier, region, or operating system), the Chi-Square test can serve as an effective feature selection method. It quantifies the degree of dependence between each categorical feature and the target variable. Features with a high Chi-Square statistic (and thus low p-value) are strongly related to the target, indicating they are good candidates for inclusion in a model, helping to reduce dimensionality and improve model performance.
User Behavior Analytics and Product Development
Understanding how users interact with a product is paramount for its success. Chi-Square tests enable product managers and UX researchers to:
- Identify Segment-Specific Patterns: Are users from a particular demographic or using a specific device more likely to adopt a new feature or engage with a particular part of the application?
- Validate Hypotheses: If a new design element is introduced, is the distribution of user interaction types (e.g., “skipped tutorial,” “completed tutorial,” “revisited tutorial”) significantly different than before?
- Inform Prioritization: Data from Chi-Square tests can help prioritize feature development or bug fixes by identifying user groups or interaction patterns that are disproportionately affected or engaged.
Conclusion
The Chi-Square test, in its various forms, stands as a fundamental pillar in the analytical toolkit of any data professional operating within the technology domain. From rigorously validating the success of A/B tests and identifying crucial features for machine learning models to unraveling complex user behavior patterns, its ability to analyze categorical data provides invaluable clarity. In a world increasingly driven by data, understanding and effectively applying statistical tests like the Chi-Square empowers individuals and organizations to move beyond mere observation to truly insightful, data-driven decision-making, fueling innovation and competitive advantage in the digital age. Mastering the Chi-Square test is not just about crunching numbers; it’s about making sense of the categorical chaos, transforming raw data into actionable intelligence.
aViewFromTheCave is a participant in the Amazon Services LLC Associates Program, an affiliate advertising program designed to provide a means for sites to earn advertising fees by advertising and linking to Amazon.com. Amazon, the Amazon logo, AmazonSupply, and the AmazonSupply logo are trademarks of Amazon.com, Inc. or its affiliates. As an Amazon Associate we earn affiliate commissions from qualifying purchases.