The question “what are the stock markets doing today?” is perhaps the most frequently asked query in the world of finance. For the seasoned day trader, the answer dictates their immediate moves. For the long-term investor, it provides a pulse check on their retirement savings. For the casual observer, it is a barometer of the global economy’s health. However, understanding what the markets are doing requires looking beyond the green and red flashing numbers on a screen. It involves deciphering the complex interplay of economic data, corporate performance, and investor psychology.
In today’s volatile financial landscape, “market activity” is a multifaceted concept. It encompasses the movement of major indices like the S&P 500 and the Dow Jones, the fluctuating yields of treasury bonds, and the shifting sentiment of institutional and retail investors alike. To truly understand today’s market, one must look at the underlying drivers that propel these shifts.
Understanding Daily Market Drivers: Why the Numbers Move
The stock market does not move in a vacuum. Every tick up or down is a reaction to a piece of information, whether it is a government report, a corporate announcement, or a shift in global politics. When we ask what the markets are doing today, we are essentially asking how the world is processing new information.
Macroeconomic Indicators and Central Bank Policy
The single most influential factor in today’s markets is often the direction of interest rates, dictated by the Federal Reserve (the Fed) in the United States and similar central banks globally. Investors keep a microscopic watch on inflation data—specifically the Consumer Price Index (CPI) and Personal Consumption Expenditures (PCE). If inflation is higher than expected, the market often reacts negatively, fearing that the Fed will raise interest rates to cool the economy. Conversely, cooling inflation can spark a “relief rally.”
Interest rates are the “gravity” of the stock market. When rates are high, the cost of borrowing for companies increases, and the discounted value of future earnings decreases, leading to lower stock valuations. Today’s market movements are frequently a direct response to whether investors believe the “cost of money” is going up or down.
Corporate Earnings Reports: The Pulse of Wall Street
Beyond the macro data, the micro data—individual company performance—plays a massive role. During earnings season, the market’s direction can be dictated by a handful of “mega-cap” companies. If tech giants or major retailers report earnings that beat analyst expectations and provide strong future guidance, they can lift the entire index. However, even a company that reports a profit might see its stock drop if its outlook for the next quarter is “soft.” Today’s investors are forward-looking; they care less about what a company did in the last three months and much more about what it will do in the next six.
Geopolitical Events and Global Sentiment
In an interconnected global economy, events on the other side of the world can dictate what the stock markets are doing today in New York or London. Trade tensions, energy supply disruptions, or regional conflicts create uncertainty. Markets generally dislike uncertainty more than they dislike bad news. When geopolitical risks rise, we often see a “flight to safety,” where investors pull money out of volatile stocks and move it into “safe-haven” assets like gold or government bonds.
Key Indices to Watch: Measuring Market Performance
To answer what the market is doing, one must know which “market” is being discussed. Professionals track specific indices to get a filtered view of different sectors of the economy.
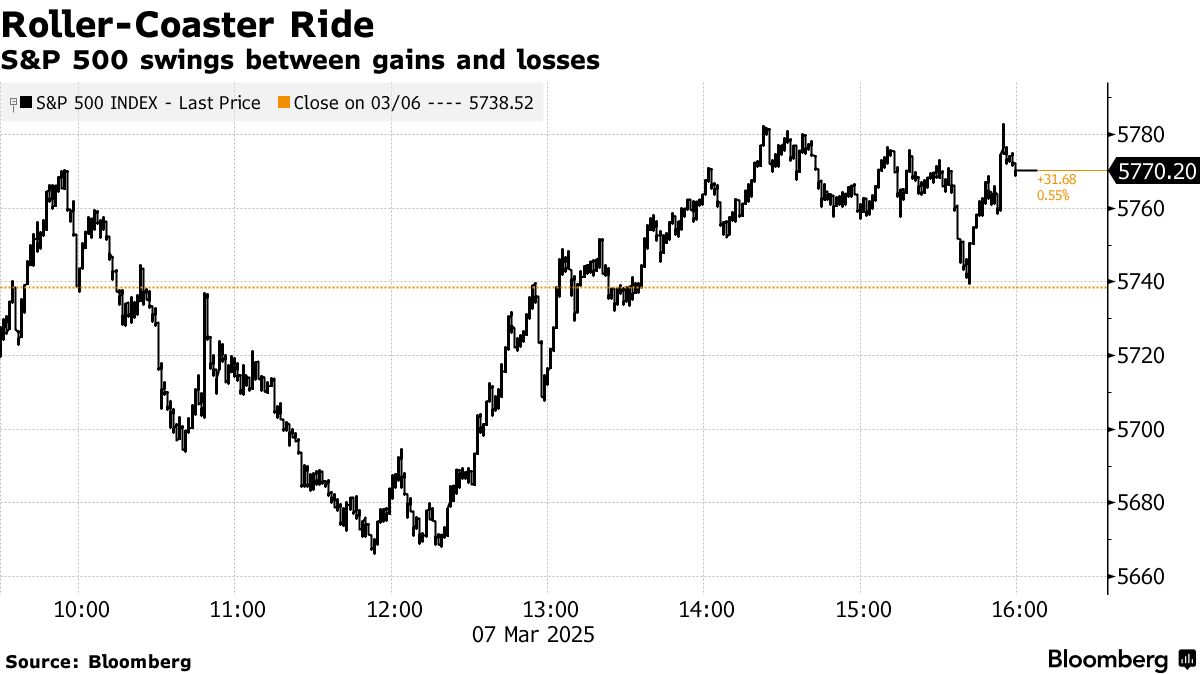
The S&P 500: The Broader Market Barometer
The Standard & Poor’s 500 is the most widely followed index for a reason. It tracks the 500 largest publicly traded companies in the U.S. and covers approximately 80% of the available market capitalization. When people say “the market is up today,” they are usually referring to the S&P 500. Because it is market-cap weighted, the performance of the largest companies (like Apple, Microsoft, and Amazon) has a disproportionate impact on the index. Following the S&P 500 gives an investor a sense of how the core of the American corporate engine is performing.
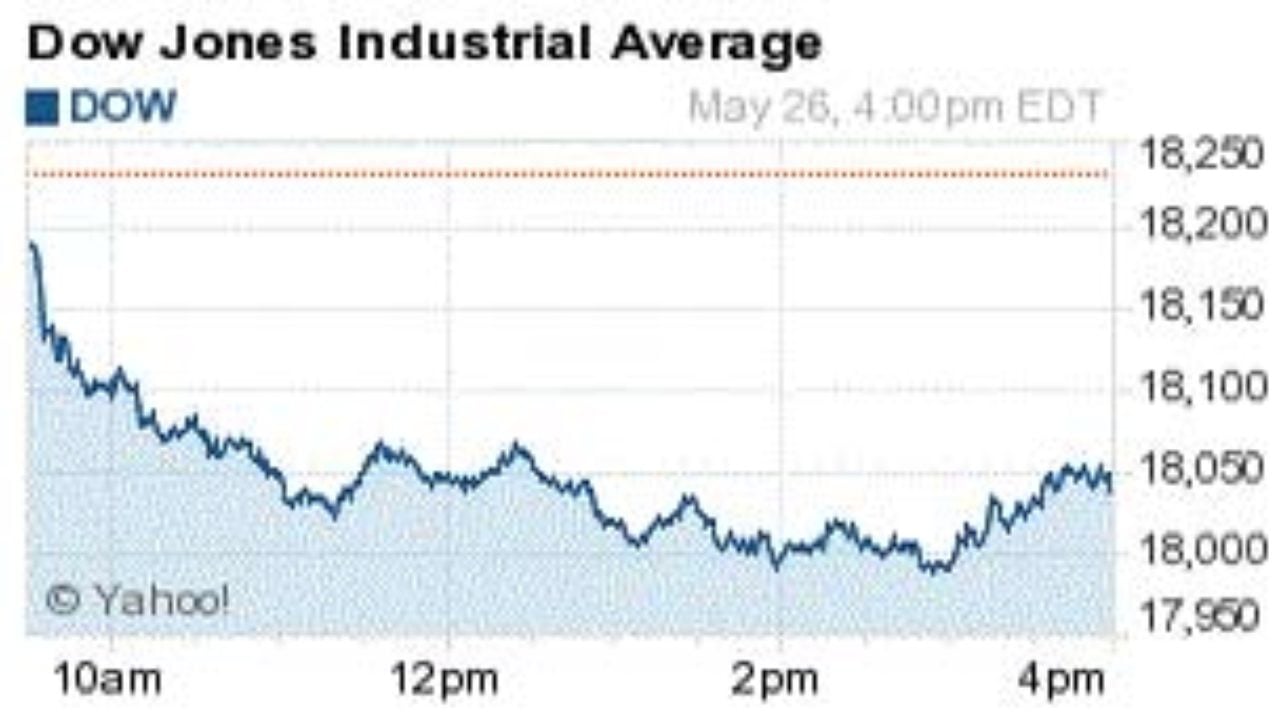
The Dow Jones Industrial Average: Tracking Blue-Chip Stability
The Dow is a price-weighted index of 30 prominent companies. While it is less representative of the total market than the S&P 500, it remains a vital indicator of “Blue-Chip” health. It focuses on established leaders in various industries, from healthcare to consumer goods. If the Dow is performing well while the Nasdaq is struggling, it suggests a “value rotation,” where investors are moving away from risky growth stocks and toward stable, dividend-paying companies.
The Nasdaq Composite: A Window into Growth and Innovation
The Nasdaq is heavily weighted toward the technology, biotech, and growth sectors. When analyzing what the markets are doing today, the Nasdaq provides insight into investor “risk appetite.” Because many companies on the Nasdaq rely on future growth, they are highly sensitive to interest rate changes. A surging Nasdaq often indicates a high level of investor confidence and a willingness to speculate on future innovation.
Sector Performance and the Concept of Market Rotation
A “flat” day for the overall market can hide significant internal movement. Understanding sector performance is crucial for any investor looking to maximize their portfolio’s efficiency.
Cyclical vs. Defensive Sectors
Market sectors are generally divided into cyclical and defensive categories. Cyclical sectors, such as Consumer Discretionary (travel, luxury goods) and Industrials, thrive when the economy is expanding and consumers are spending. Defensive sectors, such as Utilities, Healthcare, and Consumer Staples (groceries, household goods), tend to hold steady regardless of the economic climate.
If you notice today that the S&P 500 is stagnant but the Utilities sector is up 2%, it is a sign that investors are becoming “defensive.” They are moving money into “safe” stocks because they anticipate a slowdown or increased volatility ahead.
The Role of Technology and the AI Influence
In recent months, the technology sector has dominated market narratives. The explosion of interest in Artificial Intelligence (AI) has created a concentrated rally in semiconductor stocks and software providers. Often, what the market is “doing” today is simply following the trajectory of a few AI-related leaders. As a savvy investor, it is important to distinguish between a broad-based market rally and a concentrated rally driven by a single technological trend.
Tools and Resources for Real-Time Financial Analysis
In the modern era, you don’t need a Bloomberg Terminal to know what the stock markets are doing. A variety of digital tools allow individual investors to perform professional-grade analysis.
Financial News Platforms and Real-Time Data
Websites like Yahoo Finance, CNBC, and MarketWatch provide real-time quotes and breaking news. However, the value lies in the “Economic Calendar” these sites provide. By checking the calendar, you can see if a major report—like the Jobs Report or a Fed announcement—is scheduled for today. This helps you anticipate volatility before it happens.
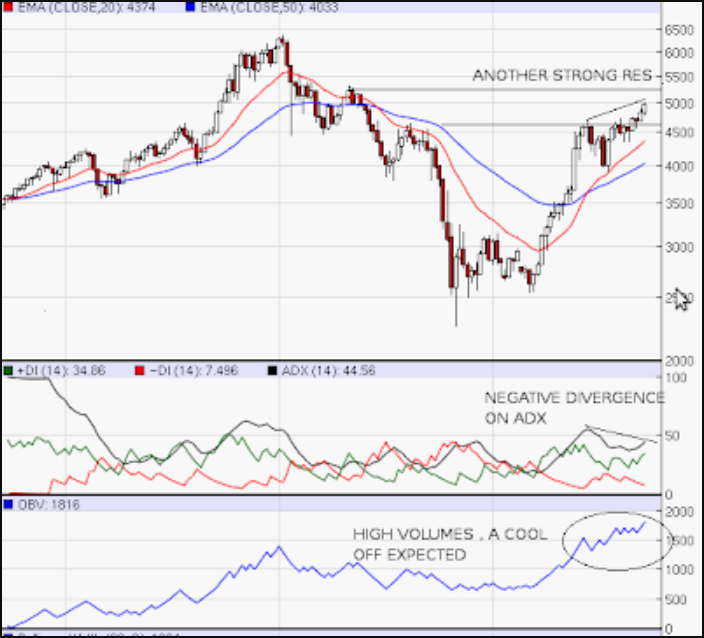
Technical Analysis and Charting Tools
For those who want to look deeper than the headlines, technical analysis tools like TradingView or Thinkorswim allow users to track price action, moving averages, and volume. Technical analysis doesn’t predict the future, but it helps identify “support” and “resistance” levels. If the S&P 500 is approaching a historical high, these tools can show whether there is enough “buying pressure” to break through to new heights or if the market is likely to pull back.
Strategic Responses: How to React to Today’s Market
Knowing what the markets are doing is only half the battle; the more important part is knowing how to react. In the world of personal finance, the best reaction is often no reaction at all.
Avoiding the Trap of Emotional Trading
The stock market is a machine designed to transfer money from the impatient to the patient. When the market is “bleeding” (showing heavy losses), the natural human instinct is to sell to protect what is left. Conversely, when the market is “mooning” (rising rapidly), the instinct is to buy in for fear of missing out (FOMO). Professional investors ignore these emotional impulses. They understand that daily fluctuations are mostly “noise” and that the “signal” is the long-term upward trajectory of productive businesses.
Rebalancing and Dollar-Cost Averaging
Rather than trying to “time” what the market is doing today, successful investors utilize strategies like Dollar-Cost Averaging (DCA). By investing a fixed amount of money at regular intervals, you naturally buy more shares when prices are low and fewer when prices are high.
Additionally, use the market’s movements as a cue to rebalance. If a massive tech rally has made your portfolio 80% technology stocks when your target was 60%, today might be the day to sell some winners and move that money into undervalued sectors. This “sell high, buy low” approach is the cornerstone of disciplined wealth building.
Conclusion: The Bigger Picture of Market Fluctuations
What the stock markets are doing today is a snapshot in time—a single frame in a movie that spans decades. While it is important to stay informed and understand the catalysts behind daily price movements, the most successful participants in the financial markets are those who maintain a perspective beyond the 24-hour news cycle.
Whether the market is up or down today, the principles of sound investing remain the same: diversification, risk management, and a focus on long-term value. By understanding the “why” behind the “what,” you move from being a spectator of the market to an informed participant in your own financial future.
aViewFromTheCave is a participant in the Amazon Services LLC Associates Program, an affiliate advertising program designed to provide a means for sites to earn advertising fees by advertising and linking to Amazon.com. Amazon, the Amazon logo, AmazonSupply, and the AmazonSupply logo are trademarks of Amazon.com, Inc. or its affiliates. As an Amazon Associate we earn affiliate commissions from qualifying purchases.