The question “What are stocks doing today?” is perhaps the most frequently asked query in the world of finance. For the casual observer, it is a curiosity about the health of the economy. For the day trader, it is a matter of immediate profit and loss. For the long-term investor, it is a single data point in a decades-long journey. However, understanding what stocks are doing on any given day requires more than just looking at a green or red number on a screen. It requires an analysis of indices, macroeconomic signals, and the psychological forces that drive buying and selling.
To truly understand today’s market action, one must look beneath the surface of the headlines. Markets are complex ecosystems influenced by interest rates, corporate earnings, geopolitical stability, and technological shifts. This article breaks down the components of daily market performance, the drivers behind the fluctuations, and how you should interpret these movements to benefit your personal financial strategy.
1. Decoding Today’s Market Indicators: The Pulse of the Exchange
When people ask what stocks are doing, they are usually referring to the performance of the major indices. These indices act as a proxy for the thousands of individual stocks trading on the exchanges. By looking at these benchmarks, we can get a bird’s-eye view of where capital is flowing.
Major Indices: S&P 500, Dow Jones, and Nasdaq
The three most watched indices in the United States—and arguably the world—are the S&P 500, the Dow Jones Industrial Average (DJIA), and the Nasdaq Composite.
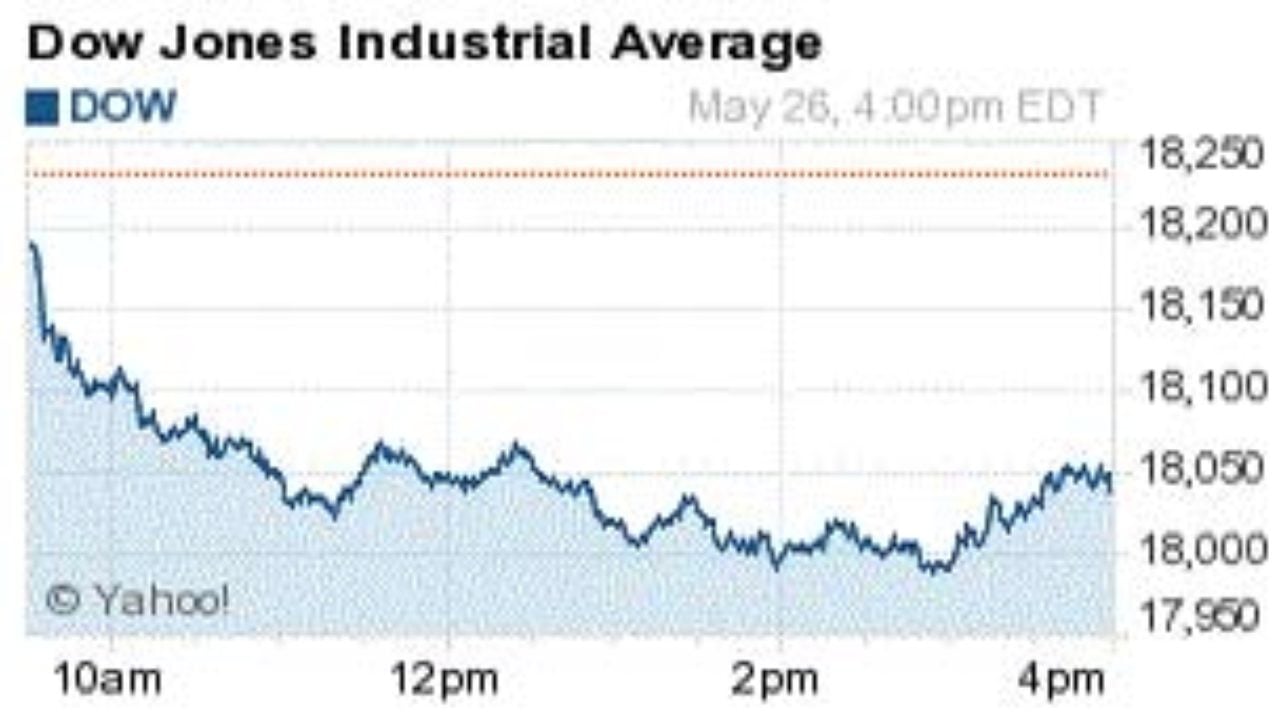
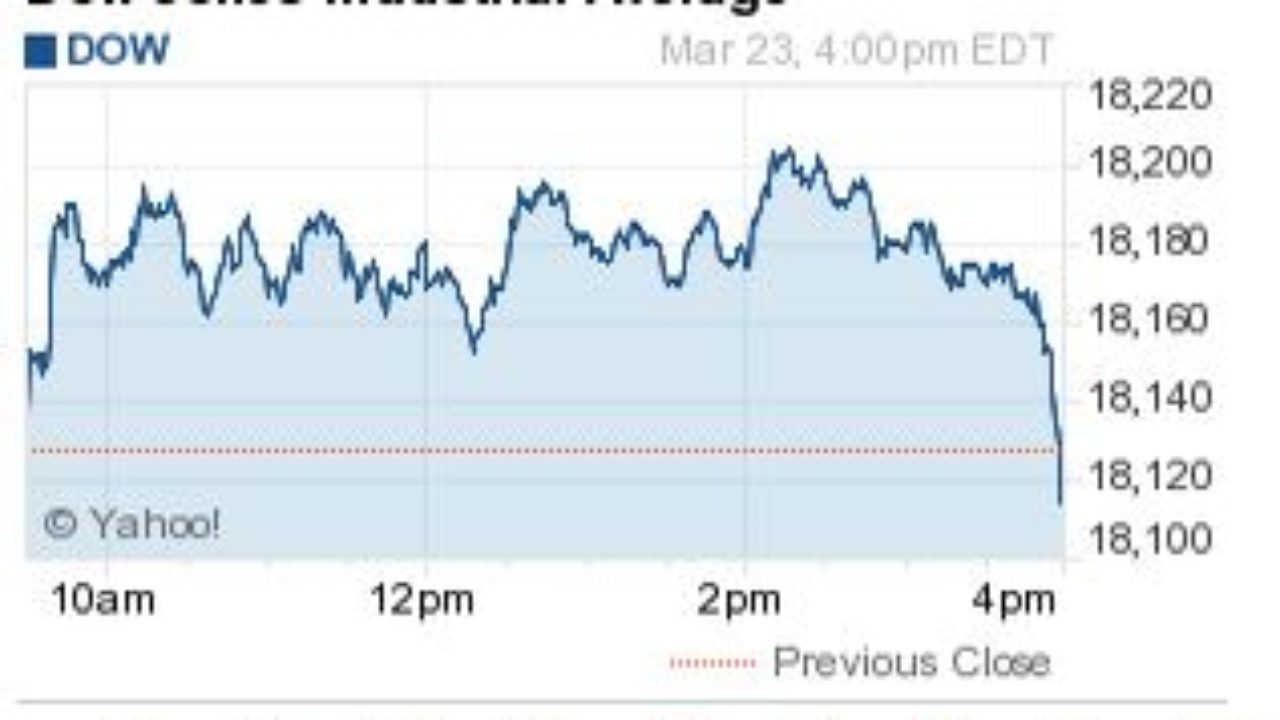
The S&P 500 is widely considered the best single gauge of large-cap U.S. equities. It tracks 500 of the largest companies across various sectors. If the S&P 500 is up, it generally indicates a broad-based confidence in the American corporate sector. The Dow Jones, consisting of only 30 “blue-chip” companies, offers a look at established industrial and financial giants. Meanwhile, the Nasdaq is heavily weighted toward the technology sector. On days when tech stocks are surging due to AI breakthroughs or software earnings, the Nasdaq will often outperform the other two.
The VIX and Market Volatility
Understanding “what stocks are doing” also involves looking at the CBOE Volatility Index, or the VIX. Often called the “fear gauge,” the VIX measures the market’s expectation of 30-day volatility. A rising VIX usually accompanies falling stock prices, as investors buy “put options” to protect their portfolios, signaling uncertainty or fear. Conversely, a low or falling VIX suggests a “risk-on” environment where investors feel comfortable bidding up stock prices.
Sector Performance: Who is Winning and Who is Losing?
The market is rarely a monolith. On any given day, technology might be rallying while energy is slumping, or defensive sectors like healthcare and utilities might be holding steady while growth stocks are being sold off. Analyzing sector performance tells us about the “rotation” of money. For instance, if cyclical sectors like industrials and materials are up, it suggests investors are optimistic about economic growth. If “safe haven” sectors like consumer staples are the only ones in the green, the market may be bracing for a downturn.
2. Key Macroeconomic Drivers Influencing Daily Prices
Stocks do not trade in a vacuum. They are deeply sensitive to the broader economic environment. If you notice a sudden sharp move in the markets today, it is likely tied to one of three major macroeconomic factors.
Interest Rates and Federal Reserve Policy
The Federal Reserve (the Fed) is perhaps the single most influential entity for stock prices. Through the adjustment of the federal funds rate, the Fed controls the cost of borrowing. When the Fed hints at raising rates to combat inflation, stocks—particularly growth and tech stocks—often decline because higher borrowing costs eat into future profits. Conversely, when the Fed signals a “pause” or a “pivot” toward lower rates, stocks tend to rally as capital becomes cheaper and more abundant.
Inflation Data and Consumer Spending
Investors keep a hawk-like watch on the Consumer Price Index (CPI) and Personal Consumption Expenditures (PCE) reports. Inflation erodes the purchasing power of consumers and increases the input costs for businesses. If today’s inflation data comes in “hotter” than expected, stocks may sell off on fears that the Fed will remain aggressive with rate hikes. Because the U.S. economy is 70% driven by consumer spending, any data suggesting that the average person is pulling back on retail or services can send shockwaves through the market.
Geopolitical Events and Global Supply Chains
In a globalized economy, an event in Eastern Europe, the Middle East, or the South China Sea can impact a portfolio in New York within seconds. Geopolitical instability often leads to “flights to quality,” where investors sell stocks and buy gold or U.S. Treasuries. Additionally, any news affecting global supply chains—such as shipping disruptions or trade tariffs—can immediately devalue companies that rely on international logistics, such as automakers and electronics manufacturers.
3. Understanding the “Why” Behind Daily Fluctuations
Daily price movements are often a mix of fundamental shifts and temporary “noise.” Distinguishing between the two is the hallmark of a sophisticated investor.
Corporate Earnings Reports
During “earnings season,” the primary driver of stock performance is the quarterly report. Every three months, public companies disclose their revenue, net income, and future guidance. If a heavyweight like Apple or Microsoft misses its earnings target or, more importantly, issues “weak guidance” for the next quarter, it can drag down the entire tech sector. Stocks react not just to how much money a company made, but to how that performance compared to Wall Street’s expectations.
Technical Analysis vs. Fundamental Shifts
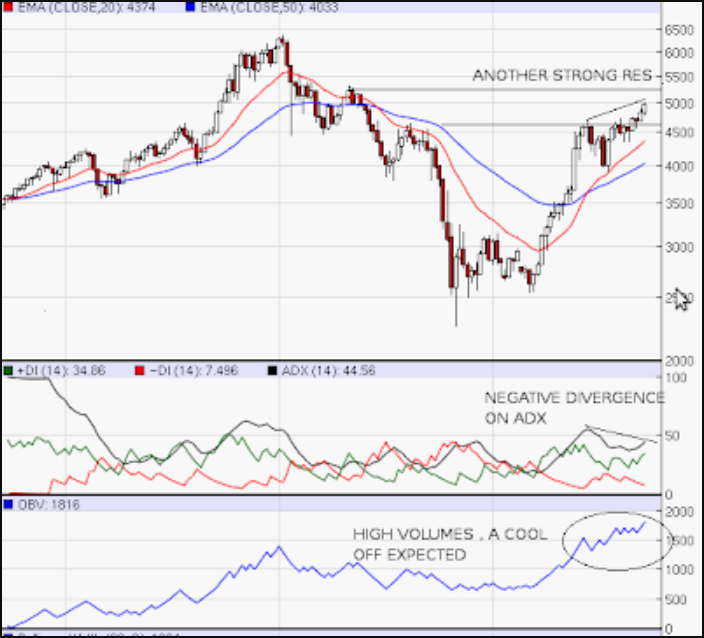
Sometimes, stocks move not because of news, but because of “technical” reasons. Traders use charts to identify support and resistance levels. If the S&P 500 breaks below a “key moving average,” it might trigger automated sell orders, causing a rapid decline that has nothing to do with the actual health of the economy. Understanding that some daily movements are purely technical can help investors avoid panic-selling during a routine “pullback.”
The Role of Algorithmic and High-Frequency Trading
In the modern era, the majority of trading volume is executed by algorithms, not humans. These programs can process news and execute trades in milliseconds. This often leads to “over-reactions” in the market. A single headline containing a keyword can trigger a cascade of selling. While this creates daily volatility, these algorithmic swings often correct themselves once human investors have had time to digest the actual context of the news.
4. Strategic Approaches for Every Type of Investor
Once you know what stocks are doing today, the next question is: “What should I do about it?” Your response depends entirely on your financial goals and time horizon.
The Long-Term Perspective: Ignoring the Noise
For the vast majority of people—those saving for retirement or a child’s education—the best reaction to daily stock market movement is often no reaction at all. Historically, the stock market has returned an average of 7-10% annually over long periods. Frequent checking of “what stocks are doing today” can lead to emotional decision-making. If you are a long-term investor, a “red day” is simply an opportunity to continue your “Dollar-Cost Averaging” (DCA) strategy, buying shares at a lower price.
Day Trading vs. Swing Trading
For those who operate on shorter timeframes, daily movements are the source of opportunity. Day traders seek to capitalize on intraday volatility, closing all positions before the market rings its final bell. Swing traders hold positions for days or weeks, looking to catch a “swing” in momentum. For these individuals, understanding the daily drivers—such as volume, gaps, and relative strength—is essential for survival. However, this niche requires immense discipline and a high tolerance for risk.
Risk Management and Diversification
Regardless of what the market is doing today, a healthy portfolio should be built to withstand various conditions. This is where diversification comes in. If your portfolio is exclusively in tech stocks, a bad day for the Nasdaq is a bad day for your net worth. By spreading investments across different asset classes—such as bonds, real estate (REITs), and international stocks—you ensure that one sector’s “bad day” doesn’t derail your entire financial future.
Conclusion: Stocks as a Tool for Wealth, Not a Source of Stress
“What are stocks doing today?” is a question that provides a snapshot of the world’s collective economic expectations. While the daily ups and downs can feel like a rollercoaster, they are part of the natural price-discovery process of a free market.
By understanding the indices, the macroeconomic influences, and the difference between short-term noise and long-term trends, you transform from a passive observer into an informed participant. Whether the market is reaching new all-time highs or navigating a correction, remember that the most successful investors are not those who react most quickly to today’s news, but those who have a clear plan and the discipline to stick to it. Stocks will always be “doing something” today; your job is to make sure your financial strategy is doing something for your future.
aViewFromTheCave is a participant in the Amazon Services LLC Associates Program, an affiliate advertising program designed to provide a means for sites to earn advertising fees by advertising and linking to Amazon.com. Amazon, the Amazon logo, AmazonSupply, and the AmazonSupply logo are trademarks of Amazon.com, Inc. or its affiliates. As an Amazon Associate we earn affiliate commissions from qualifying purchases.