In the complex world of finance, understanding numbers goes beyond mere arithmetic. It’s about grasping the true story behind the figures, discerning trends, and making informed decisions. While averages often dominate discussions, another statistical measure, the median, frequently offers a more accurate, less skewed perspective, especially when dealing with financial data. For anyone delving into personal finance, investing, business analysis, or economic trends, understanding what median numbers are and why they matter is not just helpful—it’s essential for navigating financial landscapes with precision and confidence.
The median represents the middle value in a dataset when that data is arranged in order. Unlike the mean (the arithmetic average), the median is impervious to the distorting influence of outliers – those exceptionally high or low values that can paint a misleading picture. In finance, where extremes are common (think of a CEO’s salary compared to an entry-level employee’s, or the price of a mansion versus an average starter home), the median acts as a crucial anchor, offering a more realistic representation of the “typical” scenario. This article will delve into the core concept of median numbers, explore their indispensable role across various financial domains, and equip you with the knowledge to leverage this powerful statistical tool for smarter financial decisions.

The Core Concept of Median: More Than Just an Average
At its heart, the median is a measure of central tendency, a statistical tool designed to identify the “center” of a dataset. However, its method of arriving at that center sets it apart, offering unique advantages, particularly in the realm of financial analysis. Understanding this distinction is the first step towards unlocking more profound insights from financial figures.
Defining the Median: The True Middle Ground
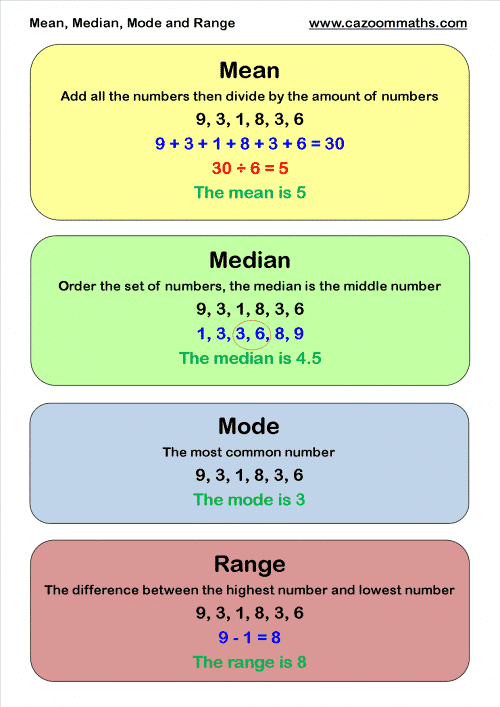
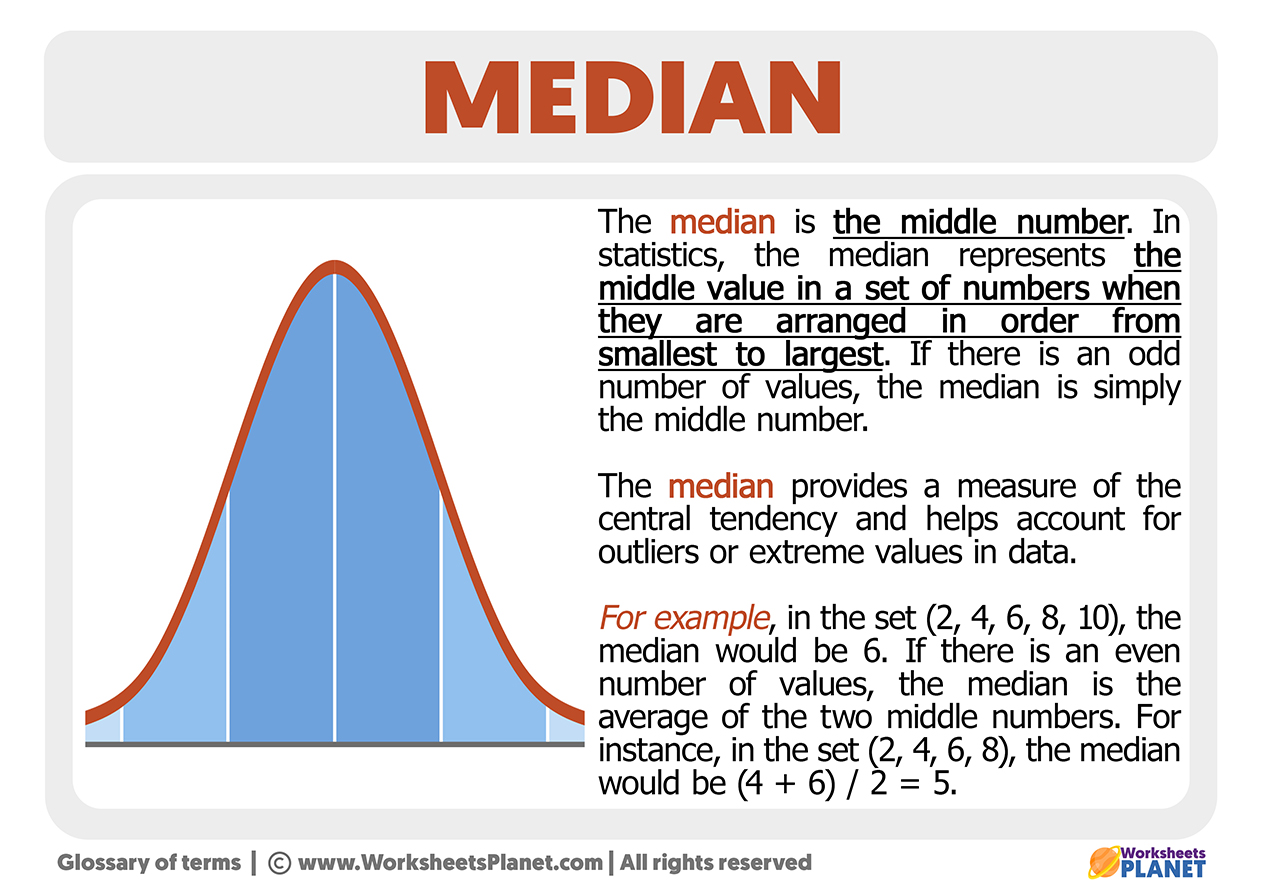
Simply put, the median is the middle number in a sorted list of numbers. To find it, you first arrange all the numbers in your dataset from the smallest to the largest (or vice versa). Once ordered, the number that sits precisely in the middle is your median. For instance, if you’re looking at the salaries of five employees: $40,000, $45,000, $50,000, $60,000, $100,000. When ordered, the middle value is $50,000. This $50,000 is the median salary, representing the typical earning of an employee in this group, undistorted by the highest earner.
In cases where you have an even number of data points, there isn’t a single middle number. Instead, you take the two innermost numbers, add them together, and then divide by two to find the median. For example, if we add another employee with a salary of $65,000 to our previous list, the sorted salaries become: $40,000, $45,000, $50,000, $60,000, $65,000, $100,000. The two middle numbers are $50,000 and $60,000. Their sum is $110,000, and dividing by two gives us a median of $55,000. This method ensures that the median consistently represents the midpoint of the financial data, offering a reliable benchmark for understanding typical values.
Why Not Always the Mean? The Outlier Problem in Finance
While the mean (or arithmetic average) is a widely used statistical measure, it has a significant vulnerability when applied to financial datasets: its sensitivity to outliers. Outliers are extreme values—either much higher or much lower than the majority of the data points—that can drastically skew the mean, creating a misleading impression of the “average.” In finance, such outliers are incredibly common.
Consider a small startup with 9 employees earning $50,000 each and one CEO earning $1,000,000.
The total payroll is (9 * $50,000) + $1,000,000 = $450,000 + $1,000,000 = $1,450,000.
The mean salary would be $1,450,000 / 10 = $145,000. This figure is significantly higher than what 90% of the employees actually earn, making it a poor representation of the typical employee’s salary.
However, if we arrange the salaries: $50k, $50k, $50k, $50k, $50k, $50k, $50k, $50k, $50k, $1,000k. The median would be ($50k + $50k) / 2 = $50,000. This much more accurately reflects the typical compensation.
This “outlier problem” is rampant across financial data, from individual incomes and household net worth to stock returns and real estate prices. A few multi-million-dollar transactions can inflate the average property price in a neighborhood, just as a single runaway stock can boost the average return of a portfolio. By relying solely on the mean, one risks making financial decisions based on a distorted reality. The median, by focusing on the positional center, sidesteps this issue entirely, offering a robust and reliable measure of central tendency that is far more representative of the typical financial experience.
Calculating the Median: A Step-by-Step Financial Guide
Calculating the median is a straightforward process, but it requires careful ordering of your financial data. Mastery of this simple calculation allows you to quickly derive meaningful insights from any numerical financial set.
Step 1: Gather Your Data
Collect all the financial figures you wish to analyze. This could be a list of monthly expenses, investment returns, property values, or salaries.
Step 2: Order the Data
Arrange all the numbers in your dataset from the smallest value to the largest value. This step is critical; without proper ordering, the median cannot be accurately identified.
Step 3: Identify the Middle Value
-
For an Odd Number of Data Points: If your dataset contains an odd number of values, the median is simply the number that falls exactly in the middle of the ordered list.
- Example: Imagine your monthly utility bills for the last five months were: $75, $60, $90, $80, $65.
- Ordered: $60, $65, $75, $80, $90.
- The median is $75. Two values are below it, and two are above it.
-
For an Even Number of Data Points: If your dataset contains an even number of values, there isn’t a single middle number. Instead, you’ll have two numbers in the middle. To find the median, you take these two middle numbers, add them together, and then divide their sum by two.
- Example: Your quarterly investment returns were: 2%, 5%, -1%, 3%.
- Ordered: -1%, 2%, 3%, 5%.
- The two middle numbers are 2% and 3%.
- Add them: 2% + 3% = 5%.
- Divide by two: 5% / 2 = 2.5%. The median return is 2.5%.
By following these simple steps, you can reliably calculate the median for any financial dataset, ensuring that your understanding of the typical value is grounded in accuracy rather than skewed by extremes. This foundational skill is invaluable for anyone making financial analyses or decisions.
Median’s Indispensable Role in Personal Finance and Investing
The usefulness of median numbers truly shines in personal finance and investing, where individual circumstances and market fluctuations often create highly skewed data. For individuals making crucial decisions about their money, the median offers a more grounded and relatable perspective than traditional averages.
Understanding Household Income and Wealth Distribution
When we talk about the financial health of a nation or a community, figures like “average income” can be profoundly misleading. A handful of extremely wealthy individuals can dramatically inflate the mean income, making it appear as though the typical household is much better off than it actually is. This is where the median household income becomes an invaluable metric. It tells us the income level that divides the population exactly in half—50% of households earn more, and 50% earn less. This provides a much more accurate and relatable picture of typical living standards and purchasing power for the average family.
Similarly, median net worth offers a clearer understanding of wealth distribution. While average net worth might be skewed upwards by billionaires, the median net worth reveals the actual wealth level of the person in the middle of the economic spectrum. These median figures are critical for policymakers designing social programs, for economists analyzing inequality, and for individuals benchmarking their financial progress against a realistic standard. They help to highlight disparities and inform strategies aimed at improving financial well-being for the majority, not just a privileged few.
Real Estate Valuations: The Median Home Price
In the highly variable world of real estate, understanding pricing trends is paramount for buyers, sellers, and investors. The median home price is the go-to statistic for analyzing real estate markets, largely because of the extreme range in property values. A neighborhood might contain modest starter homes alongside multi-million-dollar luxury estates. If you were to calculate the average home price, the few luxury properties could significantly inflate the figure, giving a false impression of what most homes in that area are worth.
For example, if a market has 9 homes at $300,000 and one mansion at $5,000,000, the mean price would be ($2.7M + $5M) / 10 = $770,000—a figure far from what most buyers would pay or most sellers would expect. The median, however, would remain $300,000, accurately reflecting the price point for the typical home. Buyers use the median to gauge affordability and value in a given area, while sellers use it to price their homes competitively. Real estate professionals and market analysts rely on the median home price to identify trends, assess market health, and make predictions, knowing it provides a stable and representative benchmark.
Investment Performance and Risk Assessment
When evaluating investment performance, whether for a single stock, a mutual fund, or an entire portfolio, the median can offer insights that the mean might obscure. While an average return can tell you the overall performance, it can be heavily influenced by one or two exceptionally good or bad years (outliers). For example, a mutual fund might have one year with a 100% return and four years with 5% returns. The mean return would be (100+5+5+5+5)/5 = 24%, which seems very impressive. However, the median return would be 5%, a much more accurate reflection of what an investor could typically expect over the majority of years.
Investors can use median returns to understand the typical outcome from an investment strategy or asset class, rather than being swayed by extraordinary (and often unsustainable) peaks or troughs. This is particularly useful in comparing investment options; comparing median returns across different funds or sectors can give a clearer picture of consistent performance rather than just outlier-driven averages. Furthermore, when assessing risk, understanding the median loss during downturns can provide a more realistic expectation of potential downside than an average, which might be skewed by a single catastrophic event. By focusing on median performance, investors can make more realistic projections and set more achievable financial goals.
Business Finance and Economic Insights Through the Median Lens
Beyond personal finance, median numbers are vital tools in the broader contexts of business finance and economic analysis. They help businesses benchmark performance, analyze compensation, and provide governments with clearer data for policy formulation, all by offering a more representative view of trends and distributions.
Evaluating Business Performance and Compensation
In the corporate world, median figures offer crucial benchmarks for both internal analysis and industry comparison. For instance, looking at median employee salary within a company or across an industry provides a fairer assessment of compensation than the mean. As discussed earlier, the salaries of top executives can significantly skew the average, making it appear that employees are, on average, paid more than is truly typical. Median salary allows businesses to analyze their compensation structure, ensure fairness, and benchmark against competitors more accurately. This is crucial for talent acquisition, retention, and managing labor costs effectively.
Furthermore, median profit margins within an industry can serve as a more robust benchmark for a company’s financial health and competitiveness. While a few highly successful (or struggling) firms might distort the average, the median profit margin indicates the typical profitability that businesses in that sector are achieving. This helps management understand if their company is performing “in line” with its peers, falling behind, or excelling, free from the influence of extreme performers. Similarly, in fields like startup valuations, median valuations of comparable companies are frequently used to establish a realistic baseline, avoiding the hype or despair associated with outlier funding rounds.
Economic Indicators and Policy Making
Government agencies and economists rely heavily on median statistics to understand broad economic trends and formulate effective policies. Just as with household income, the median inflation rate might provide a more nuanced understanding of the typical price increases faced by consumers than the average, which could be swayed by volatile sectors like energy or food. This helps central banks gauge the true impact of price changes on the average citizen’s purchasing power.
Similarly, median unemployment duration gives a better sense of how long a typical person remains unemployed, offering insights into the labor market’s efficiency and the urgency of job creation programs. If the average unemployment duration is high due to a few long-term unemployed individuals, but the median is relatively low, it paints a different picture than if both are high. Understanding these median indicators allows governments to craft policies that address the actual economic conditions faced by the majority of the population, leading to more targeted and impactful interventions, from tax policy to social safety nets.
Market Analysis and Sales Forecasting
For businesses engaged in sales and marketing, median numbers provide invaluable insights into customer behavior and market dynamics. For example, knowing the median transaction size can reveal the typical amount customers spend. While a few large enterprise deals might inflate the average, the median gives a clearer indication of the budget range most customers operate within, helping sales teams tailor their pitches and product offerings.
In retail, the median time to sell a particular product or a category of inventory can be a critical metric for inventory management and sales forecasting. If the average time to sell is high due to a few slow-moving, high-value items, but the median is low, it suggests that most inventory moves quickly, allowing for more efficient stock rotation and reduced holding costs. This application extends to various sectors, from manufacturing to services, where understanding the typical flow of goods and services is crucial for operational efficiency and strategic planning. By focusing on median data, businesses can develop more realistic sales forecasts, optimize resource allocation, and refine their market strategies with greater precision.
Practical Applications and Tools for Leveraging Median in Finance
Integrating median analysis into your financial toolkit can significantly enhance the clarity and reliability of your decision-making. Whether you’re planning your personal budget or evaluating market trends, knowing how to find and interpret median numbers, and understanding their broader context, is a powerful advantage.
Financial Planning and Budgeting with Median Data
When creating a personal budget, relying solely on average past expenses can be misleading if you’ve had a few unusually high or low spending months. By calculating your median monthly expenses for categories like groceries, utilities, or entertainment, you can arrive at a more realistic and stable baseline. For example, if one month you had an unexpected car repair bill that spiked your “transportation” average, the median would filter that outlier, giving you a truer picture of your typical monthly outlay. This allows you to set more achievable savings goals and allocate funds more effectively, building a budget that genuinely reflects your typical spending habits rather than being distorted by occasional anomalies.
Similarly, when setting savings goals or planning for future investments, benchmarking your income or projected returns against median figures from reliable sources can help you set realistic expectations. Instead of comparing yourself to the average investor (who might be an outlier themselves), comparing to the median provides a more grounded perspective on what is typically achievable. This approach fosters a more pragmatic and resilient financial plan, less prone to the disappointment that can arise from unrealistic expectations based on skewed averages.
Data Sources and Interpretation
To effectively use median numbers in finance, it’s crucial to know where to find reliable data and how to interpret it. Many governmental agencies, financial news outlets, and industry reports regularly provide median statistics.
- Government Reports: Organizations like the U.S. Census Bureau, Bureau of Labor Statistics, Federal Reserve, and equivalent bodies in other countries are prime sources for median household income, net worth, wages, and other economic indicators.
- Real Estate Listings & Boards: Local real estate boards and reputable real estate websites often publish median home prices and rental rates for various regions and neighborhoods.
- Financial News & Research: Reputable financial news sources (e.g., The Wall Street Journal, Bloomberg, Financial Times) and investment research firms frequently cite median returns for mutual funds, ETFs, and other asset classes.
- Industry Associations: Trade organizations often collect and publish median data relevant to their specific industry, such as median profit margins or employee compensation.
When interpreting median data, always consider the context: What is the sample size? How was the data collected? What timeframe does it cover? A median calculated from a small, unrepresentative sample may not be as reliable as one from a large, diverse dataset. It’s also often beneficial to combine median data with other statistics (like the mean, mode, or range) to gain a comprehensive understanding, recognizing that no single number tells the whole story. The median provides a robust center, but other measures can fill in details about spread and other characteristics of the distribution.
Advanced Considerations: Quantiles and Percentiles
While the median itself is a powerful tool, it also serves as the foundation for a broader family of descriptive statistics known as quantiles, which offer even deeper insights into data distribution. The median is, in fact, the 50th percentile or the 2nd quartile.
- Quartiles: These divide a dataset into four equal parts. The first quartile (25th percentile) marks the value below which 25% of the data falls. The median is the second quartile (50th percentile). The third quartile (75th percentile) marks the value below which 75% of the data falls. In finance, quartiles are excellent for understanding income distribution more broadly than just the middle. For example, you can see what the income level is for the bottom 25% versus the top 25%.
- Deciles: These divide data into ten equal parts (10th percentile, 20th percentile, etc.).
- Percentiles: These are even more granular, dividing data into 100 equal parts. For instance, being in the 90th percentile for income means you earn more than 90% of the population.
In personal finance, understanding your position within these quantiles can provide a precise benchmark of your financial standing relative to others. For investors, percentile rankings for fund performance offer a detailed view of how an investment stacks up against its peers. By leveraging these more advanced applications of the median concept, individuals and businesses can gain an even more granular and sophisticated understanding of financial data, making highly informed and strategic decisions.
Conclusion
The journey through “what are median numbers” reveals a fundamental statistical concept with profound implications across the financial spectrum. Far more than a mere alternative to the mean, the median stands out as a robust and reliable measure of central tendency, particularly when dealing with the often-skewed and outlier-laden datasets inherent in finance. From understanding typical household incomes and accurately valuing real estate to assessing investment performance and guiding economic policy, the median provides a clearer, more representative picture of reality.
For individuals managing their personal finances, investors strategizing for growth, businesses analyzing performance, and policymakers shaping economic futures, embracing the median means making decisions based on precision rather than distortion. It encourages a deeper look beyond simple averages, fostering a more nuanced and insightful approach to financial data. By integrating median analysis into your financial toolkit, you empower yourself with a powerful lens to cut through the noise, identify true trends, and navigate the intricate world of money with enhanced clarity and confidence. The next time you encounter financial figures, remember the power of the middle number – it often tells the most authentic story.
aViewFromTheCave is a participant in the Amazon Services LLC Associates Program, an affiliate advertising program designed to provide a means for sites to earn advertising fees by advertising and linking to Amazon.com. Amazon, the Amazon logo, AmazonSupply, and the AmazonSupply logo are trademarks of Amazon.com, Inc. or its affiliates. As an Amazon Associate we earn affiliate commissions from qualifying purchases.