
In the dynamic world of business and finance, understanding a company’s financial health is paramount, whether you’re an investor, an entrepreneur, or simply curious about how businesses operate. Among the myriad of financial metrics available, leverage ratios stand out as critical indicators of how much a company relies on borrowed money to finance its assets and operations. These ratios offer a window into a company’s risk profile, its ability to meet its financial obligations, and ultimately, its long-term sustainability. For anyone navigating the complexities of investing, business finance, or even personal financial planning, grasping the essence of leverage ratios is not just beneficial—it’s essential.

The concept of “leverage” itself stems from the physical world, where a lever allows a small force to move a much larger weight. In finance, leverage works similarly: it’s the strategy of using borrowed capital to increase the potential return of an investment. While this can amplify profits, it also magnifies risk, making leverage ratios a double-edged sword that demands careful analysis. On a website that delves into technology trends, brand strategy, and money management, the discussion of leverage ratios holds particular relevance. From tech startups seeking venture capital, to established brands managing their corporate identity through economic cycles, to individuals making informed investment decisions, the implications of leverage resonate across all these domains. This article will demystify leverage ratios, exploring their core concepts, key types, and how they apply to the interconnected worlds of technology, branding, and smart money management.
The Core Concept: Understanding Financial Leverage
At its heart, financial leverage is about using borrowed money (debt) to finance assets and operations, rather than solely relying on owners’ equity. Businesses employ leverage for a variety of strategic reasons: to fund expansion, acquire new technology, increase production capacity, or even to buy back shares, thereby increasing earnings per share for existing shareholders. The underlying principle is that if the return generated on the assets acquired with borrowed funds exceeds the cost of borrowing (interest expense), the company can magnify its profits.
Consider a tech company that takes out a loan to develop a revolutionary AI tool. If the revenue generated by this AI tool significantly surpasses the interest payments on the loan, the company has successfully leveraged its debt to create value. This ability to multiply returns makes leverage a powerful tool for growth and efficiency. For investors, understanding this dynamic is crucial for evaluating a company’s potential for growth and its associated risks. For entrepreneurs, especially in the capital-intensive tech sector, strategic use of leverage can be the difference between rapid scaling and stagnation.
However, the power of leverage comes with a significant caveat: it’s a double-edged sword. Just as leverage can amplify gains, it can also magnify losses. If the assets financed by debt fail to generate sufficient returns, or if the economy takes a downturn, the company can struggle to meet its interest payments and principal repayments. This can lead to financial distress, bankruptcy, and a rapid erosion of shareholder value. This inherent risk is precisely why leverage ratios are so vital. They provide a standardized way to measure a company’s indebtedness relative to its assets, equity, or earnings, thereby offering insights into its financial stability and its capacity to withstand adverse economic conditions. In the context of “Money” (personal finance, investing, business finance), these ratios are fundamental tools for assessing risk and making informed decisions.
Key Types of Leverage Ratios and Their Significance
To gain a comprehensive understanding of a company’s financial leverage, analysts and investors typically examine several different ratios. Each ratio offers a unique perspective on a company’s debt structure and its ability to manage its financial obligations. By looking at a combination of these metrics, one can form a more complete picture of the company’s risk profile.
Debt-to-Equity Ratio (D/E)
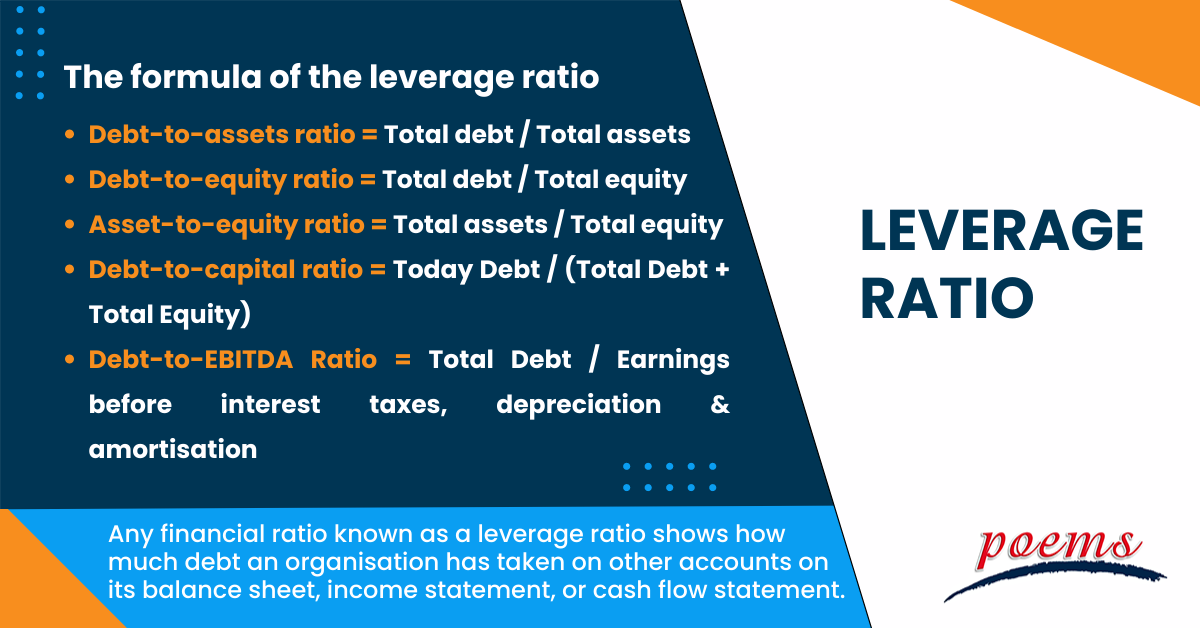
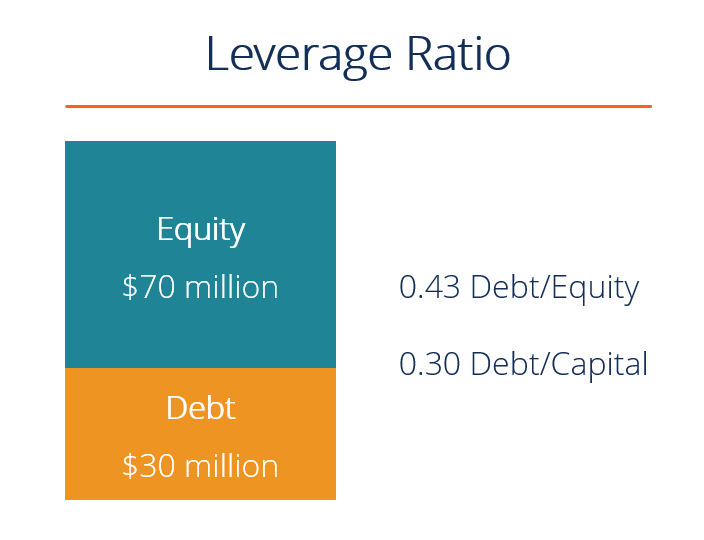
Perhaps one of the most commonly cited leverage ratios, the Debt-to-Equity (D/E) ratio provides a direct comparison of a company’s total liabilities to its shareholders’ equity.
Formula:
Debt-to-Equity Ratio = Total Liabilities / Shareholders' Equity
What it measures: This ratio indicates how much debt a company is using to finance its assets, relative to the value of equity provided by its owners. In simpler terms, it shows how many dollars of debt a company has for every dollar of equity.
Interpretation:
- High D/E Ratio: Generally suggests that a company has been aggressively financing its growth with debt. While this can lead to higher returns on equity if the company performs well, it also exposes the company to greater financial risk, especially if interest rates rise or revenues decline. A high ratio might make it difficult for the company to secure additional financing.
- Low D/E Ratio: Indicates a company is primarily financed by equity, implying a more conservative approach to financing. This typically translates to lower financial risk but might also suggest that the company is not fully capitalizing on potential growth opportunities that could be funded by strategic borrowing.
Significance: The D/E ratio is crucial for investors assessing a company’s risk tolerance. Lenders also use this ratio to evaluate a company’s creditworthiness. It’s important to compare a company’s D/E ratio against industry averages, as what’s considered “high” or “low” can vary significantly across different sectors (e.g., utility companies tend to have higher D/E ratios than tech companies due to stable cash flows and capital-intensive infrastructure). For tech startups, a lower D/E might be favorable initially, signalling stability to early-stage investors, while established tech giants might strategically take on more debt for acquisitions or large-scale projects.
Debt-to-Asset Ratio (D/A)
The Debt-to-Asset (D/A) ratio offers another broad perspective on a company’s reliance on debt, but this time, it looks at how much of a company’s assets are financed by debt.
Formula:
Debt-to-Asset Ratio = Total Liabilities / Total Assets
What it measures: This ratio indicates the proportion of a company’s assets that are financed through debt. It essentially tells you what percentage of a company’s assets would have to be sold to cover all of its liabilities.
Interpretation:
- High D/A Ratio: Suggests that a large portion of the company’s assets are financed by debt. This implies a higher risk of insolvency if the value of assets declines or if the company struggles to generate enough cash flow to service its debt.
- Low D/A Ratio: Indicates that a smaller portion of the company’s assets are financed by debt, suggesting greater financial stability and a stronger balance sheet.
Significance: While similar to the D/E ratio, the D/A ratio provides a different angle, focusing on the asset base. It’s particularly useful for understanding the overall capital structure and how much of a company’s asset base is at risk from creditors. For example, a company with a high D/A ratio might struggle to secure additional loans because its assets are already heavily encumbered by existing debt. This ratio is vital for “Money” topics like business finance and investment analysis, as it directly impacts perceived solvency and creditworthiness.
Debt-to-EBITDA Ratio
Moving beyond just balance sheet figures, the Debt-to-EBITDA ratio brings in profitability to assess a company’s ability to pay off its debt using its operating earnings.
Formula:
Debt-to-EBITDA Ratio = Total Debt / Earnings Before Interest, Taxes, Depreciation, and Amortization (EBITDA)
What it measures: This ratio indicates how many years it would take for a company to pay off its debt if its debt and EBITDA remained constant. It’s a key metric for assessing a company’s capacity to service its debt from its operational cash flow.
Interpretation:
- High Debt-to-EBITDA Ratio: Suggests that a company has a substantial amount of debt relative to its operating earnings, implying a higher risk of defaulting on its debt obligations, especially during economic downturns. Lenders and credit rating agencies often view ratios above 4x or 5x with caution.
- Low Debt-to-EBITDA Ratio: Indicates a company can comfortably cover its debt with its operating earnings, suggesting stronger financial health and a greater capacity to take on additional debt if needed.
Significance: This ratio is particularly important in mergers and acquisitions (M&A), private equity valuations, and for corporate lending decisions. It provides a more dynamic view of a company’s debt-paying ability than static balance sheet ratios. For “Money” investors, especially those looking at distressed debt or high-growth companies with fluctuating profitability, this ratio offers crucial insights into a company’s operational strength relative to its debt burden. Tech companies, particularly those with high R&D costs and initially negative earnings but strong projected EBITDA, are often evaluated using this ratio by venture capitalists and private equity firms.
Equity Multiplier
While not always immediately recognized as a standalone leverage ratio, the Equity Multiplier is a component of the DuPont analysis system and provides insight into the extent to which assets are financed by equity.
Formula:
Equity Multiplier = Total Assets / Shareholders' Equity
What it measures: This ratio shows how much of a company’s assets are financed by equity. It essentially measures the financial leverage of a company by showing how many assets a company controls for each dollar of equity invested.
Interpretation:
- High Equity Multiplier: Indicates that a company is using more debt (relative to equity) to finance its assets. This suggests higher financial leverage, which can amplify both returns and risks for shareholders.
- Low Equity Multiplier: Implies less reliance on debt and more reliance on equity financing, suggesting lower financial risk but potentially less magnified returns on equity.
Significance: The Equity Multiplier is often used as part of the DuPont analysis to decompose Return on Equity (ROE) into its constituent parts: net profit margin, asset turnover, and financial leverage (the equity multiplier). By understanding this component, investors can see how much of a company’s ROE is being driven by its use of debt. For “Money” managers and investors, it helps differentiate between companies that generate high returns through operational efficiency versus those that achieve it through aggressive debt financing.
Why Leverage Ratios Matter Across the Digital Landscape
Leverage ratios are not merely abstract financial concepts; their implications ripple through various facets of the modern business world, particularly within the domains of technology, branding, and sophisticated money management. Understanding these ratios is crucial for different stakeholders, from startup founders to brand strategists and institutional investors.
For Tech Startups and Growth Companies
The technology sector is characterized by rapid innovation, significant capital requirements for research and development (R&D), and aggressive market penetration strategies. Tech startups, in particular, often need substantial funding to develop their products, scale their operations, and acquire talent long before they become consistently profitable. This makes the strategic use of leverage, or the careful management of it, extremely important.
Venture capitalists (VCs) and other investors evaluating tech startups will meticulously scrutinize their financial leverage. While early-stage companies might rely more on equity financing, as they mature, debt can become a viable and often cheaper alternative to fund growth without further diluting ownership. However, a high debt load can signal instability, making it harder to attract future equity investment or survive market downturns. For a SaaS company, for instance, securing a term loan to invest in a new cloud infrastructure or AI integration could accelerate growth, but an unsustainable debt-to-EBITDA ratio could deter potential acquirers or public market investors down the line. Technology, ironically, also plays a crucial role in managing these ratios; specialized financial modeling software, AI-powered predictive analytics, and sophisticated ERP systems enable tech companies to forecast cash flows and manage their debt obligations with greater precision, aligning with the “Tech” topic of software and AI tools.
The Brand Impact of Financial Leverage
A company’s financial health, as revealed by its leverage ratios, has a direct and often profound impact on its brand. A strong, stable financial position, characterized by well-managed debt, enhances a company’s reputation and builds trust among customers, partners, and employees. Conversely, excessive leverage can signal financial distress, which can severely damage a brand’s image and market standing.
Consider a well-known tech brand facing bankruptcy due to unsustainable debt. This crisis would undoubtedly erode consumer confidence, potentially leading to a loss of market share, difficulty retaining talent, and a decline in brand equity. Suppliers might become wary of extending credit, and customers might question the longevity of the brand’s products or services. On the flip side, a company that strategically uses leverage to expand, innovate, and deliver superior products—all while maintaining financial stability—can bolster its brand as a reliable and forward-thinking leader. Transparency in financial reporting, including clear communication about debt management, can also reinforce a brand’s integrity and corporate identity. In “Brand” strategy, reputation management isn’t just about marketing campaigns; it’s also about demonstrating sound corporate governance and financial prudence, of which leverage ratios are a key indicator.
Leveraging Technology for Ratio Analysis and Financial Management
In today’s digital age, technology has revolutionized the way businesses and individuals manage and analyze financial data, making the complex task of monitoring leverage ratios more accessible and efficient. The “Tech” aspect of our website topics—encompassing software, AI tools, and productivity solutions—is directly applicable here.
- Financial Software and ERP Systems: Modern Enterprise Resource Planning (ERP) systems and specialized financial management software (e.g., QuickBooks, SAP, Oracle Financials) automate the aggregation of financial data, making it effortless to calculate and track leverage ratios in real-time. These tools integrate balance sheet data, income statements, and cash flow information, providing instantaneous insights into a company’s financial standing.
- AI Tools for Predictive Analytics: Artificial intelligence and machine learning are increasingly being employed to go beyond mere calculation. AI tools can analyze historical leverage ratio trends, compare them against industry benchmarks, and even predict future ratios based on economic forecasts and internal operational plans. This enables companies to proactively manage their debt, identify potential risks before they materialize, and optimize their capital structure. For investors, AI-driven platforms can provide sophisticated risk assessments of potential investments based on their leverage.
- Data Visualization and Productivity Tools: Advanced spreadsheet software, business intelligence (BI) dashboards, and data visualization tools transform raw financial numbers into easily digestible graphs and charts. This enhances productivity for finance teams and enables non-financial stakeholders, like marketing or product development heads, to grasp the implications of leverage ratios quickly. Digital security measures integrated into these tools also ensure that sensitive financial data remains protected, a critical consideration for any modern business.
By leveraging these technological advancements, companies can not only monitor their leverage ratios with unprecedented accuracy but also use them as strategic tools for informed decision-making, ensuring financial resilience and supporting sustainable growth. This directly connects to the “Money” topic of financial tools and business finance, showing how technology empowers better financial governance.
Interpreting and Applying Leverage Ratios in Context
While the formulas and interpretations of leverage ratios seem straightforward, their true value emerges when they are analyzed within the proper context. No single ratio tells the whole story, and a holistic perspective is crucial for accurate assessment.
1. Industry Benchmarks are Crucial: A D/E ratio that might be considered high for a software development company (which typically has low capital intensity) could be perfectly normal for a utility company (which requires massive infrastructure investments). Therefore, always compare a company’s leverage ratios to its industry peers and averages. Publicly available financial data and industry reports, often accessed through digital financial tools, are invaluable for this comparative analysis.
2. Trend Analysis Over Time: A snapshot of a single ratio at one point in time provides limited insight. It’s more informative to analyze trends in leverage ratios over several quarters or years. Is the company’s debt increasing or decreasing? How do these changes correlate with its growth strategy, economic cycles, or interest rate fluctuations? A consistent increase in leverage without a corresponding increase in earnings might signal growing risk, even if current ratios appear acceptable.
3. Qualitative Factors Alongside Quantitative Ratios: Financial ratios are quantitative measures, but they don’t capture qualitative aspects. Strong management, a robust competitive advantage, innovative products, or a diversified customer base can significantly mitigate the risks associated with higher leverage. Conversely, even a company with low leverage might be risky if its management is ineffective or its industry is in decline. Therefore, always combine ratio analysis with an evaluation of the company’s business model, leadership, and market position.
4. Role in Investment Decisions: For investors, leverage ratios are fundamental in assessing risk versus return. A highly leveraged company might offer higher potential returns due to amplified earnings, but it also carries a greater risk of capital loss. Investors must decide if the potential rewards justify the increased risk. Leverage ratios are also critical for credit ratings, which directly impact a company’s borrowing costs and its ability to raise capital—a key consideration in “Investing” and “Business Finance.”
5. Role in Business Strategy: For businesses themselves, leverage ratios inform critical strategic decisions. They guide capital budgeting, help determine the optimal mix of debt and equity financing, and influence decisions about expansion, acquisitions, or share buybacks. Understanding these ratios allows management to balance growth ambitions with financial prudence, ensuring that the company maintains access to capital while minimizing its cost and risk.
In essence, leverage ratios are powerful diagnostic tools. They don’t provide definitive answers but raise pertinent questions that lead to deeper financial investigation. By carefully interpreting these ratios in context, stakeholders can make more informed decisions, whether they are investing in a cutting-edge tech startup, strategizing brand reputation, or managing corporate finances for sustainable growth.
Conclusion
Leverage ratios are indispensable tools in the arsenal of anyone seeking to understand the financial bedrock of a business. From the venture capitalist evaluating a disruptive tech startup to the brand manager protecting corporate identity, and the individual investor crafting a diversified portfolio, these ratios offer vital insights into a company’s financial health, risk exposure, and capacity for growth. They reveal the intricate balance between using borrowed capital to amplify returns and the inherent risks that come with it.
We’ve explored key ratios like Debt-to-Equity, Debt-to-Asset, Debt-to-EBITDA, and the Equity Multiplier, each providing a distinct lens through which to view a company’s capital structure and operational efficiency. More importantly, we’ve seen how these financial metrics are intricately linked to the broader landscape of technology, branding, and money management. Technology, through advanced software and AI tools, empowers businesses to analyze and optimize their leverage with unprecedented precision, enhancing productivity and decision-making. Simultaneously, a company’s financial leverage directly impacts its brand reputation, influencing public perception and market trust.
Ultimately, mastering leverage ratios isn’t just about crunching numbers; it’s about developing a sophisticated understanding of how businesses operate, grow, and manage risk in an increasingly interconnected and data-driven world. By integrating these financial insights with an awareness of technological capabilities and brand strategy, individuals and organizations alike can navigate the complexities of modern finance with greater confidence and strategic foresight, leading to smarter investments and more resilient businesses.
aViewFromTheCave is a participant in the Amazon Services LLC Associates Program, an affiliate advertising program designed to provide a means for sites to earn advertising fees by advertising and linking to Amazon.com. Amazon, the Amazon logo, AmazonSupply, and the AmazonSupply logo are trademarks of Amazon.com, Inc. or its affiliates. As an Amazon Associate we earn affiliate commissions from qualifying purchases.