
In the world of commerce and personal finance, information is the most valuable currency. For investors, business owners, and creditors, financial reports serve as the definitive “report card” of an organization. They are formal records that provide a structured representation of the financial performance and position of an entity. Whether you are a retail investor looking to buy your first stock, an entrepreneur managing a growing startup, or a professional seeking to understand the inner workings of corporate finance, understanding financial reports is an essential skill.
These documents translate complex business activities into standardized numbers and narratives, allowing stakeholders to make informed decisions. Without these reports, the financial world would operate in a vacuum of speculation. This guide explores the fundamental components of financial reporting, their significance in the “Money” niche, and how to interpret them to gauge a company’s long-term viability.
The Core Components of Financial Reporting
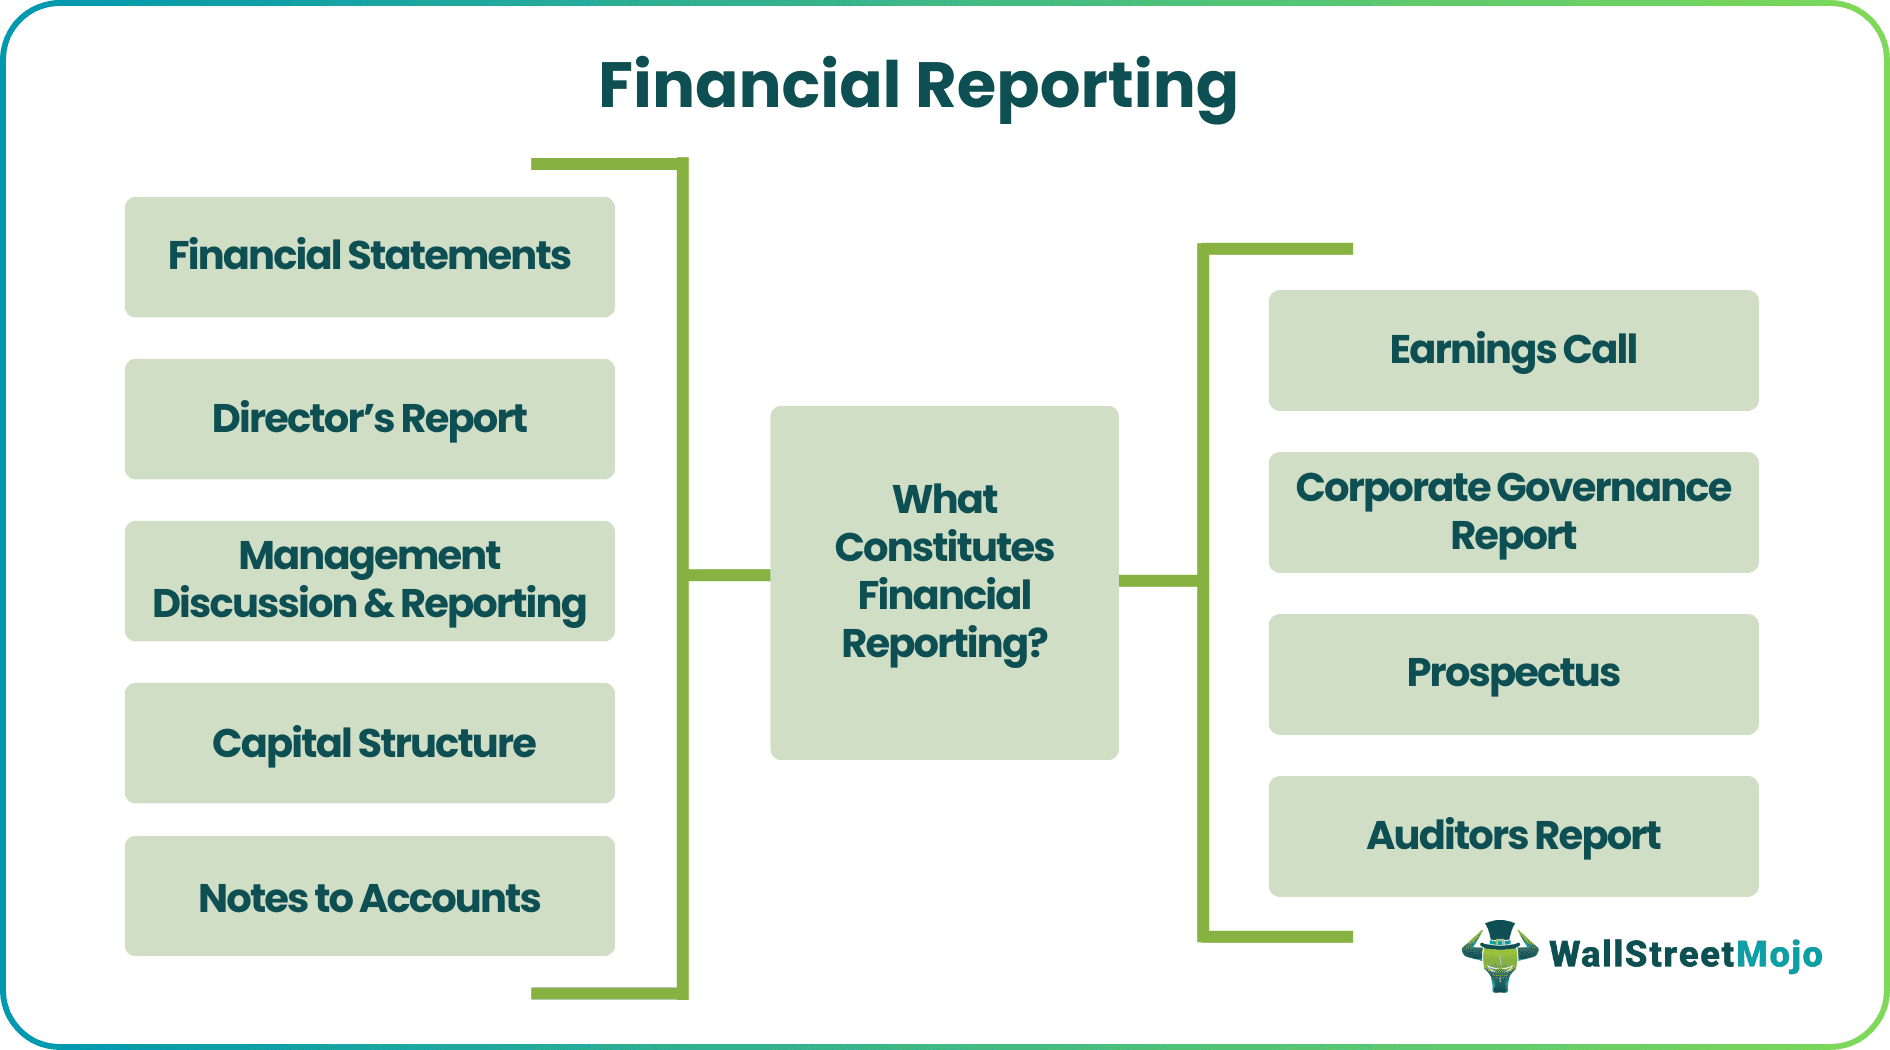
At the heart of every annual or quarterly report (often referred to as 10-K or 10-Q in the United States) are the primary financial statements. Each statement offers a different lens through which to view the company’s economic reality.
The Balance Sheet: A Snapshot of Net Worth
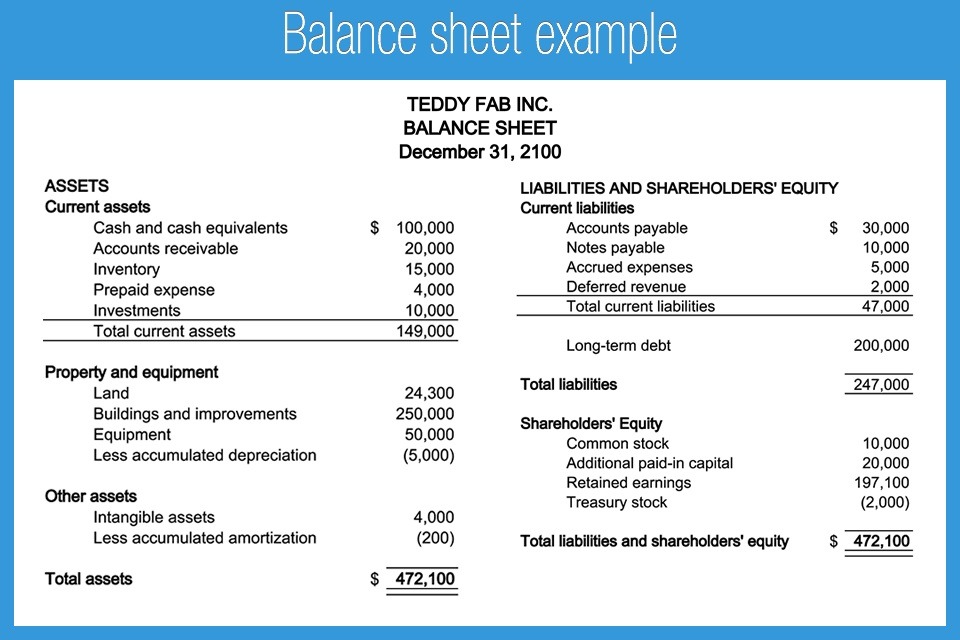
The balance sheet is perhaps the most fundamental financial report. It provides a snapshot of a company’s financial position at a specific point in time—usually the end of a fiscal quarter or year. It follows the fundamental accounting equation: Assets = Liabilities + Shareholders’ Equity.
Assets represent what the company owns, such as cash, inventory, and property. Liabilities represent what the company owes, including loans and accounts payable. Shareholders’ equity is the “net worth” of the company—what would be left for the owners if all assets were liquidated and all debts paid. By analyzing the balance sheet, an investor can determine if a company has enough liquidity to cover its short-term obligations or if it is over-leveraged with debt.
The Income Statement: Tracking Profit and Loss
While the balance sheet is a snapshot, the income statement (also known as the Profit and Loss or P&L statement) is a motion picture. It shows the company’s financial performance over a specific period. It starts with total revenue (the “top line”) and subtracts various costs—such as the cost of goods sold (COGS), operating expenses, interest, and taxes—to arrive at net income (the “bottom line”).
The income statement is vital for understanding a company’s ability to generate profit. Investors look for “quality of earnings”—consistent growth in revenue and expanding profit margins. If a company’s revenue is growing but its net income is shrinking, it may indicate that costs are spiraling out of control.
The Cash Flow Statement: Following the Money Trail
A company can be profitable on paper but still go bankrupt if it runs out of cash. This is where the cash flow statement comes in. It reconciles the net income from the income statement back to the actual cash moving in and out of the business.
It is divided into three sections:
-
Operating Activities: Cash generated from the core business.
-
Investing Activities: Cash spent on assets like machinery or the sale of investments.
-
Financing Activities: Cash related to borrowing money, repaying debt, or paying dividends.
Positive “Free Cash Flow” is often considered the gold standard in finance because it represents the actual cash available to reward shareholders or reinvest in growth.
Why Financial Reports Matter for Different Stakeholders
Financial reports are not just for accountants; they are the primary communication tool between a company and the outside world. Different parties use these reports to answer specific questions regarding risk and reward.
For Investors: Evaluating Growth and Stability
For the individual investor or the institutional fund manager, financial reports are the primary source of truth. They use these documents to perform “fundamental analysis.” By looking at historical trends in the reports, an investor can project future earnings and determine if a stock is undervalued or overvalued. Reports also reveal a company’s dividend policy, showing how much of the profit is being returned to shareholders versus being kept for growth.
For Lenders: Assessing Creditworthiness
Banks and bondholders are primarily concerned with one thing: getting their money back with interest. They look at financial reports to assess the “solvency” of a business. They focus heavily on the balance sheet to see if the company has sufficient collateral and on the cash flow statement to ensure there is enough liquidity to make interest payments. A company with a “weak” balance sheet—meaning high debt and low cash—will likely face higher interest rates or be denied credit altogether.
For Management: Strategic Decision Making
Internally, financial reports are used as a diagnostic tool. Executives look at the reports to see which departments are performing well and which are draining resources. For example, if the income statement shows that “Selling, General, and Administrative” (SG&A) expenses are rising faster than sales, management might implement cost-cutting measures. These reports turn abstract business strategies into measurable outcomes.
Key Financial Ratios Derived from Reports
Raw numbers can be difficult to compare across different companies or industries. To solve this, finance professionals use “ratios.” These are formulas that pull data from financial reports to provide a standardized view of performance.
Liquidity Ratios: Can the Company Pay Its Bills?
Liquidity ratios, such as the Current Ratio (Current Assets divided by Current Liabilities), tell us if a company can meet its short-term obligations. A ratio below 1.0 is often a red flag, suggesting that the company may struggle to pay its immediate debts without selling off long-term assets or taking on more debt.
Profitability Ratios: How Efficient is the Operation?
Profitability ratios like Return on Equity (ROE) and Net Profit Margin measure how effectively a company uses its resources to generate profit. ROE is particularly popular in the “Money” niche as it measures how much profit a company generates with the money shareholders have invested. A consistently high ROE often indicates a company with a strong competitive advantage or “moat.”
Leverage Ratios: Managing Debt Levels
The Debt-to-Equity Ratio is a critical metric for assessing financial risk. It compares a company’s total liabilities to its shareholders’ equity. In the world of business finance, some debt is often seen as a good thing because it can fuel growth. However, too much debt (high leverage) makes a company vulnerable during economic downturns. Financial reports allow analysts to see exactly how much leverage a company is using to juice its returns.
The Standards Governing Financial Reports
To ensure that companies don’t simply “make up” their numbers, financial reporting is governed by strict sets of rules. This ensures comparability and transparency across the financial markets.
GAAP vs. IFRS: Why Consistency Matters
In the United States, public companies must follow Generally Accepted Accounting Principles (GAAP). Most of the rest of the world follows International Financial Reporting Standards (IFRS). While they are similar, there are key differences in how they treat inventory, depreciation, and revenue recognition. For anyone involved in international investing or global business finance, understanding these nuances is crucial for an “apples-to-apples” comparison of two companies located in different countries.
The Role of External Audits
Publicly traded companies are required by law to have their financial reports audited by an independent third-party accounting firm. The auditor’s job is to provide “reasonable assurance” that the financial statements are free from material misstatement. An “unqualified opinion” from an auditor is a green light for investors, while a “qualified” or “adverse” opinion is a major warning sign that the numbers may not be trustworthy.
How to Analyze a Financial Report for Smarter Investing
Reading a financial report can be intimidating, as they often span over a hundred pages. However, knowing where to look can give you a significant edge in your personal finance and investing journey.
Looking Beyond the Numbers: The Notes to Financial Statements
One of the most overlooked sections of a financial report is the “Notes” or “Footnotes.” This section provides the context behind the numbers. It explains the accounting methods used, details about pending lawsuits, pension obligations, and breakdowns of debt maturity. Often, the biggest risks to a company’s future are hidden in the fine print of the notes rather than on the face of the balance sheet.
Identifying Red Flags and “Creative Accounting”
A sophisticated reader of financial reports looks for discrepancies. For instance, if a company reports record profits (Income Statement) but has negative operating cash flow (Cash Flow Statement), it might be using “aggressive” accounting to recognize revenue that hasn’t actually been collected yet. This is often a precursor to a stock price crash. Another red flag is frequent “one-time” charges or restructuring costs that seem to happen every year; this is often an attempt to hide ongoing operational weaknesses.
The Management Discussion and Analysis (MD&A)
In addition to the numbers, the MD&A section allows management to explain their performance in their own words. While this section can be filled with corporate jargon, it provides insight into what the leadership team views as their biggest opportunities and threats. For a long-term investor, seeing a management team that is honest about their failures in the MD&A is often a sign of good corporate governance.

Conclusion
Financial reports are much more than a collection of spreadsheets; they are the narrative of a company’s past, present, and potential future. In the “Money” niche, the ability to dissect a balance sheet, interpret an income statement, and track cash flow is the difference between speculative gambling and informed investing. By mastering these reports, you empower yourself to build a more secure financial future, whether you are managing your own portfolio or steering a multi-million dollar business. Financial literacy begins with the numbers, and the numbers are all found within the reports.
aViewFromTheCave is a participant in the Amazon Services LLC Associates Program, an affiliate advertising program designed to provide a means for sites to earn advertising fees by advertising and linking to Amazon.com. Amazon, the Amazon logo, AmazonSupply, and the AmazonSupply logo are trademarks of Amazon.com, Inc. or its affiliates. As an Amazon Associate we earn affiliate commissions from qualifying purchases.