In the landscape of modern technology, the concepts of columns and rows serve as the fundamental building blocks of data organization. Whether you are navigating a complex Microsoft Excel spreadsheet, querying a massive SQL database, or designing a responsive user interface for a mobile app, the grid-based logic of vertical and horizontal structures is omnipresent. Despite their simplicity, understanding the nuanced differences and technical applications of columns and rows is essential for anyone looking to master software tools, data science, or digital architecture.
The Structural Foundation: Defining Columns and Rows in Tech
At its most basic level, the distinction between a column and a row is one of direction and purpose. However, in the context of technology and software engineering, these terms carry specific functional weights that dictate how data is stored, retrieved, and visualized.
Understanding the Vertical: Columns as Attributes
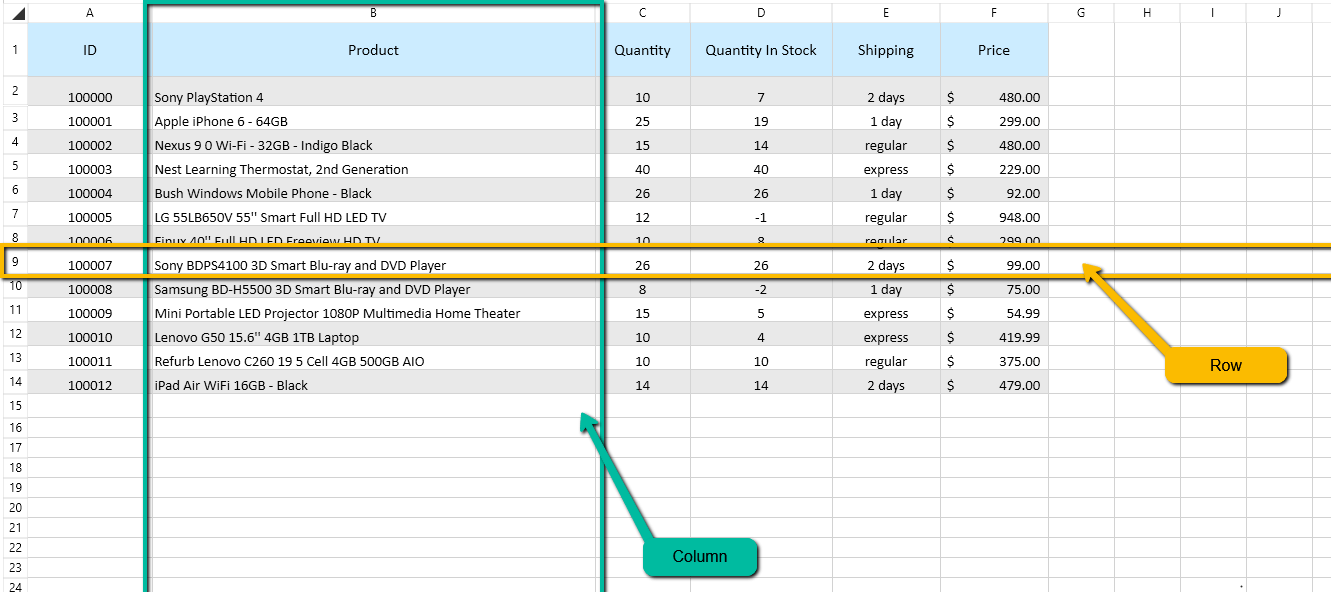
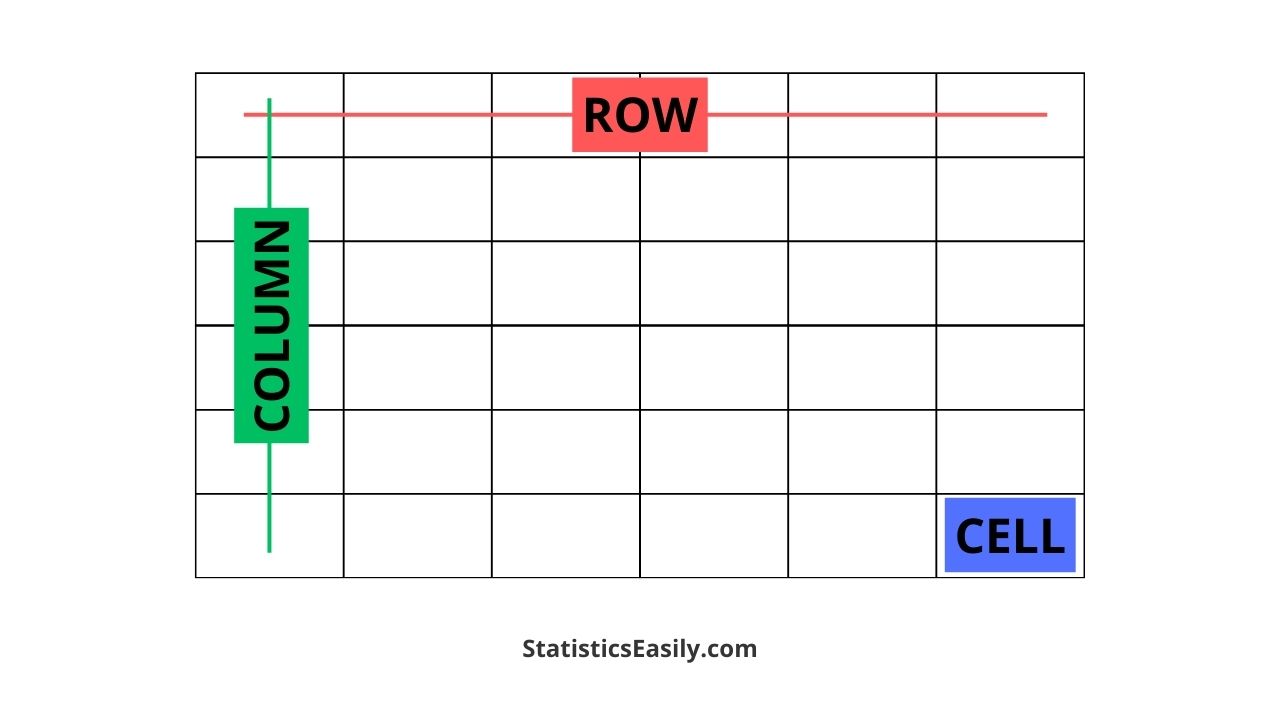
In a digital environment, a column is a vertical alignment of cells. Conceptually, columns represent the “what” of the data. In technical terms, columns are often referred to as “fields” or “attributes.” Each column is designed to hold a specific type of information that remains consistent throughout the entire dataset. For instance, in a database of users, one column might be dedicated exclusively to “Email Addresses,” while another is reserved for “Account Creation Dates.” The column defines the data type—whether it is a string of text, a numerical value, or a boolean (true/false) statement.
Understanding the Horizontal: Rows as Records
A row is a horizontal alignment of cells that stretches from left to right. If columns represent the categories of information, rows represent the actual “objects” or “entities” being described. In the world of databases, a row is frequently called a “record” or a “tuple.” Each row represents a single, unique entry in the system. Following the previous example of a user database, one single row would contain all the specific information pertaining to one individual user: their specific name, their specific email, and their specific sign-up date.
The Intersection: Cells and Data Points
The point where a row and a column meet is known as a “cell.” In a tech environment, a cell is the smallest unit of data. The address of a cell is defined by its coordinates (e.g., Column B, Row 10). This coordinate system is the bedrock of computational logic, allowing software algorithms to pinpoint, extract, and manipulate specific data points with surgical precision.
Columns and Rows in Spreadsheet Software: Excel and Google Sheets
Spreadsheets are perhaps the most recognizable application of column and row logic. Tools like Microsoft Excel and Google Sheets have revolutionized the way businesses and tech professionals manage data by providing a visual interface for these structural concepts.
Microsoft Excel: The Industry Standard for Tabular Data
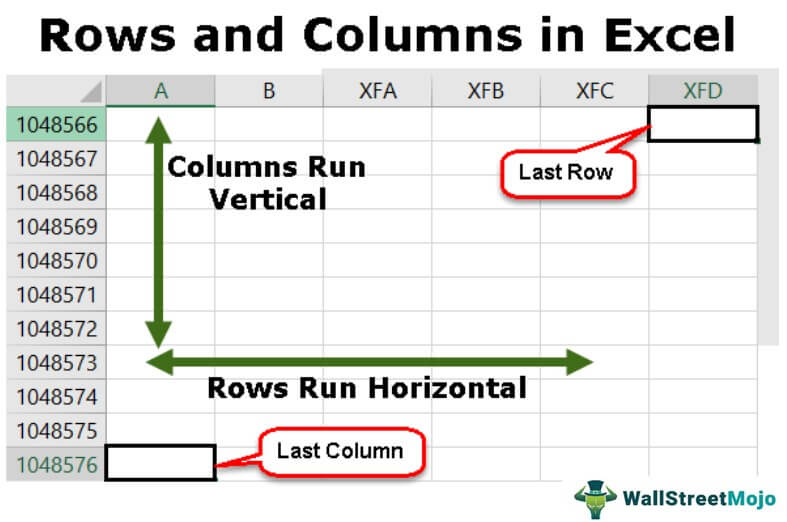
Excel utilizes a grid system where columns are labeled with letters (A, B, C…) and rows are labeled with numbers (1, 2, 3…). This system allows for complex referencing and formula building. In Excel, the power of columns and rows is amplified by features like “Absolute Referencing,” where a user can lock a specific column or row while dragging a formula across other cells.
From a tech perspective, Excel treats columns as the primary sorting mechanism. When you apply a “Filter” to a column, you are essentially telling the software to scan the attributes and hide rows that do not meet certain criteria. This interaction between the vertical (the filter) and the horizontal (the displayed record) is a core component of data analysis.
Google Sheets: Collaborative Data Structures
While Excel excels in local processing power, Google Sheets has pushed the logic of columns and rows into the cloud. In a collaborative tech environment, the grid becomes a living document. The technical challenge Google solved was ensuring that when one user adds a row (a new record), the integrity of the columns (the attributes) remains intact for all other users in real-time. This synchronization highlights the importance of rigid structural definitions; if the column logic fails, the data becomes unreadable.
Advanced Formatting and Dynamic Ranges
Modern spreadsheet software also introduces the concept of “Tables,” which are formalized structures of columns and rows. By defining a range as a table, the software treats the columns as named ranges. This is a bridge toward database management, where instead of referencing “Column C,” a formula might reference “[Total_Revenue],” making the tech stack more intuitive and less prone to human error.
Database Management: SQL and the Relational Model
Moving beyond simple spreadsheets, the concepts of columns and rows are the lifeblood of relational databases (RDBMS), such as MySQL, PostgreSQL, and SQL Server. In this niche, the terminology shifts slightly, but the logic remains the same.
Relational Tables and Schemas
In a database, a “Table” is a collection of related data held in a structured format within a database. It consists of columns and rows. The “Schema” of a table is essentially the blueprint of its columns. Before a single row of data can be entered into a professional SQL database, the columns must be strictly defined. You must decide the column name, the data type (e.g., VARCHAR, INT, DATE), and whether the column can be empty (NULL).
The Role of Primary Keys in Row Identification
In professional tech architecture, every row in a database table should be unique. This is achieved through a “Primary Key,” which is a specific column (or group of columns) that uniquely identifies a row. For example, an “Employee_ID” column ensures that even if two employees have the same name (the same data in one column), they are treated as two distinct rows (records). This prevents data duplication and ensures the integrity of the software’s backend.
Data Normalization: Optimizing Columns
Tech professionals use a process called “Normalization” to organize columns and rows to reduce redundancy. Instead of having one massive table with fifty columns (which is inefficient), a developer might split the data into three tables and link them using “Foreign Keys.” This high-level manipulation of columns and rows is what allows modern apps—like Facebook or Amazon—to handle billions of records without crashing.
Web Development and UI Design: The Grid System
Columns and rows aren’t just for data storage; they are also the primary tools for designing how we interact with technology. In frontend development and UI/UX design, the “Grid System” is used to create visual layouts.
CSS Grid and Flexbox Frameworks
Modern web design relies heavily on CSS (Cascading Style Sheets) to position elements on a screen. The “CSS Grid Layout” is a two-dimensional system that allows developers to align content into—you guessed it—columns and rows.
By defining grid-template-columns and grid-template-rows, a developer can create a layout where the sidebar is one column and the main content is another. This tech-driven approach ensures that the visual hierarchy of a website remains consistent, regardless of the content being loaded into those cells.
Responsive Design: How Columns Shift for Mobile
One of the most critical aspects of modern tech is “Responsive Design.” When you view a website on a desktop, you might see four columns of products. When you switch to a smartphone, those columns “stack” into a single column with multiple rows. This fluid transition is handled by code that instructs the browser to rearrange the column/row relationship based on the screen width. Understanding how to manipulate these axes is a foundational skill for any software developer.
The Future of Data Organization: AI and Automated Structuring
As we move further into the era of Artificial Intelligence, the way we interact with columns and rows is evolving. We are shifting from manual entry to automated data parsing.
Natural Language Processing (NLP) in Data Parsing
AI tools are now capable of taking “unstructured data” (like a long paragraph of text) and converting it into “structured data” (columns and rows). For example, an AI can read a thousand invoices and automatically fill a table with columns for “Date,” “Vendor,” and “Amount.” This automation relies on the AI’s ability to recognize the patterns that define a “record” versus an “attribute.”
Automated Insights from Tabular Data
Modern AI-driven analytics tools, such as Power BI or Tableau, use the column/row structure to perform “Predictive Analytics.” By analyzing the historical data within rows and identifying trends across columns, these tech tools can forecast future outcomes. The rigidity of the column/row format is what makes this machine learning possible; without a structured grid, the AI would have no framework to learn from.
Conclusion: The Ubiquity of the Grid
While they may seem like simple geometric concepts, columns and rows are the invisible scaffolding of the digital world. They provide the necessary structure for everything from the simplest budget spreadsheet to the most complex social media algorithms. By understanding columns as the definers of data types (attributes) and rows as the containers of specific information (records), tech professionals can better navigate the complexities of data management, software development, and UI design. As technology continues to advance, the grid may become more automated and dynamic, but the fundamental logic of the horizontal and the vertical will remain the cornerstone of how we organize human knowledge in the digital age.
aViewFromTheCave is a participant in the Amazon Services LLC Associates Program, an affiliate advertising program designed to provide a means for sites to earn advertising fees by advertising and linking to Amazon.com. Amazon, the Amazon logo, AmazonSupply, and the AmazonSupply logo are trademarks of Amazon.com, Inc. or its affiliates. As an Amazon Associate we earn affiliate commissions from qualifying purchases.