
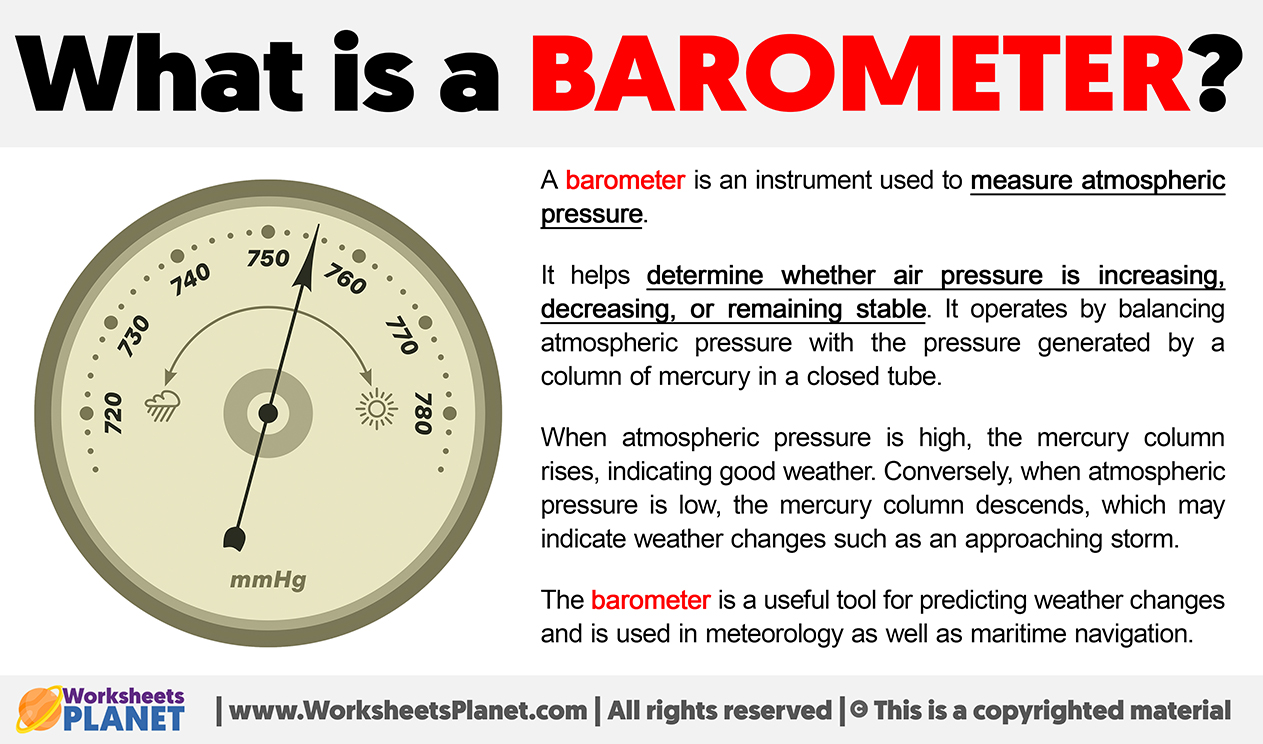
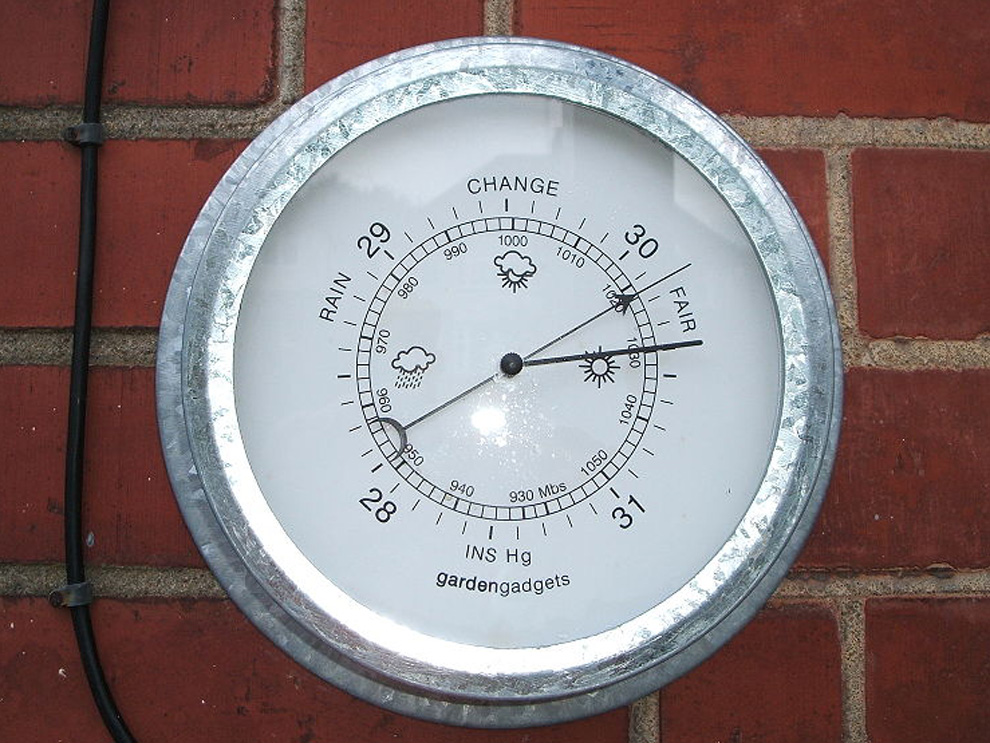
In the modern financial landscape, the term “barometer” has transcended its meteorological origins to become a cornerstone of economic analysis and investment strategy. Just as a physical barometer measures atmospheric pressure to forecast incoming storms or clear skies, a financial barometer acts as a vital diagnostic tool that traders, analysts, and investors use to gauge the “pressure” within specific markets or the broader economy. By tracking these indicators, participants in the capital markets can make informed decisions about asset allocation, risk management, and the timing of their financial moves.
The Role of Economic Barometers in Market Forecasting
Economic barometers are quantitative data points or indices that signal the current health of an economy or a specific industry sector. They serve as a mirror, reflecting the underlying sentiment and structural integrity of financial systems.
Leading, Lagging, and Coincident Indicators
To understand how these barometers function, one must distinguish between the three primary types of economic indicators. Leading indicators, such as stock market performance and consumer expectations, are the most sought-after barometers because they provide a glimpse into the future. If these barometers show a dip, investors often interpret it as a warning of an impending slowdown.
Coincident indicators, such as Gross Domestic Product (GDP) or industrial production, reflect the current state of the economy. They tell us exactly where we stand right now. Finally, lagging indicators, like unemployment rates, confirm patterns that have already established themselves. By balancing these three, a savvy investor creates a comprehensive picture of the economic climate, allowing for a more nuanced approach to capital deployment.
Sector-Specific Barometers
Beyond the macro economy, specific sectors rely on their own internal barometers. For example, the housing market uses building permits as a barometer for future construction activity. In the retail sector, the Consumer Confidence Index acts as a primary barometer for discretionary spending. By monitoring these niche-specific gauges, investors can rotate their portfolios to favor sectors that appear to have the most favorable “pressure” systems moving in, effectively hedging against volatility in other areas of their portfolio.
The Stock Market as a Broad Financial Barometer
The stock market itself is often cited as the ultimate barometer for the national economy. Because equity prices represent the discounted present value of expected future cash flows, the collective movement of major indices serves as a real-time pulse of investor sentiment regarding the future.
Indices as Economic Thermometers
The S&P 500 and the Dow Jones Industrial Average are perhaps the most recognized barometers in the financial world. When these indices climb, it signifies institutional and retail optimism regarding corporate earnings, interest rate environments, and geopolitical stability. Conversely, when these barometers experience sustained downward pressure, it suggests that the market is pricing in systemic risks. Understanding these indices allows an investor to determine if they are currently in a “bullish” (high pressure/high growth) or “bearish” (low pressure/contraction) environment.
Volatility Indexes and Risk Perception
Another essential barometer is the CBOE Volatility Index, or the VIX. Known colloquially as the “fear gauge,” the VIX measures the market’s expectation of volatility over the next 30 days. When the VIX is high, it acts as a barometer for extreme investor anxiety, often signaling that the market is reaching a point of capitulation or excessive caution. For a portfolio manager, a spike in the VIX barometer is a signal to re-evaluate leverage and move into defensive assets, proving that these tools are not just for observation, but for actionable risk mitigation.

Utilizing Barometers for Strategic Asset Allocation
The primary goal of using financial barometers is to achieve optimal asset allocation. By interpreting these data points, investors can adjust their exposure to equities, bonds, commodities, and cash, ensuring their portfolio remains aligned with their long-term financial goals despite the shifting tides of the market.
Interest Rates as a Macro-Barometer
Interest rates, largely dictated by central bank policies, serve as the most significant barometer for the cost of capital. They influence every aspect of personal and corporate finance. When central banks raise rates, they are essentially signaling that they want to lower the “pressure” (inflation) in the economy. This barometer is critical for investors because higher rates generally make borrowing more expensive, which can compress corporate margins and make fixed-income investments more attractive relative to equities. An investor who tracks the Federal Reserve’s movements as a barometer can strategically time their transition from growth stocks to bond-heavy or high-yield savings portfolios.
Commodity Prices and Inflationary Pressure
Commodities like oil, gold, and copper are frequently used as barometers for industrial growth and inflation. Copper, often referred to as “Dr. Copper,” is considered an exceptional barometer for global economic health because the metal is used in nearly every sector of the modern economy, from construction to electronics. If the price of copper rises, it is usually because industrial demand is heating up. Conversely, a drop in copper prices can act as an early warning sign of a cooling economy. By integrating commodity price tracking into a financial plan, investors gain a tangible barometer for the real-world utility and demand that drives their financial assets.
Interpreting Financial Signals in a Digital Age
In the modern era, the speed at which financial data travels has turned these barometers into highly sensitive instruments. Algorithms and AI-driven platforms now consume thousands of data points every second, causing market barometers to fluctuate with a level of intensity that was unknown to previous generations of investors.
The Impact of Sentiment Analysis
With the rise of social media and news aggregation, “sentiment analysis” has become a new form of digital barometer. Analysts now use sophisticated software to scrape millions of social posts, headlines, and search queries to gauge the “mood” of the market. This digital barometer allows investors to see how public perception might be diverging from fundamental reality. It is a powerful tool for contrarian investors who seek to profit from market overreactions. When the “digital pressure” hits an extreme due to fear or greed, it often signals that the market is ripe for a reversal.
Navigating Information Overload
While the availability of these barometers is a boon for modern finance, it also creates the risk of “signal noise.” It is easy for an investor to be overwhelmed by conflicting data. The key to successful financial navigation is to select a few reliable barometers that align with one’s specific investment strategy. If you are a long-term value investor, daily market volatility indices might be mere noise, whereas quarterly GDP reports and interest rate cycles are essential barometers. Conversely, a day trader must rely on short-term technical barometers like moving averages and volume oscillators. The discipline lies not in tracking every available indicator, but in mastering the ones that provide the most accurate signal for your specific time horizon.
Conclusion: Mastering the Financial Climate
Ultimately, the question of what barometers are used for can be answered in one word: clarity. In the complex, often chaotic world of personal and corporate finance, barometers provide the structure necessary to transform raw data into a narrative. They help investors move beyond guessing and toward calculated probability.
By keeping a close eye on the leading indicators that suggest where the economy is headed, monitoring volatility to manage risk, and staying attuned to interest rate shifts that define the cost of doing business, the informed investor can maintain their course regardless of the economic weather. Whether you are managing personal savings, steering a small business, or overseeing an institutional portfolio, these diagnostic tools are indispensable. The market will always have its cycles of high and low pressure, but with the right barometers in place, you are empowered to navigate through the storms and maximize the clear days to secure your financial future.
aViewFromTheCave is a participant in the Amazon Services LLC Associates Program, an affiliate advertising program designed to provide a means for sites to earn advertising fees by advertising and linking to Amazon.com. Amazon, the Amazon logo, AmazonSupply, and the AmazonSupply logo are trademarks of Amazon.com, Inc. or its affiliates. As an Amazon Associate we earn affiliate commissions from qualifying purchases.