
In the dynamic world of personal finance, investing, and business operations, numbers tell a story. But raw figures alone rarely provide the full picture. To truly understand growth, decline, or the impact of financial decisions, we need to speak the language of percentages. Specifically, mastering how to calculate a percentage increase is not just a mathematical exercise; it’s a fundamental skill that empowers individuals and businesses to make informed, strategic choices.
From tracking the growth of your investment portfolio and evaluating salary raises to analyzing sales performance or the relentless march of inflation, percentage increase offers a standardized and intuitive way to measure change relative to an initial state. It transforms absolute changes into digestible, comparable metrics, revealing the true scale of progress or regress. Without this tool, navigating the complexities of financial data would be like trying to read a map without a scale – you’d know locations, but never distances or proportions. This guide will demystify the process, explain its critical applications across the money landscape, and equip you with the knowledge to wield this powerful financial metric with confidence.

The Fundamental Concept: What is Percentage Increase?
At its core, a percentage increase quantifies how much a value has grown in relation to its original amount, expressed as a fraction of 100. It provides a standardized way to compare changes, regardless of the absolute numbers involved. Instead of merely stating that a value went up by $500, a percentage increase tells us if that $500 jump is significant for a starting value of $1,000 (a 50% increase) or less impactful for a starting value of $100,000 (a 0.5% increase). This relative perspective is paramount in financial analysis.
Defining the Increase: From Raw Numbers to Relative Growth
Imagine you start a side hustle and your monthly income jumps from $200 to $300. The raw number increase is $100. Now, consider a seasoned business owner whose monthly profit increases from $10,000 to $10,100. Again, the raw number increase is $100. While the absolute dollar amount of growth is identical, the impact and significance of that growth are vastly different.
This is precisely where relative growth, expressed as a percentage, becomes invaluable. For the side hustle, a $100 increase on a $200 base represents a substantial improvement. For the business owner, a $100 increase on a $10,000 base is a much smaller proportional gain. Percentage increase allows us to put these changes into proper context, enabling meaningful comparisons and evaluations that raw numbers alone cannot provide. It shifts our focus from the magnitude of the change to its proportional impact.
Why Relative Growth Matters in Finance
In the financial realm, virtually every metric benefits from a relative perspective. When discussing investments, a 10% return on a $1,000 investment is $100, while a 10% return on a $1,000,000 investment is $100,000. The absolute dollar amount differs greatly, but the rate of return – the percentage increase – tells us about the efficiency and success of the investment strategy itself, independent of the capital deployed.
Similarly, when evaluating a company’s financial health, investors aren’t just interested in the absolute increase in revenue; they want to know the percentage growth rate. A company with $10 million in revenue showing a 20% increase ($2 million absolute) might be considered more successful in its growth strategy than a company with $100 million in revenue showing a 5% increase ($5 million absolute), depending on industry benchmarks and expectations. Percentage increase provides the common denominator, the universal metric that allows for standardized analysis across diverse financial scenarios, making it an indispensable tool for anyone tracking money.
Mastering the Formula: Step-by-Step Calculation
Calculating a percentage increase is a straightforward process once you understand the underlying formula. It involves three key pieces of information: the original value, the new value, and the simple arithmetic operations to combine them. This method can be applied universally, whether you’re analyzing personal savings, market returns, or business metrics.
The Core Equation: (New Value – Original Value) / Original Value * 100%
The universal formula for calculating percentage increase is:
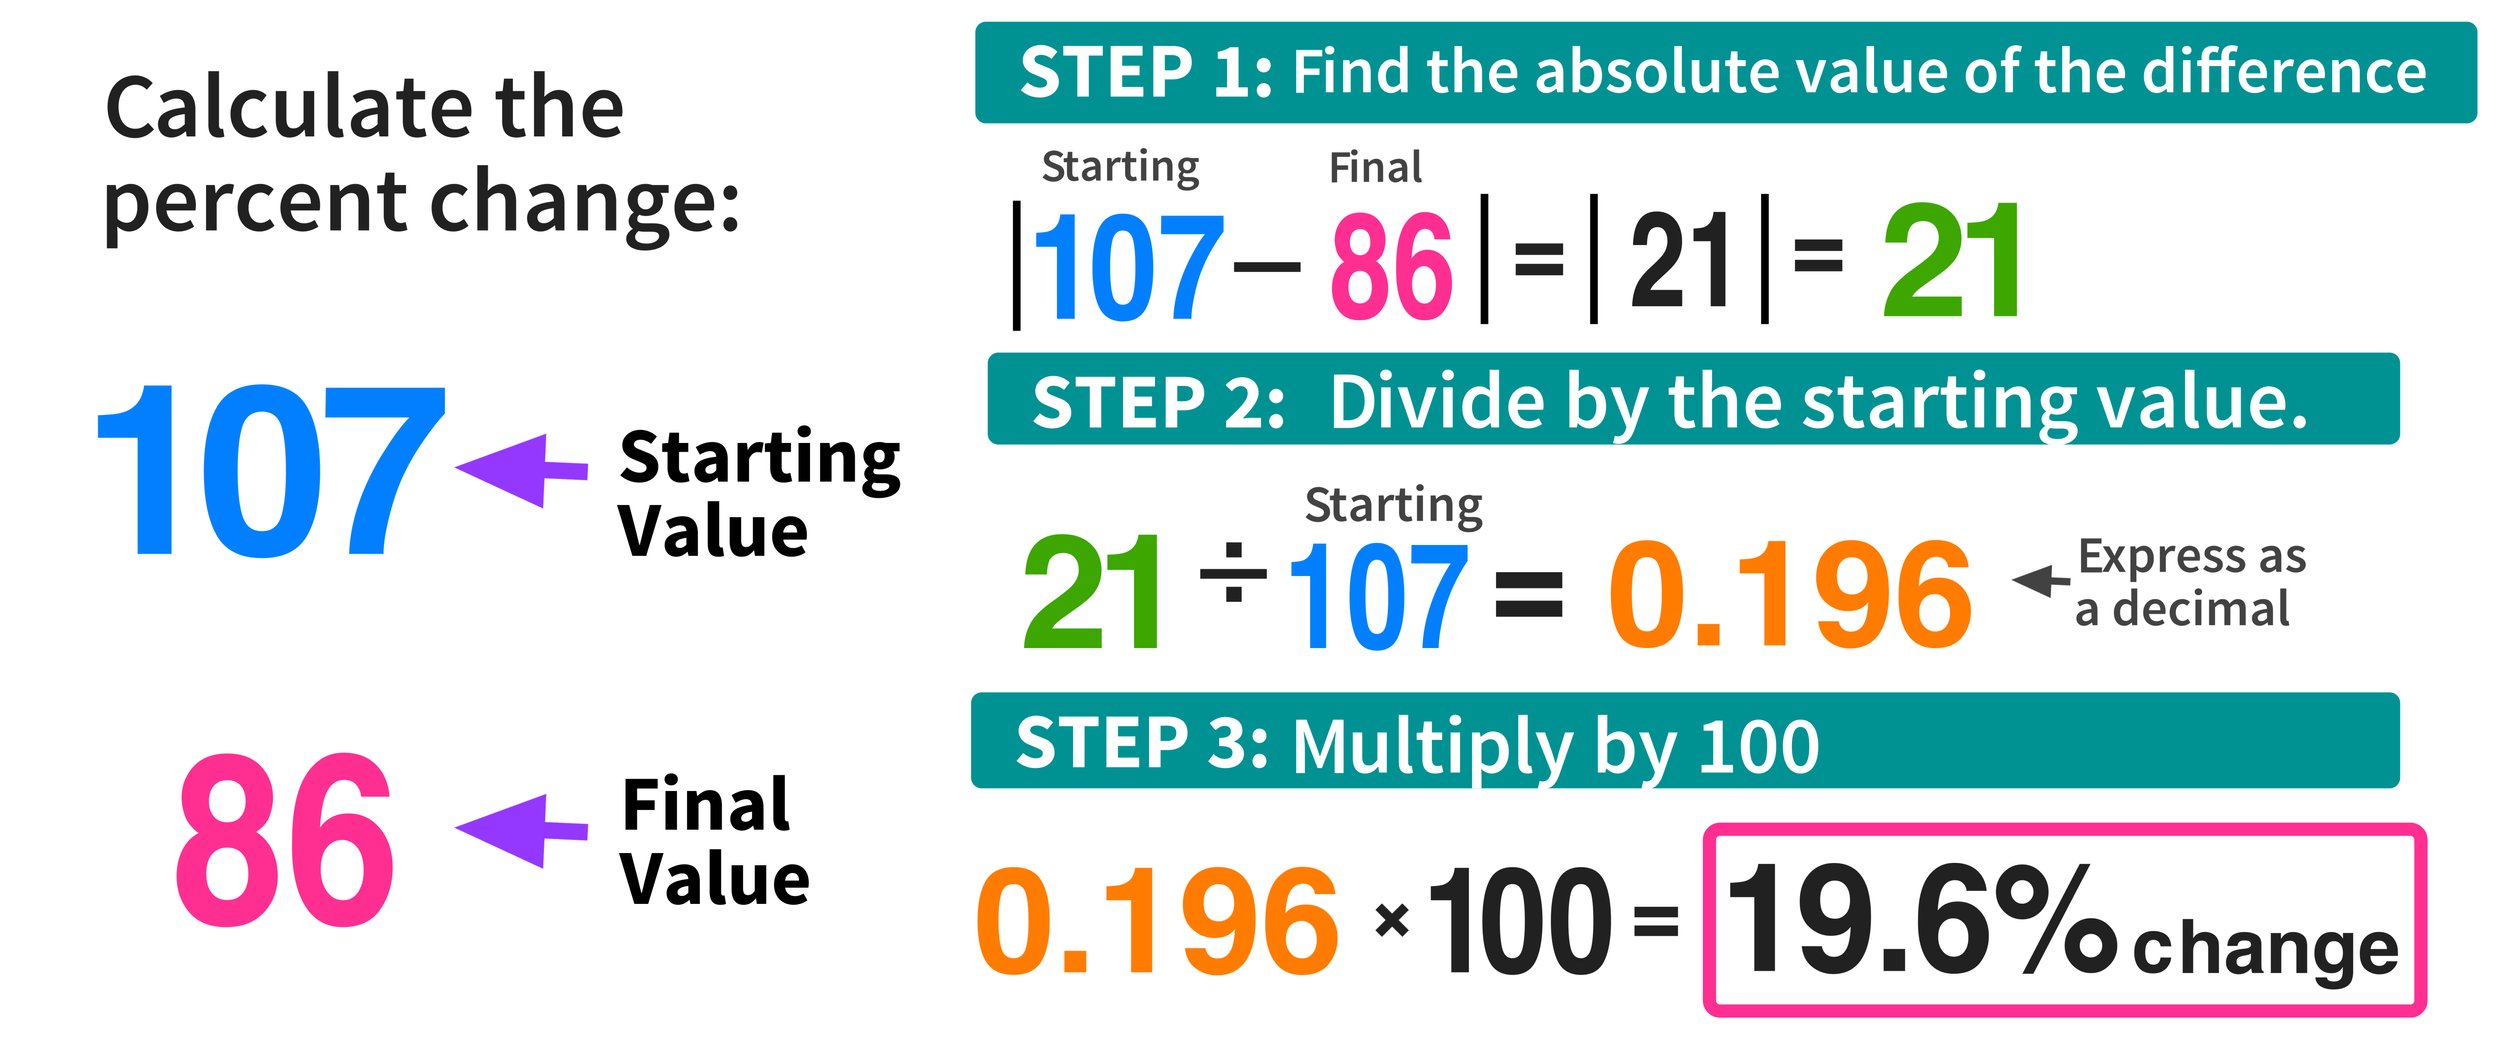
Percentage Increase = ((New Value – Original Value) / Original Value) * 100%
Let’s break down each component:
- New Value: This is the current, higher value after the increase has occurred.
- Original Value: This is the starting, initial, or base value before the increase.
- Difference (New Value – Original Value): This first step calculates the absolute amount of the increase.
- Divide by Original Value: This crucial step expresses the absolute increase as a decimal fraction of the original value. This tells you “how many times larger the increase is relative to the starting point.”
- Multiply by 100%: Finally, multiplying the result by 100 converts that decimal fraction into a percentage, making it easily understandable and comparable.
It’s vital that the “Original Value” is never zero, as division by zero is undefined. If the original value is zero, then any positive new value represents an infinite increase, which is typically handled as a special case or simply stated as “growth from zero.”
Practical Examples: From Salary Bumps to Investment Gains
Let’s apply this formula to common financial scenarios to solidify your understanding.
Example 1: Salary Increase
You started a job with a salary of $50,000 per year. After a successful year, you receive a raise, and your new annual salary is $54,000. What is your percentage increase in salary?
- Original Value: $50,000
- New Value: $54,000
- Calculate the difference: $54,000 – $50,000 = $4,000
- Divide by the original value: $4,000 / $50,000 = 0.08
- Multiply by 100%: 0.08 * 100% = 8%
Your salary increased by 8%. This figure is much more informative than just knowing you got a $4,000 raise, especially when comparing it to inflation rates or other job offers.
Example 2: Stock Market Return
You invested $1,500 in a particular stock. A year later, your investment is worth $1,800. What is the percentage increase (return) on your investment?
- Original Value: $1,500
- New Value: $1,800
- Calculate the difference: $1,800 – $1,500 = $300
- Divide by the original value: $300 / $1,500 = 0.2
- Multiply by 100%: 0.2 * 100% = 20%
Your investment yielded a 20% return. This metric allows you to compare the performance of this stock against other investment opportunities or benchmark indices.
Example 3: Business Revenue Growth
A small business generated $75,000 in revenue last quarter. This quarter, its revenue grew to $90,000. What is the percentage increase in revenue?
- Original Value: $75,000
- New Value: $90,000
- Calculate the difference: $90,000 – $75,000 = $15,000
- Divide by the original value: $15,000 / $75,000 = 0.2
- Multiply by 100%: 0.2 * 100% = 20%
The business experienced a 20% growth in revenue. This is a crucial metric for evaluating business performance, attracting investors, or assessing the effectiveness of marketing strategies.
By consistently applying this formula, you gain a powerful lens through which to view and interpret financial data, transforming raw numbers into meaningful insights.

Real-World Applications in Personal and Business Finance
The ability to calculate percentage increase extends far beyond academic exercises; it is a vital skill woven into the fabric of everyday financial literacy and strategic business decision-making. Its applications are ubiquitous, providing clarity where absolute numbers often fall short.
Personal Finance: Understanding Your Money’s Growth (or Cost)
For individuals, understanding percentage increase is key to managing and growing personal wealth.
Savings and Investments: Tracking Portfolio Performance
When you invest in stocks, bonds, mutual funds, or real estate, you’re constantly looking for growth. Percentage increase is the standard metric for reporting investment returns. If your portfolio increased from $10,000 to $11,500 over a year, that’s a 15% return. This allows you to compare your portfolio’s performance against market benchmarks (like the S&P 500’s percentage increase) or other investment options, helping you assess your strategy’s effectiveness and make adjustments.
Inflation: The Hidden Cost of Living
Inflation is perhaps one of the most critical percentage increases affecting personal finance. It represents the rate at which the general level of prices for goods and services is rising, and consequently, the purchasing power of currency is falling. If inflation is 3% annually, it means that, on average, goods and services cost 3% more than they did last year. Understanding this helps you demand salary increases that at least keep pace with inflation to maintain your standard of living, and it influences your investment strategies to seek returns that outpace inflation.
Debt and Interest Rates: When Percentages Work Against You
While we often focus on increases in assets, percentage increase also applies to liabilities, particularly in the form of interest rates on loans and credit cards. A credit card with a 20% Annual Percentage Rate (APR) means your balance is increasing by 20% per year if not paid down. Mortgage rates, car loan rates, and personal loan rates are all expressed as percentages, directly impacting the total cost of borrowing. Understanding these percentages is crucial for minimizing debt and making informed borrowing decisions.
Business Finance: Gauging Performance and Making Decisions
For businesses, percentage increase is an indispensable tool for analyzing operational efficiency, market position, and financial health.
Sales and Revenue Growth
One of the most common applications is tracking sales and revenue growth. A business might report a 15% year-over-year revenue increase or a 5% quarter-over-quarter sales increase for a particular product line. These percentages are vital for assessing market penetration, the success of marketing campaigns, and overall business expansion. Consistent positive percentage growth signals a healthy, expanding business, attracting investors and facilitating strategic planning.
Profit Margin Analysis
Beyond top-line revenue, businesses closely monitor profit margins. A gross profit margin (gross profit as a percentage of revenue) or net profit margin (net profit as a percentage of revenue) are critical indicators of profitability. While not a direct percentage increase calculation in the same way, changes in these percentages from one period to the next are often discussed as percentage point increases or decreases, demonstrating improvements or deteriorations in cost management or pricing strategy. For instance, if your net profit increased from $50,000 to $60,000 while revenue remained flat, this represents a significant improvement in efficiency, which would be reflected in your profit margin percentage.
Budgeting and Cost Control
Businesses often set budgets for various departments and expenses. Analyzing actual expenditure against budgeted figures often involves percentage increases. If the marketing budget was $10,000 and actual spending was $12,000, that’s a 20% increase over budget, prompting an investigation into cost overruns. Similarly, businesses might aim to reduce costs by a certain percentage, making percentage decrease equally important in this context, all stemming from the same foundational understanding of relative change.
In both personal and business finance, percentage increase provides the context needed to transform raw numbers into actionable intelligence. It’s the magnifying glass that helps us scrutinize financial trends and the compass that guides us toward sound economic decisions.
Leveraging Tools for Accuracy and Efficiency
While understanding the formula for percentage increase is fundamental, manually performing calculations for every financial data point can be tedious and prone to error, especially when dealing with large datasets or frequent analysis. Fortunately, numerous tools are available to streamline this process, ensuring accuracy and saving valuable time.
Basic Calculators and Mobile Apps
For quick, isolated calculations, a basic scientific or financial calculator is perfectly adequate. Most standard calculators include a percentage button (%) that can simplify some steps, though understanding the manual calculation ensures you can always perform it regardless of the calculator’s specific functions. Many smartphones also come with built-in calculator apps that work just as effectively.
- How to use: Input your new value, subtract your original value, divide by the original value, then multiply by 100. For example,
(1800 - 1500) / 1500 * 100 = 20.
Spreadsheets (Excel, Google Sheets): Automating Complex Calculations
For managing larger datasets, performing recurring calculations, or creating dynamic financial models, spreadsheet software like Microsoft Excel or Google Sheets is indispensable. Spreadsheets allow you to input your original and new values, then use formulas to automatically calculate the percentage increase, which can then be dragged down to apply to hundreds or thousands of rows of data instantly.
- Example Formula in Excel/Google Sheets:
If your Original Value is in cell A2 and your New Value is in cell B2, the formula for percentage increase in cell C2 would be:
=(B2-A2)/A2
Then, format cell C2 as a percentage (e.g., “0.00%”) to display the result as a percentage (e.g., 20.00%). This automatically multiplies by 100 and adds the percentage symbol.
Spreadsheets are particularly powerful because they allow for “what-if” analysis. You can change an original or new value, and the percentage increase will instantly update, making them invaluable for budgeting, forecasting, and investment scenario planning.
Online Financial Calculators
The internet offers a plethora of specialized online financial calculators, many of which include dedicated percentage increase calculators. These tools are often free, easy to use, and designed for specific financial contexts (e.g., investment return calculators, inflation calculators). They typically require you to input just the original and new values and instantly provide the percentage increase, sometimes even showing the calculation steps or related information.
- Benefits: User-friendly interfaces, often mobile-responsive, quick results, and sometimes offer additional contextual information.
- Search terms: “percentage increase calculator,” “investment return calculator,” “financial percentage calculator.”
While these tools simplify the process, a foundational understanding of the percentage increase formula ensures you can verify results, troubleshoot errors, and confidently interpret the numbers they provide. Relying solely on a tool without understanding the underlying math can lead to misinterpretations or an inability to adapt to unique financial situations.
Common Pitfalls and Advanced Considerations
While the concept of percentage increase seems straightforward, there are nuances and potential misunderstandings that can lead to incorrect conclusions, especially in complex financial scenarios. A deeper understanding ensures accurate interpretation and more robust financial analysis.
The Difference Between Percentage Point and Percentage Change
This is a common area of confusion. A percentage change (which is what we’ve been discussing) refers to the relative increase or decrease of a value. For example, if a stock price goes from $100 to $120, that’s a 20% increase.
A percentage point change, however, describes the absolute difference between two percentages. For instance, if a company’s profit margin increased from 10% to 12%, that’s a 2 percentage point increase (12% – 10% = 2 percentage points), not a 2% increase in the margin itself. To calculate the percentage change of the profit margin, you would use the formula: ((12% - 10%) / 10%) * 100% = (0.02 / 0.10) * 100% = 20%. This means the profit margin itself increased by 20%. Understanding this distinction is crucial when analyzing financial reports or economic data.
Understanding Compounding Effects
In finance, percentage increases often don’t occur in isolation; they compound over time. Compounding means that an initial increase (or return) also earns interest or growth in subsequent periods. This is most evident in investments. If you earn a 10% return on an investment of $1,000 in year one, you have $1,100. In year two, if you earn another 10%, that 10% is calculated on the new principal of $1,100, not just the original $1,000, resulting in a $110 gain for a total of $1,210.
Understanding compound annual growth rate (CAGR) becomes important here. CAGR is a more sophisticated measure that smooths out volatile returns to show a consistent annual growth rate over a specified period, taking compounding into account. While the simple percentage increase calculates a single period’s change, compounding illustrates the exponential power of sustained percentage growth over multiple periods, a cornerstone of long-term wealth building.
When to Use Other Metrics
While percentage increase is incredibly useful, it’s not always the sole or best metric.
- When comparing vastly different base values: A 100% increase from $1 to $2 is less impactful than a 10% increase from $1,000,000 to $1,100,000. Absolute dollar amounts can still provide valuable context that percentages alone might obscure.
- When dealing with very small numbers or zero: As mentioned, division by zero is undefined. If an original value is 0, percentage increase is technically infinite, making it an unhelpful metric. In such cases, simply stating the absolute increase or growth from zero is more appropriate.
- In specific financial analyses: Other metrics like return on equity (ROE), earnings per share (EPS), price-to-earnings (P/E) ratios, or debt-to-equity ratios might be more relevant for specific analyses of company performance or valuation, though many of these still rely on underlying percentage calculations.
Ultimately, mastering the calculation and interpretation of percentage increase is a fundamental building block of financial literacy. It empowers you to dissect financial data, understand economic trends, and make more astute decisions, whether managing your personal savings or steering a multi-million dollar business. By avoiding common pitfalls and considering broader financial contexts, you can harness this powerful tool to gain profound insights into the ever-evolving world of money.
aViewFromTheCave is a participant in the Amazon Services LLC Associates Program, an affiliate advertising program designed to provide a means for sites to earn advertising fees by advertising and linking to Amazon.com. Amazon, the Amazon logo, AmazonSupply, and the AmazonSupply logo are trademarks of Amazon.com, Inc. or its affiliates. As an Amazon Associate we earn affiliate commissions from qualifying purchases.