
In the intricate world of finance, numbers tell a story. But raw figures alone often lack the context needed to truly understand performance, growth, or decline. This is where the ability to calculate and interpret percentage difference becomes an indispensable tool. Whether you’re a meticulous personal budgeter, an astute investor, an aspiring entrepreneur, or a seasoned business owner, mastering this fundamental mathematical concept is crucial for making informed, strategic financial decisions.
Percentage difference allows us to quantify the relative change or discrepancy between two values, providing a standardized metric that transcends the absolute scale of the numbers themselves. It helps us answer critical questions like: How much has my investment portfolio grown this year? By what margin did our sales increase compared to the last quarter? What is the relative difference in interest rates between two savings accounts? Without this skill, navigating the complexities of personal finance, investment analysis, and business operations would be akin to flying blind. This guide will demystify the calculation, explore its myriad applications within the financial realm, and equip you with the insights to leverage it for your financial success.

Understanding the Core Concept: What is Percentage Difference?
At its heart, percentage difference is a way to express the relationship between two numbers as a proportion of their average, or sometimes, as a proportion of one of the numbers themselves (which is more accurately termed “percentage change”). It provides a standardized way to compare values, regardless of their magnitude, making it easier to assess the impact of changes or the relative performance of different financial entities.
Defining Percentage Difference in Financial Context
In finance, we are constantly comparing data points: current stock price versus purchase price, this quarter’s revenue versus last quarter’s, budgeted expenses versus actual expenses. Percentage difference offers a clear, relative measure of how significant these comparisons are. It tells you not just how much something changed, but how much it changed relative to its starting point or the overall scale involved. This relative perspective is vital because a $100 increase means very different things if your initial investment was $1,000 versus $100,000.
While the term “percentage difference” can sometimes refer to the symmetrical difference relative to the average of the two values, in financial discourse, it very frequently overlaps with “percentage change.” For practical financial analysis, understanding both nuances and their appropriate application is key.
Distinguishing from Percentage Change
It’s important to clarify the distinction between “percentage difference” and “percentage change,” as they are often used interchangeably, yet can have slightly different implications depending on the context.
- Percentage Change: This is typically calculated as
((New Value - Old Value) / Old Value) * 100%. It measures the change relative to the initial or base value. This is overwhelmingly the most common calculation used in finance for tracking growth, decline, returns on investment, and performance metrics. A positive result indicates growth, while a negative result indicates a decrease. - Symmetrical Percentage Difference: This more formal definition of percentage difference is calculated as
(|Value 1 - Value 2| / ((Value 1 + Value 2) / 2)) * 100%. This formula is useful when there isn’t a clear “old” or “new” value, and you simply want to express the magnitude of the difference between two values as a percentage of their average. For instance, comparing the price of an item at two different stores where neither is definitively the “original.”
For the vast majority of financial applications involving tracking performance over time (e.g., investment growth, revenue shifts), the percentage change formula is what most people are referring to when they talk about “percentage difference.” We will primarily focus on this application, while acknowledging the symmetrical definition where appropriate.
The Formula and Step-by-Step Calculation
To effectively use percentage difference in your financial analysis, you need to understand the underlying formulas and how to apply them correctly. Let’s break down the most relevant formulas for financial contexts.
The Financial Application: Percentage Change Formula
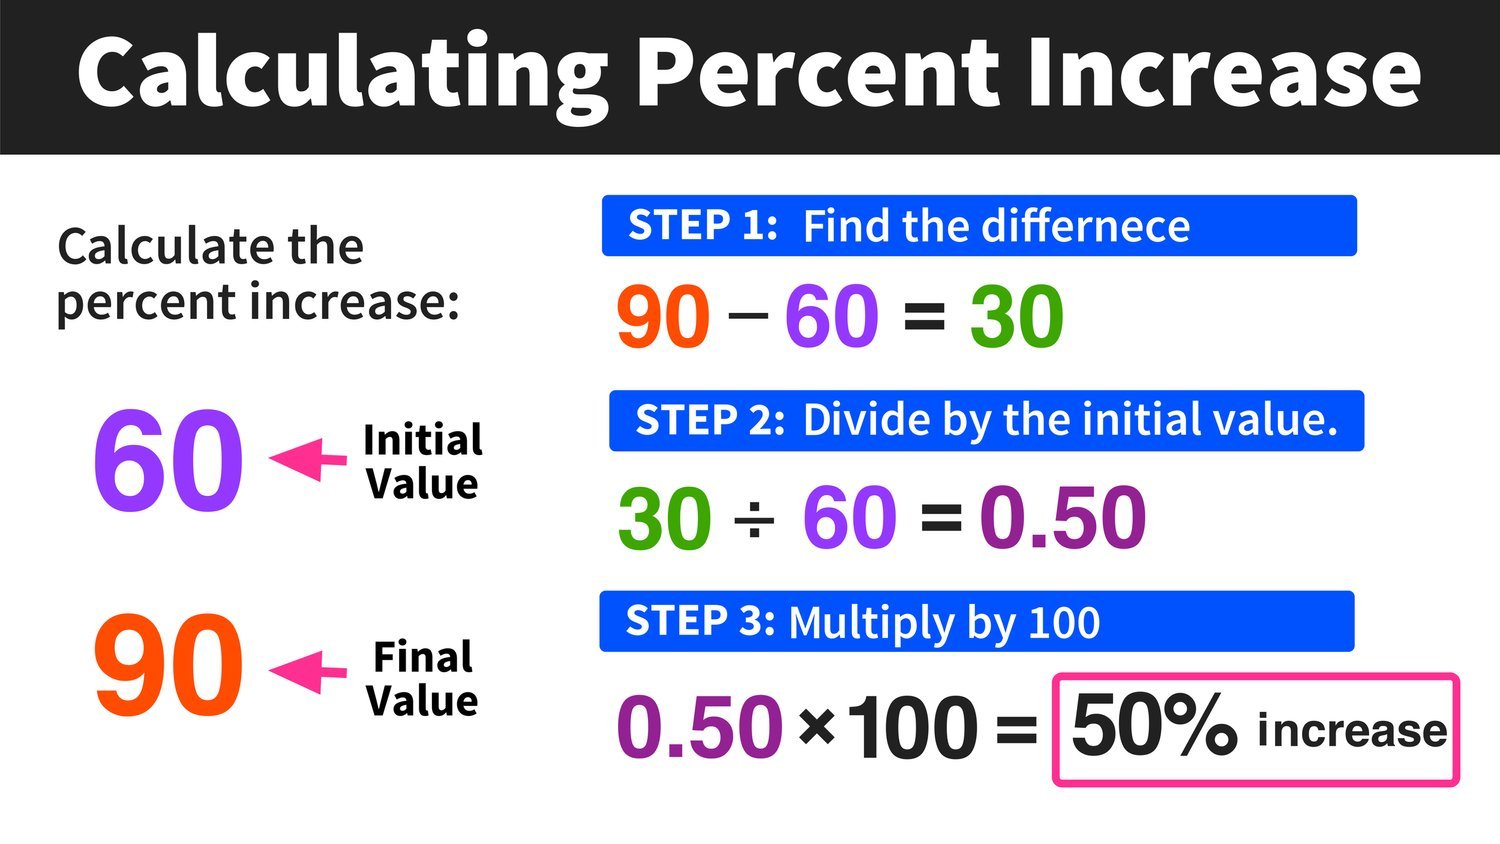
As established, this is the workhorse formula for most financial tracking and analysis. It quantifies how much a value has increased or decreased relative to its starting point.
The formula is:
Percentage Change = ((New Value - Old Value) / Old Value) * 100%
Let’s dissect the components:
- New Value: This is the more recent or final figure you are comparing.
- Old Value: This is the initial or original figure that serves as your baseline.
- (New Value – Old Value): This calculates the absolute change between the two figures. A positive result means an increase; a negative result means a decrease.
- (/ Old Value): Dividing the absolute change by the Old Value expresses that change as a decimal fraction of the original.
- (* 100%): Multiplying by 100 converts that decimal fraction into a percentage.
A Walkthrough Example: Investment Growth
Imagine you invested $5,000 in a particular stock. After one year, your investment is now worth $6,250. You want to know the percentage growth of your investment.
-
Identify the Old Value and New Value:
- Old Value (Initial Investment) = $5,000
- New Value (Current Value) = $6,250
-
Calculate the Absolute Change:
- Change = New Value – Old Value = $6,250 – $5,000 = $1,250
-
Divide the Change by the Old Value:
- Relative Change = $1,250 / $5,000 = 0.25
-
Multiply by 100 to get the Percentage:
- Percentage Change = 0.25 * 100% = 25%
Your investment grew by 25%. This 25% figure is far more insightful than just knowing your investment grew by $1,250, especially if you’re comparing it to other investments or market benchmarks.
The General Percentage Difference Formula (Symmetrical)
While less commonly used for tracking historical performance, it’s good to be aware of the symmetrical percentage difference for scenarios where neither value is a distinct “start” or “end.”
The formula is:
Percentage Difference = (|Value 1 - Value 2| / ((Value 1 + Value 2) / 2)) * 100%
|Value 1 - Value 2|: The absolute difference between the two values (the order doesn’t matter here).((Value 1 + Value 2) / 2): The average of the two values.
Example: You see a financial advisory service offering a management fee of 0.8% and another offering 1.2%. What is the symmetrical percentage difference between these two fees?
- Values: Value 1 = 0.8, Value 2 = 1.2
- Absolute Difference:
|0.8 - 1.2| = |-0.4| = 0.4 - Average of Values:
(0.8 + 1.2) / 2 = 2.0 / 2 = 1.0 - Percentage Difference:
(0.4 / 1.0) * 100% = 40%
The symmetrical percentage difference between the two fees is 40%. This shows the magnitude of the difference relative to their average.
Practical Applications in Personal and Business Finance

The ability to calculate percentage difference (or percentage change) is not merely an academic exercise; it’s a fundamental skill with countless real-world applications across personal and business finance.
Analyzing Investment Returns
This is perhaps one of the most common and critical uses. Investors constantly assess the performance of their assets.
- Stock Performance: Did a stock go from $50 to $55? That’s a 10% gain. From $50 to $45? A 10% loss. This standardized metric helps compare different stocks, even if their initial prices were vastly different.
- Portfolio Growth: Tracking your entire investment portfolio’s growth quarter-over-quarter or year-over-year. A 7% annual return might be good, but a negative 3% needs investigation.
- Mutual Fund/ETF Returns: Comparing the percentage returns of various funds over specific periods to make informed allocation decisions.
- Real Estate Appreciation: Calculating the percentage increase in property value over time to understand investment performance.
Evaluating Budget Variance and Savings Goals
For personal finance, percentage difference is invaluable for keeping your budget on track and achieving savings targets.
- Budget Variance: Comparing actual expenses against budgeted expenses. If you budgeted $500 for groceries but spent $600, that’s a 20% overspend. Identifying these variances in percentage terms highlights areas where you need to adjust your spending habits.
- Savings Progress: Measuring how close you are to a savings goal. If your goal is $10,000 and you’ve saved $7,500, you’ve reached 75% of your goal. You can also track your monthly or yearly savings growth in percentage terms.
- Debt Reduction: Calculating the percentage reduction in your debt load over time, which can be a powerful motivator.
Assessing Business Performance
For entrepreneurs and business owners, percentage difference is a vital metric for evaluating operational health and strategic growth.
- Revenue Growth: Comparing current sales figures to previous periods (month-over-month, year-over-year) to understand market trends and the effectiveness of sales strategies. E.g., a 15% increase in revenue.
- Profit Margin Shifts: Analyzing changes in gross profit margin or net profit margin. A shrinking margin percentage can signal rising costs or pricing issues, even if total profit dollars remain stable.
- Expense Control: Monitoring percentage changes in operating expenses. A significant percentage increase in a specific expense category might indicate inefficiencies or areas needing cost reduction.
- Customer Acquisition Cost (CAC) vs. Lifetime Value (LTV): While these are not direct percentage differences, understanding the percentage increase or decrease in these metrics over time, and their ratio, is crucial for business health.
Comparing Financial Products and Deals
From loans to discounts, percentage difference helps consumers and businesses make smarter choices.
- Loan Interest Rates: While simple comparison is often enough, understanding the percentage point difference can highlight the impact on total interest paid.
- Discount Percentages: When shopping, quickly calculating the actual percentage off an item helps assess the real value of a sale.
- Return on Different Investments: Comparing the percentage yield of different investment vehicles (e.g., bonds vs. savings accounts) helps in portfolio diversification.
Common Pitfalls and Best Practices
While calculating percentage difference might seem straightforward, certain nuances can lead to misinterpretations or errors. Awareness of these common pitfalls and adherence to best practices will ensure your financial analysis is robust and accurate.
The Importance of the Base Value (Old Value)
One of the most frequent errors in calculating percentage change is incorrectly identifying the “Old Value” or base. The base value must be the starting point or the value you are comparing from.
- Scenario: A stock drops from $100 to $50 (a 50% decrease). If it then recovers from $50 back to $100, that’s a 100% increase ( ($100-$50)/$50 * 100% ). It’s not a 50% increase to match the 50% decrease.
- Best Practice: Always double-check which value serves as the initial reference point. In financial reporting, this is usually the prior period’s figure.
Handling Negative Numbers and Zero Values
These situations require special attention to avoid mathematical errors or meaningless results.
- Starting from Zero: If your “Old Value” is zero, the percentage change formula
((New Value - Old Value) / Old Value) * 100%results in division by zero, which is undefined. In such cases (e.g., starting a new venture with zero revenue and gaining $1,000), it’s more appropriate to state the absolute gain and contextualize it, or declare an “infinite percentage growth.” - Negative Old Value: If your base value is negative (e.g., comparing a larger loss to a smaller loss, or a loss to a profit), the interpretation of the percentage can become counter-intuitive. For instance, moving from -$100 to -$50 is a 50% increase in value (less negative), but the calculation would show
(-$50 - -$100) / -$100 = $50 / -$100 = -0.5 = -50%. This can be misleading. In these scenarios, it’s often better to focus on absolute changes or reframe the problem (e.g., “reduced debt by X dollars” instead of “X% change in debt”). - Best Practice: Be cautious with zeros and negatives. For zero, consider absolute change or a non-percentage statement. For negative bases, explicitly state the values and the nature of the change (e.g., “loss reduced from X to Y”).
Contextualizing Your Financial Calculations
A percentage alone doesn’t always tell the whole story. Context is paramount in finance.
- Magnitude Matters: A 100% return on a $10 investment is $10. A 10% return on a $1,000,000 investment is $100,000. While the percentage for the smaller investment is higher, the absolute gain is significantly less.
- Time Horizon: A 20% growth over one year is excellent. A 20% growth over five years might be less impressive. Always specify the period over which the change occurred.
- Comparisons and Benchmarks: Is a 15% revenue growth good? It depends on industry averages, competitor performance, and your own company’s historical growth rates. A percentage is most useful when compared against a relevant benchmark.
- Best Practice: Always present percentage differences alongside their absolute values and within the broader financial narrative.
Tools and Software for Efficiency
While manual calculation is good for understanding, for repeated analysis, leverage technology.
- Spreadsheets (Excel, Google Sheets): These are indispensable. Formulas like
=(B2-A2)/A2(formatted as a percentage) make calculations instant and scalable. - Financial Calculators: Many online or physical financial calculators have dedicated percentage change functions.
- Online Tools: Websites and apps often provide built-in calculators for various financial metrics.
Mastering Percentage Difference for Strategic Financial Decisions
The journey from raw financial data to actionable insights is often paved with calculations like percentage difference. It transforms isolated figures into meaningful metrics, enabling a deeper understanding of financial dynamics.
From Data to Insight: Making Informed Choices
By consistently applying percentage difference calculations, you gain several strategic advantages:
- Early Trend Detection: Spotting small percentage shifts early can help you capitalize on opportunities or mitigate risks before they escalate. A consistent 2% month-over-month decline in a specific revenue stream, when aggregated, might signal a larger problem.
- Performance Benchmarking: You can quantitatively compare your performance (personal savings, investment returns, business growth) against industry standards, competitors, or your own historical averages.
- Resource Allocation: Understanding which investments are yielding the highest percentage returns or which marketing channels are driving the highest percentage growth can inform where to allocate more capital.
- Negotiation Power: Knowing the percentage change in market prices or interest rates equips you with stronger data points for financial negotiations.
Continual Monitoring and Adjustment
Financial management is not a one-time event; it’s an ongoing process. Percentage difference plays a crucial role in this iterative cycle:
- Regular Review: Periodically calculating percentage changes in your budget, investment portfolio, or business financials allows for continuous assessment.
- Adaptability: When percentage differences reveal deviations from your goals or expectations, you can make timely adjustments to your strategies, spending habits, or investment allocations.
- Goal Tracking: Seeing your savings grow by 5% this quarter, or your debt reduce by 10% this year, provides clear, measurable progress that can motivate further action.
In conclusion, the ability to accurately work out percentage difference, particularly its application as percentage change, is far more than just a mathematical trick. It’s a fundamental pillar of financial literacy, empowering individuals and businesses to transform complex data into clear, actionable intelligence. By embracing this skill, you move beyond merely observing numbers to truly understanding their story, enabling you to navigate the financial landscape with greater confidence, precision, and strategic foresight. Make percentage difference a core part of your financial toolkit, and unlock a more insightful path to prosperity.
aViewFromTheCave is a participant in the Amazon Services LLC Associates Program, an affiliate advertising program designed to provide a means for sites to earn advertising fees by advertising and linking to Amazon.com. Amazon, the Amazon logo, AmazonSupply, and the AmazonSupply logo are trademarks of Amazon.com, Inc. or its affiliates. As an Amazon Associate we earn affiliate commissions from qualifying purchases.