
Thinkorswim, TD Ameritrade’s premier trading platform (now part of Charles Schwab), offers a robust suite of tools designed for serious investors and active traders. From intricate options strategies to futures and forex, its capabilities cater to a wide spectrum of financial markets. Mastering thinkorswim involves understanding its powerful interface, utilizing its analytical features, and executing trades efficiently to optimize investment outcomes. This guide delves into navigating the platform to leverage its full potential for informed financial decision-making.
Getting Started: Navigating the thinkorswim Platform
The initial steps to using thinkorswim involve setting up your account and familiarizing yourself with the platform’s comprehensive layout. A strategic approach to learning its interface can significantly enhance your trading efficiency and analytical capabilities.
Account Setup and Login
Before accessing the live trading environment, you’ll need a funded brokerage account with Charles Schwab (formerly TD Ameritrade). Once your account is active, you can download the thinkorswim desktop application, which offers the most complete feature set. Alternatively, web-based and mobile versions provide flexibility for trading on the go, though with some feature limitations. Log in using your Schwab credentials. For new users, it’s highly recommended to begin with PaperMoney, thinkorswim’s simulated trading environment, to practice strategies and platform navigation without risking real capital. This sandbox environment mirrors live market conditions, providing an invaluable learning experience for managing financial risk and refining investment tactics.
Understanding the Main Interface Layout
The thinkorswim interface is divided into several key areas, each serving a specific purpose in your trading workflow:
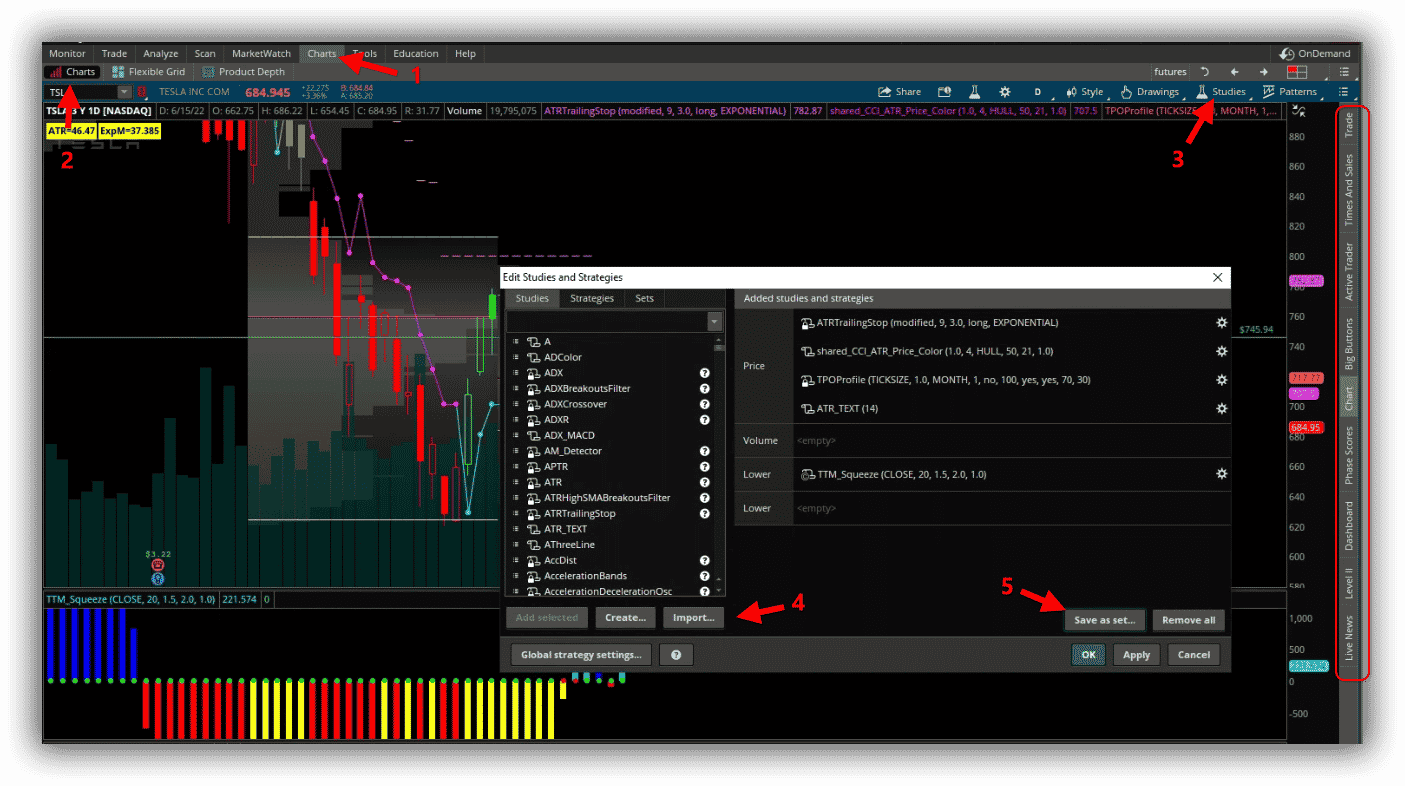
- Tabs (Monitor, Trade, Analyze, Scan, MarketWatch, Charts, Tools, Education): Located at the top, these primary tabs organize the platform’s core functionalities. The “Trade” tab is where order entry occurs, “Charts” provides technical analysis capabilities, and “Monitor” tracks your positions and account activity.
- Gadgets: Positioned on the left sidebar, gadgets are customizable mini-windows offering quick access to information like watchlists, news, live broader market indices, and account details. They can be expanded, collapsed, or detached to suit your analytical preferences.
- Main Display Area: This central space dynamically changes based on the selected tab and sub-tabs, presenting detailed charts, order entry modules, analytical tools, or account summaries.
- Footer: The bottom bar displays critical account metrics such as net liquidation value, buying power, and profit/loss figures, offering a real-time snapshot of your financial standing.
Customizing Your Workspace for Trading Efficiency
Thinkorswim’s highly customizable nature is one of its strongest assets. Tailoring your workspace can dramatically improve your ability to monitor markets and execute trades. You can:
- Create Multiple Layouts: Save different layouts for various trading styles (e.g., one for day trading, one for long-term options analysis).
- Rearrange and Resize Windows: Drag and drop elements like charts, order entry modules, and time and sales windows to your preferred positions. Resize them to maximize visibility of critical data.
- Link Components: Utilize the “link” feature (represented by a chain icon) to connect elements. For example, linking a watchlist to a chart and an order entry module means selecting a symbol in the watchlist automatically populates the chart and trade ticket with that symbol, streamlining the research-to-execution process. This integration is vital for rapid financial analysis and quick trade placement in fast-moving markets.
- Personalize Gadgets: Add or remove gadgets from the left sidebar to show only the information most relevant to your investment strategy, such as specific news feeds or economic calendars.
Core Trading Functionalities and Order Entry
At its heart, thinkorswim is a powerful trading engine. Understanding how to place various order types and manage your positions is fundamental to leveraging the platform for financial gain and risk management.
Placing Trades: Stocks, Options, Futures, and Forex
The “Trade” tab is your primary hub for executing transactions across diverse asset classes.
- Stocks: Navigate to the “All Products” sub-tab within the “Trade” tab. Enter the stock symbol, and the order entry tool will appear. Specify the quantity, order type (market, limit, stop, etc.), and time-in-force.
- Options: The “Option Chain” sub-tab is indispensable for options traders. Here, you can view calls and puts for various strike prices and expirations. Click on the bid or ask price of an option contract to populate an order ticket. Thinkorswim excels in building complex options strategies (e.g., spreads, iron condors) directly from the chain, allowing you to select multiple legs simultaneously, visualizing the potential profit/loss profile before execution.
- Futures: The “Futures Trader” interface (under the “Trade” tab) offers a specialized view for futures contracts. It provides a depth-of-market ladder, allowing for rapid order placement directly from the bid/ask prices.
- Forex: The “Forex Trader” sub-tab (also under “Trade”) provides a dedicated interface for currency pairs, similar to the futures trader, with direct buy/sell buttons and real-time quotes for efficient foreign exchange trading.
Advanced Order Types and Strategies
Thinkorswim empowers traders with a wide array of sophisticated order types crucial for risk management and strategy implementation:
- Bracket Orders (OCO – One-Cancels-the-Other): Attach a profit-taking limit order and a stop-loss order to your initial entry. If one order fills, the other is automatically canceled. This is invaluable for defining your risk and reward parameters upfront.
- Trailing Stops: A stop-loss order that automatically adjusts as the price of your asset moves favorably. This allows you to lock in profits while maintaining protection against adverse reversals.
- Conditional Orders: Execute an order only when specific market conditions are met (e.g., “Buy 100 shares of XYZ if its price crosses above $50”).
- Economies of Scale in Orders: For larger positions, consider using time-in-force options like “DAY+” or “GTC” (Good Till Canceled) to manage how long your order remains active. Understanding these nuanced order types is critical for optimizing execution and protecting your capital in dynamic market environments.
Monitoring Positions and Managing Risk
The “Monitor” tab is your control center for active management.
- Activity and Positions: This sub-tab provides a real-time overview of your open positions, showing quantities, average price, mark price, profit/loss, and overall account performance. It’s essential for tracking investment performance and identifying areas for adjustment.
- Order Status: Keep an eye on working orders, filled orders, and canceled orders. Ensure your orders are executed as intended and manage any pending instructions.
- Risk Profile (Analyze Tab): For options traders, the “Analyze” tab’s “Risk Profile” tool is indispensable. It graphically displays the potential profit or loss of your entire options portfolio or a specific strategy across various underlying price points and future dates, helping you visualize and manage risk exposure. Proactive risk management through these tools is a cornerstone of sustainable investing.
Advanced Analytical Tools for Informed Decisions
Beyond order entry, thinkorswim’s strength lies in its comprehensive analytical toolkit, enabling investors to conduct in-depth market research and formulate data-driven strategies.
Charting and Technical Analysis: Indicators and Drawing Tools
The “Charts” tab is a technical analyst’s paradise.
- Customizable Chart Types: Choose from candlestick, bar, line, Heikin Ashi, and more. Adjust timeframes from tick charts to yearly intervals.
- Extensive Indicator Library: Access hundreds of built-in technical indicators (e.g., Moving Averages, MACD, RSI, Bollinger Bands). You can overlay multiple indicators, customize their parameters, and even create your own using thinkorswim’s proprietary scripting language, “thinkScript.”
- Drawing Tools: Utilize tools like trend lines, Fibonacci retracements, Gann fans, and more to identify patterns, support/resistance levels, and potential price targets. These visual aids are crucial for identifying investment opportunities and managing trade exits.
- Backtesting: Thinkorswim allows users to backtest strategies on historical data, providing insights into their potential performance under past market conditions. This feature is invaluable for refining a trading methodology before deploying real capital.
Fundamental Analysis and Research Tools
While often associated with technical trading, thinkorswim also provides resources for fundamental analysis.
- Company Profile (Charts/Trade Tab): Access key financial data, company descriptions, earnings reports, and news directly associated with a stock symbol.
- Financials (Analyze Tab): Dive into a company’s income statement, balance sheet, and cash flow statements, enabling thorough due diligence on an investment’s underlying health.
- Earnings and Dividends: Easily view upcoming earnings dates and dividend distributions, critical factors for long-term equity investors.
Scanning and Screening for Opportunities
The “Scan” tab is a powerful feature for identifying potential investment opportunities that fit specific criteria.
- Stock Hacker: Create custom scans using a vast array of filters based on price, volume, technical indicators, fundamental data, and even implied volatility. For example, you can scan for stocks with low P/E ratios experiencing a MACD crossover.
- Option Hacker: Similar to the Stock Hacker, but tailored for options contracts. Scan for options meeting specific criteria like high open interest, unusual volume, or specific implied volatility levels.
- Spread Hacker: Identify options spread strategies that meet your defined risk/reward parameters.
- Alerts: Set up real-time alerts for price changes, indicator crosses, or news events for any security, ensuring you don’t miss critical market movements relevant to your portfolio. These proactive tools are key for discovering valuable financial assets and executing timely trades.
The thinkorswim Education Center and Learning Resources
Thinkorswim offers a dedicated “Education” tab, providing a wealth of learning materials from tutorials and webcasts to courses. This resource helps users understand the platform’s features, learn trading concepts, and explore various investment strategies, all aimed at improving financial literacy and trading proficiency.
Portfolio Management and Account Oversight
Effective portfolio management is crucial for long-term investment success. Thinkorswim provides comprehensive tools to track performance, manage risk, and oversee your entire financial picture.
Tracking Performance and P&L
The “Monitor” tab, specifically the “Activity and Positions” sub-tab, is your central hub for tracking the performance of your investments.
- Real-time P&L: View your real-time profit and loss (P&L) for individual positions, groups of positions, and your overall account. This includes both day P&L and total P&L.
- Account Statement: Access detailed statements of your account activity, including trades, dividends, interest, and deposits/withdrawals. This is essential for record-keeping and tax purposes.
- Realized vs. Unrealized Gains/Losses: Easily differentiate between open position performance (unrealized) and completed trade results (realized), providing a clear financial snapshot of your investment journey.
Managing Watchlists and Alerts
Effective organization and timely notification are paramount in trading.
- Watchlists: Create and customize multiple watchlists to track specific stocks, options contracts, or other securities you are interested in. You can add columns to display key metrics like last price, change, volume, P/E ratio, and implied volatility.
- Alerts: Set up price alerts, volume alerts, or technical indicator alerts for any security in your watchlist or overall market indices. These alerts can notify you via desktop popup, email, or SMS, ensuring you stay informed of critical market developments even when you’re not actively watching the screen. This proactive monitoring helps in identifying potential entry or exit points for your investments.
Understanding Your Account Balances and Margin
The footer of the thinkorswim platform and the “Account Statement” section of the “Monitor” tab provide crucial financial information.
- Net Liquidation Value: The total value of all assets in your account, minus any liabilities.
- Buying Power: The amount of capital available for new purchases. This is particularly important for margin accounts, where your buying power can be significantly higher than your cash balance.
- Margin Requirements: For margin accounts, thinkorswim clearly displays your current margin utilization and potential margin calls, helping you manage your leverage and prevent unexpected financial obligations.
- Cash and Sweep Balances: Understand how much cash you have available, including any funds held in money market sweeps, which are relevant for calculating available funds for investments. A clear understanding of these financial metrics is vital for prudent capital management and risk control.
Specialized Features for Sophisticated Investors
Thinkorswim offers advanced functionalities tailored for more experienced traders and specific asset classes, enabling complex strategy implementation and detailed financial analysis.
Options Trading and Analysis Tools
Options traders benefit immensely from thinkorswim’s specialized features.
- Option Chain: As mentioned, this is the central hub for options. It allows you to quickly view strike prices, expiration dates, bid/ask prices, implied volatility, and open interest for calls and puts.
- Strategy Rollout: Easily roll positions to different strike prices or expiration dates directly from the option chain or your positions tab, managing existing strategies effectively.
- Analyze Tab – Risk Profile: This tool allows you to visualize the profit and loss (P&L) of single-leg or multi-leg options strategies across different underlying prices and at various points in time. It helps assess maximum profit, maximum loss, break-even points, and the impact of time decay (theta), volatility (vega), and underlying price changes (delta). This feature is indispensable for designing and managing complex options strategies and understanding their financial implications.
- Probability Analysis: Within the “Analyze” tab, you can view the probability of an underlying stock reaching certain price points by a specific expiration date, aiding in strategic options selection.
Futures and Forex Trading Environments
Dedicated interfaces enhance the experience for futures and forex traders.
- Futures Trader: This interface provides a comprehensive view of futures contracts, often featuring a vertical “ladder” display showing bids and offers at various price levels. This deep-of-market view allows for very precise and rapid order placement, crucial for fast-moving futures markets. Real-time data and direct order entry buttons facilitate quick execution.
- Forex Trader: Similar to the Futures Trader, this dedicated module provides real-time quotes for numerous currency pairs. It offers direct buy/sell buttons, typical bid/ask spreads, and allows for the quick execution of forex trades. The ability to monitor multiple pairs simultaneously and view historical data within the platform provides a robust environment for foreign exchange analysis and execution. These specialized environments are designed to cater to the unique liquidity and execution needs of these high-velocity financial markets.

PaperMoney: Practice Trading Without Real Risk
PaperMoney is arguably one of thinkorswim’s most valuable features, especially for new users or those testing new strategies.
- Simulated Trading Environment: PaperMoney mirrors the live trading platform, complete with real-time market data, charts, and all analytical tools. It allows you to place trades, build strategies, and manage a simulated portfolio using virtual money.
- Risk-Free Learning: This environment enables you to learn the platform’s intricacies, test out complex options spreads, practice futures trading, or experiment with various technical indicators without incurring any financial risk.
- Strategy Refinement: Experienced traders can use PaperMoney to backtest new strategies or adapt existing ones to changing market conditions before committing real capital. It’s an indispensable tool for building confidence, refining your financial decision-making process, and mitigating potential losses in the live market.
Mastering thinkorswim is an ongoing process of exploration and practice. By diligently utilizing its advanced features for research, analysis, and execution, investors can significantly enhance their trading capabilities and achieve more informed financial outcomes.
aViewFromTheCave is a participant in the Amazon Services LLC Associates Program, an affiliate advertising program designed to provide a means for sites to earn advertising fees by advertising and linking to Amazon.com. Amazon, the Amazon logo, AmazonSupply, and the AmazonSupply logo are trademarks of Amazon.com, Inc. or its affiliates. As an Amazon Associate we earn affiliate commissions from qualifying purchases.