The Desmos Graphing Calculator has revolutionized the way students, educators, and professionals interact with mathematics. Far from being just another digital tool, Desmos transforms abstract mathematical concepts into dynamic, visual explorations, making complex ideas intuitive and engaging. Its user-friendly interface, powerful features, and accessibility across various platforms have cemented its status as an indispensable resource for anyone looking to visualize data, understand functions, or simply experiment with mathematical principles.
This comprehensive guide will walk you through everything you need to know to harness the full potential of the Desmos Graphing Calculator. From basic plotting to advanced interactive features, we’ll delve into the functionalities that make Desmos an exceptional tool for learning, teaching, and mathematical discovery.
The Power of Visual Mathematics: An Introduction to Desmos
In an era where digital literacy is paramount, tools that bridge the gap between abstract theory and practical application are invaluable. Desmos stands out as a prime example, offering a robust platform that democratizes access to sophisticated graphing capabilities.
What is Desmos and Why Does it Matter?
At its core, Desmos is a free, online graphing calculator that allows users to plot functions, create tables, animate graphs, and much more. It’s accessible via web browser and as a mobile app, ensuring its utility whether you’re in a classroom, working remotely, or on the go. What sets Desmos apart is its intuitive design coupled with profound computational power. It doesn’t just display graphs; it helps users build an understanding of why those graphs look the way they do by allowing instant manipulation of parameters and real-time visualization of changes.
For students, Desmos demystifies calculus, algebra, geometry, and statistics by making equations tangible. For educators, it provides an engaging medium to demonstrate concepts, foster exploration, and create interactive assignments. For professionals, it’s a quick and efficient way to visualize data, test hypotheses, and present findings. Its importance lies in its ability to foster curiosity and deeper mathematical insight through dynamic interaction.
Accessibility and Interface Overview
One of Desmos’s greatest strengths is its accessibility. There’s no software to install or license to purchase for its basic graphing calculator—simply navigate to desmos.com/calculator in your web browser. The mobile apps for iOS and Android offer a similarly seamless experience.
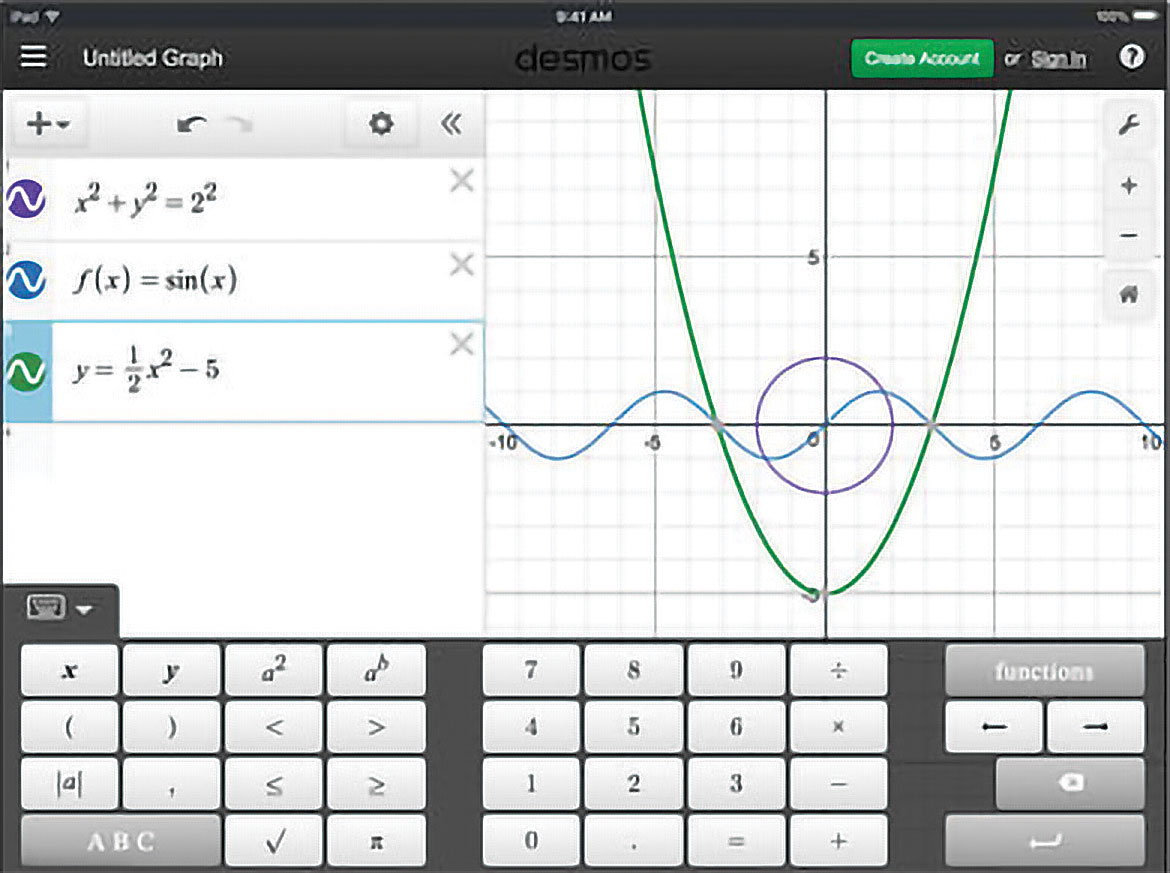
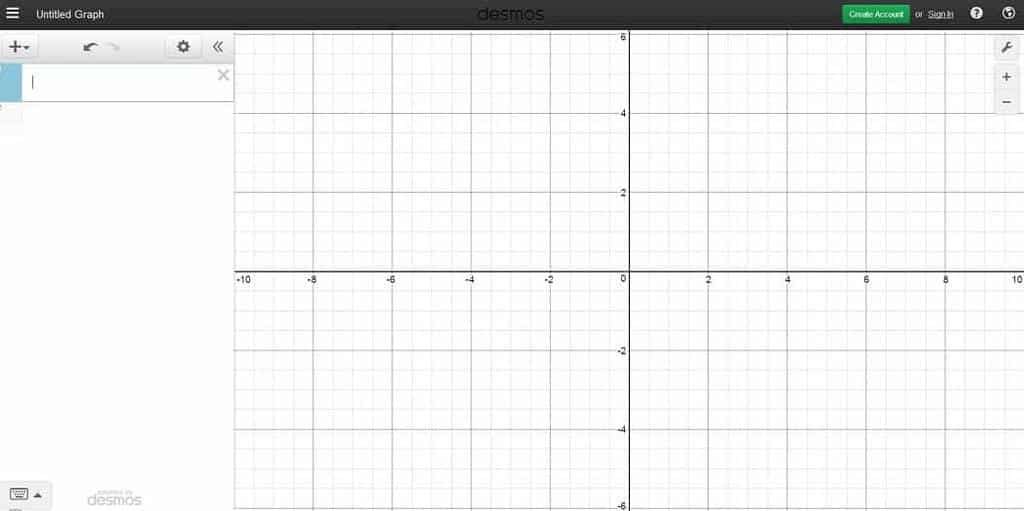
Upon opening Desmos, you’re greeted with a clean, two-pane interface:
- The Graphing Canvas (Right): This is where all your mathematical expressions come to life. It’s a standard Cartesian coordinate plane, which you can pan by dragging and zoom in/out using your mouse wheel or pinch gestures on touchscreens.
- The Expression List (Left): This pane is your command center. Here, you input equations, functions, inequalities, and data points. Each entry occupies its own line, and Desmos instantly renders its graphical representation on the canvas.
Below the expression list, you’ll find a virtual keyboard icon, which brings up Desmos’s comprehensive keypad. This keypad offers access to numbers, operators, functions (like sin, cos, log), and special symbols (like π, θ). Understanding this layout is your first step to mastering Desmos.
Mastering the Basics: Your First Graphs
Getting started with Desmos is remarkably straightforward. Its design encourages experimentation, making it easy to see the immediate graphical result of any input.
Plotting Functions and Equations
To plot your first function, simply type it into an empty line in the expression list.
- Linear Functions: Try
y = 2x + 1. You’ll instantly see a straight line appear. Change the2to0.5or10and observe how the slope changes. Modify the+1to-3and see the y-intercept shift. - Quadratic Functions: Input
y = x^2. A parabola will emerge. Experiment withy = (x-2)^2 + 3to understand vertex form and transformations. Use the caret symbol^for exponents. - Trigonometric Functions: Type
y = sin(x). A sine wave will appear. Explorey = cos(x)ory = tan(x). You can adjust the domain and range of your graph using the wrench icon in the top right of the graphing canvas. - Implicit Equations: Desmos isn’t limited to
y = f(x). You can graphx^2 + y^2 = 9to see a circle, or even(x^2 + y^2 - 1)^3 - x^2 * y^3 = 0for more complex implicit curves.
Desmos automatically assigns a unique color to each graph, making it easy to distinguish multiple plots simultaneously. You can customize these colors and styles by clicking and holding the color icon next to each expression.
Navigating the Graphing Canvas
Efficient navigation of the graphing canvas is key to detailed analysis.
- Panning: Click and drag anywhere on the canvas to move the view.
- Zooming: Use your mouse wheel to zoom in and out. On touch devices, use a pinch-to-zoom gesture. You can also use the
+and-buttons in the bottom right corner of the canvas. - Graph Settings (Wrench Icon): The wrench icon (top right) opens the graph settings. Here, you can:
- Manually set the X-axis and Y-axis ranges.
- Change the step size for the gridlines.
- Toggle axis labels, numbers, and gridlines.
- Switch between radians and degrees for trigonometric functions.
- Projector Mode: Increases the thickness of lines and font size, ideal for presentations.
Leveraging the Desmos Keypad
While you can type most expressions directly using your computer’s keyboard, the Desmos virtual keypad is indispensable for special functions, symbols, and fractional input.
- Functions: The “functions” tab on the keypad provides quick access to common mathematical functions like
sqrt(square root),log,abs(absolute value),sum,product, and more advanced statistical functions. - Operators: Access multiplication
*, division/, exponents^, and roots. - Symbols: Find Greek letters (
alpha,beta,theta),pi, infinity, and inequality symbols. - Fraction Key: The fraction key
a/bsimplifies entering fractions, especially complex ones.
Learning to navigate the keypad will significantly speed up your input process and allow you to explore a wider range of mathematical expressions.
Unlocking Advanced Functionality for Deeper Insight
Desmos truly shines when you move beyond static plots to its dynamic and interactive features, allowing for profound mathematical exploration.
Dynamic Parameters with Sliders
One of Desmos’s most powerful features is the ability to introduce parameters and control them with sliders. When you type an equation like y = mx + b and use letters m or b that aren’t x or y, Desmos will automatically ask if you want to add sliders for these variables.
- Creating Sliders: Click “all” or individual letters to create sliders.
- Manipulating Sliders: Drag the slider to instantly see how changing
m(slope) orb(y-intercept) affects the line. - Animation: Click the play button next to a slider to animate the parameter, creating captivating visual demonstrations of mathematical concepts. This is incredibly useful for understanding concepts like transformations, wave propagation, or parametric motion.
- Slider Settings: Click on the slider value to set its minimum, maximum, and step size.
Exploring Inequalities and Shaded Regions
Desmos handles inequalities with ease, automatically shading the regions that satisfy the condition.
- Basic Inequalities: Type
y < x + 1orx^2 + y^2 <= 9. Desmos will shade the corresponding region. - Compound Inequalities: Combine inequalities using
and(e.g.,y > x and y < -x + 5). This allows you to define complex regions and visualize solutions to systems of inequalities. - Domain/Range Restrictions: You can restrict the domain or range of a function or inequality using curly braces
{}. For example,y = x^2 {0 < x < 3}will only show the parabola between x=0 and x=3. This is excellent for piecewise functions or highlighting specific parts of a graph.
Data Analysis and Regression Modeling
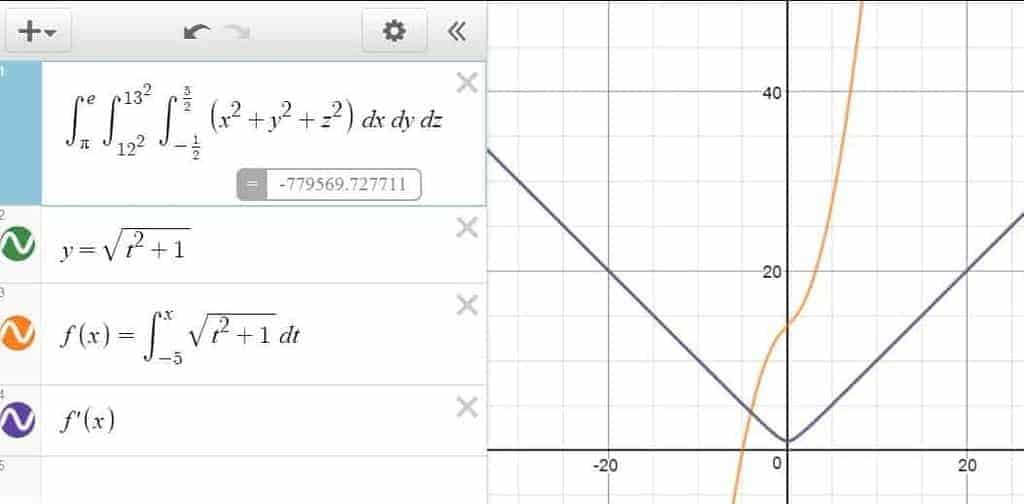
Desmos isn’t just for functions; it’s also a capable tool for data visualization and regression.
- Tables: Click the
+button in the expression list and select “table.” Input your x and y data points. Desmos will plot these points on the graph. - Regression: Once you have a table of data (e.g.,
x1, y1), you can perform regression by using the tilde~operator. For example:- Linear Regression:
y1 ~ mx1 + b - Quadratic Regression:
y1 ~ ax1^2 + bx1 + c - Exponential Regression:
y1 ~ a * b^x1
Desmos will calculate the best-fit parameters (m, b, a, c, etc.) and display them, along with the correlation coefficient (R-squared). This is a powerful feature for statistics and data science.
- Linear Regression:
Advanced Coordinate Systems and Restrictions
Beyond standard Cartesian graphs, Desmos supports other coordinate systems and advanced graphing techniques.
- Polar Equations: To graph a polar equation, use
randtheta(θ). For example,r = sin(3θ)will create a three-petal rose curve. Ensure your graph settings are set to radians or degrees as appropriate. - Parametric Equations: Input parametric equations as a coordinate pair in parentheses, using a parameter (commonly
t). For instance,(sin(t), cos(t))will draw a circle astvaries. You can restrict the range oftusing curly braces, like(sin(t), cos(t)) {0 <= t <= 2pi}. - Lists: Create lists of numbers using square brackets, e.g.,
L = [1, 2, 3, 4]. You can then use these lists in equations or to generate multiple graphs simultaneously, likey = L*x.
Beyond Graphing: Organization, Collaboration, and Customization
Desmos offers features that extend beyond the core graphing engine, enhancing organization, sharing, and personalizing your mathematical work.
Organizing Your Work with Folders and Notes
As your graphs become more complex, organization is crucial.
- Folders: Click the
+button and select “folder.” Drag related expressions into a folder to group them. You can then toggle the visibility of the entire folder with a single click, cleaning up your workspace. This is excellent for managing multiple experiments or different parts of a complex problem. - Notes: Add “notes” to your expression list to provide context, explanations, or titles for different sections of your graph. This is particularly useful for educational purposes or when sharing your work.
Sharing and Embedding Your Creations
Desmos makes it incredibly easy to share your interactive graphs.
- Share Button: The share icon (arrow pointing right) in the top right corner allows you to:
- Get a Permalink: A unique URL that anyone can use to view and interact with your graph.
- Embed Code: Generate HTML code to embed your interactive graph directly into a webpage or blog post.
- Export Image: Save your graph as a PNG image for static presentations or documents.
- Saving Graphs: Create a free Desmos account to save your graphs to the cloud, allowing you to access them from any device. This is highly recommended for any substantial work.
Customizing Appearance and Interactivity
Desmos allows for a degree of customization to make your graphs more informative and visually appealing.
- Point Styles: When plotting points (either individually
(1,2)or from a table), you can click and hold the color icon to change the point style (open circle, filled circle, cross) and size. - Line Styles: Similarly, for functions and inequalities, you can adjust the line style (solid, dashed, dotted) and thickness.
- Labels: Add labels to points or expressions. For example,
(a, b)can be labeled “Center.” For functions, you can display the expression itself as a label. - Table Conversions: You can convert any function into a table of values by clicking the gear icon next to it and selecting “convert to table.” This helps in analyzing specific points.
Practical Tips for Maximizing Your Desmos Experience
To truly master Desmos, integrating a few best practices and knowing where to find help can significantly enhance your workflow.
Essential Keyboard Shortcuts
While the virtual keypad is useful, knowing some keyboard shortcuts can dramatically speed up your input:
^for exponents (e.g.,x^2)_for subscripts (e.g.,x_1)/for fractions (e.g.,1/2)sqrt()for square rootalt + pforπ(pi)alt + tforθ(theta)ctrl/cmd + Zto undoctrl/cmd + Yto redo- Arrow keys to navigate between expressions.
Developing muscle memory for these shortcuts will make you much more efficient.
Tapping into Community Resources
The Desmos community is vibrant and a fantastic resource for learning and inspiration.
- Desmos Learn: The official Desmos website offers a wealth of tutorials, guides, and example graphs.
- Desmos Activities: Check out
teacher.desmos.comfor a vast library of interactive activities created by educators, ranging from introductory algebra to advanced calculus. Even if you’re not a teacher, exploring these activities can provide innovative ways to use the calculator. - YouTube Tutorials: Many educators and enthusiasts share Desmos tips, tricks, and advanced graphing techniques on YouTube.
- Social Media: Follow Desmos on platforms like Twitter for updates, challenges, and user-generated content.
Desmos in Education and Professional Settings
Desmos’s impact extends far beyond individual use.
- In Education: Many standardized tests now integrate Desmos as their official calculator. Its use in classrooms fosters a deeper understanding of mathematical concepts through visual exploration, promoting discovery-based learning. Educators can create custom activities, monitor student progress, and provide real-time feedback.
- In Professional Settings: Researchers, engineers, data analysts, and anyone dealing with data visualization can leverage Desmos for quick insights, prototyping graphical representations, and creating dynamic presentations. Its ability to handle lists, regressions, and parametric equations makes it versatile for various analytical tasks.
Conclusion
The Desmos Graphing Calculator is more than just a tool; it’s a dynamic environment for mathematical exploration and understanding. By offering an intuitive interface, powerful features like sliders and regressions, and seamless accessibility, Desmos empowers users to visualize, interact with, and ultimately comprehend complex mathematical ideas. Whether you’re a student grappling with algebra, an educator designing an interactive lesson, or a professional analyzing data, mastering Desmos will undoubtedly enhance your mathematical journey. Dive in, experiment, and let Desmos transform your perception of mathematics from static equations to vibrant, interactive discoveries.
aViewFromTheCave is a participant in the Amazon Services LLC Associates Program, an affiliate advertising program designed to provide a means for sites to earn advertising fees by advertising and linking to Amazon.com. Amazon, the Amazon logo, AmazonSupply, and the AmazonSupply logo are trademarks of Amazon.com, Inc. or its affiliates. As an Amazon Associate we earn affiliate commissions from qualifying purchases.