
In an increasingly data-driven world, the ability to transform raw numbers into compelling visual stories is no longer a niche skill but a fundamental requirement across various domains. From dissecting the latest technology trends and understanding software performance to crafting impactful brand strategies and making informed financial decisions, data visualization serves as the bridge between complex datasets and actionable insights. At the heart of this transformative capability for Python users lies Matplotlib, a powerful and versatile plotting library that serves as the bedrock for countless data science, machine learning, and analytical projects.
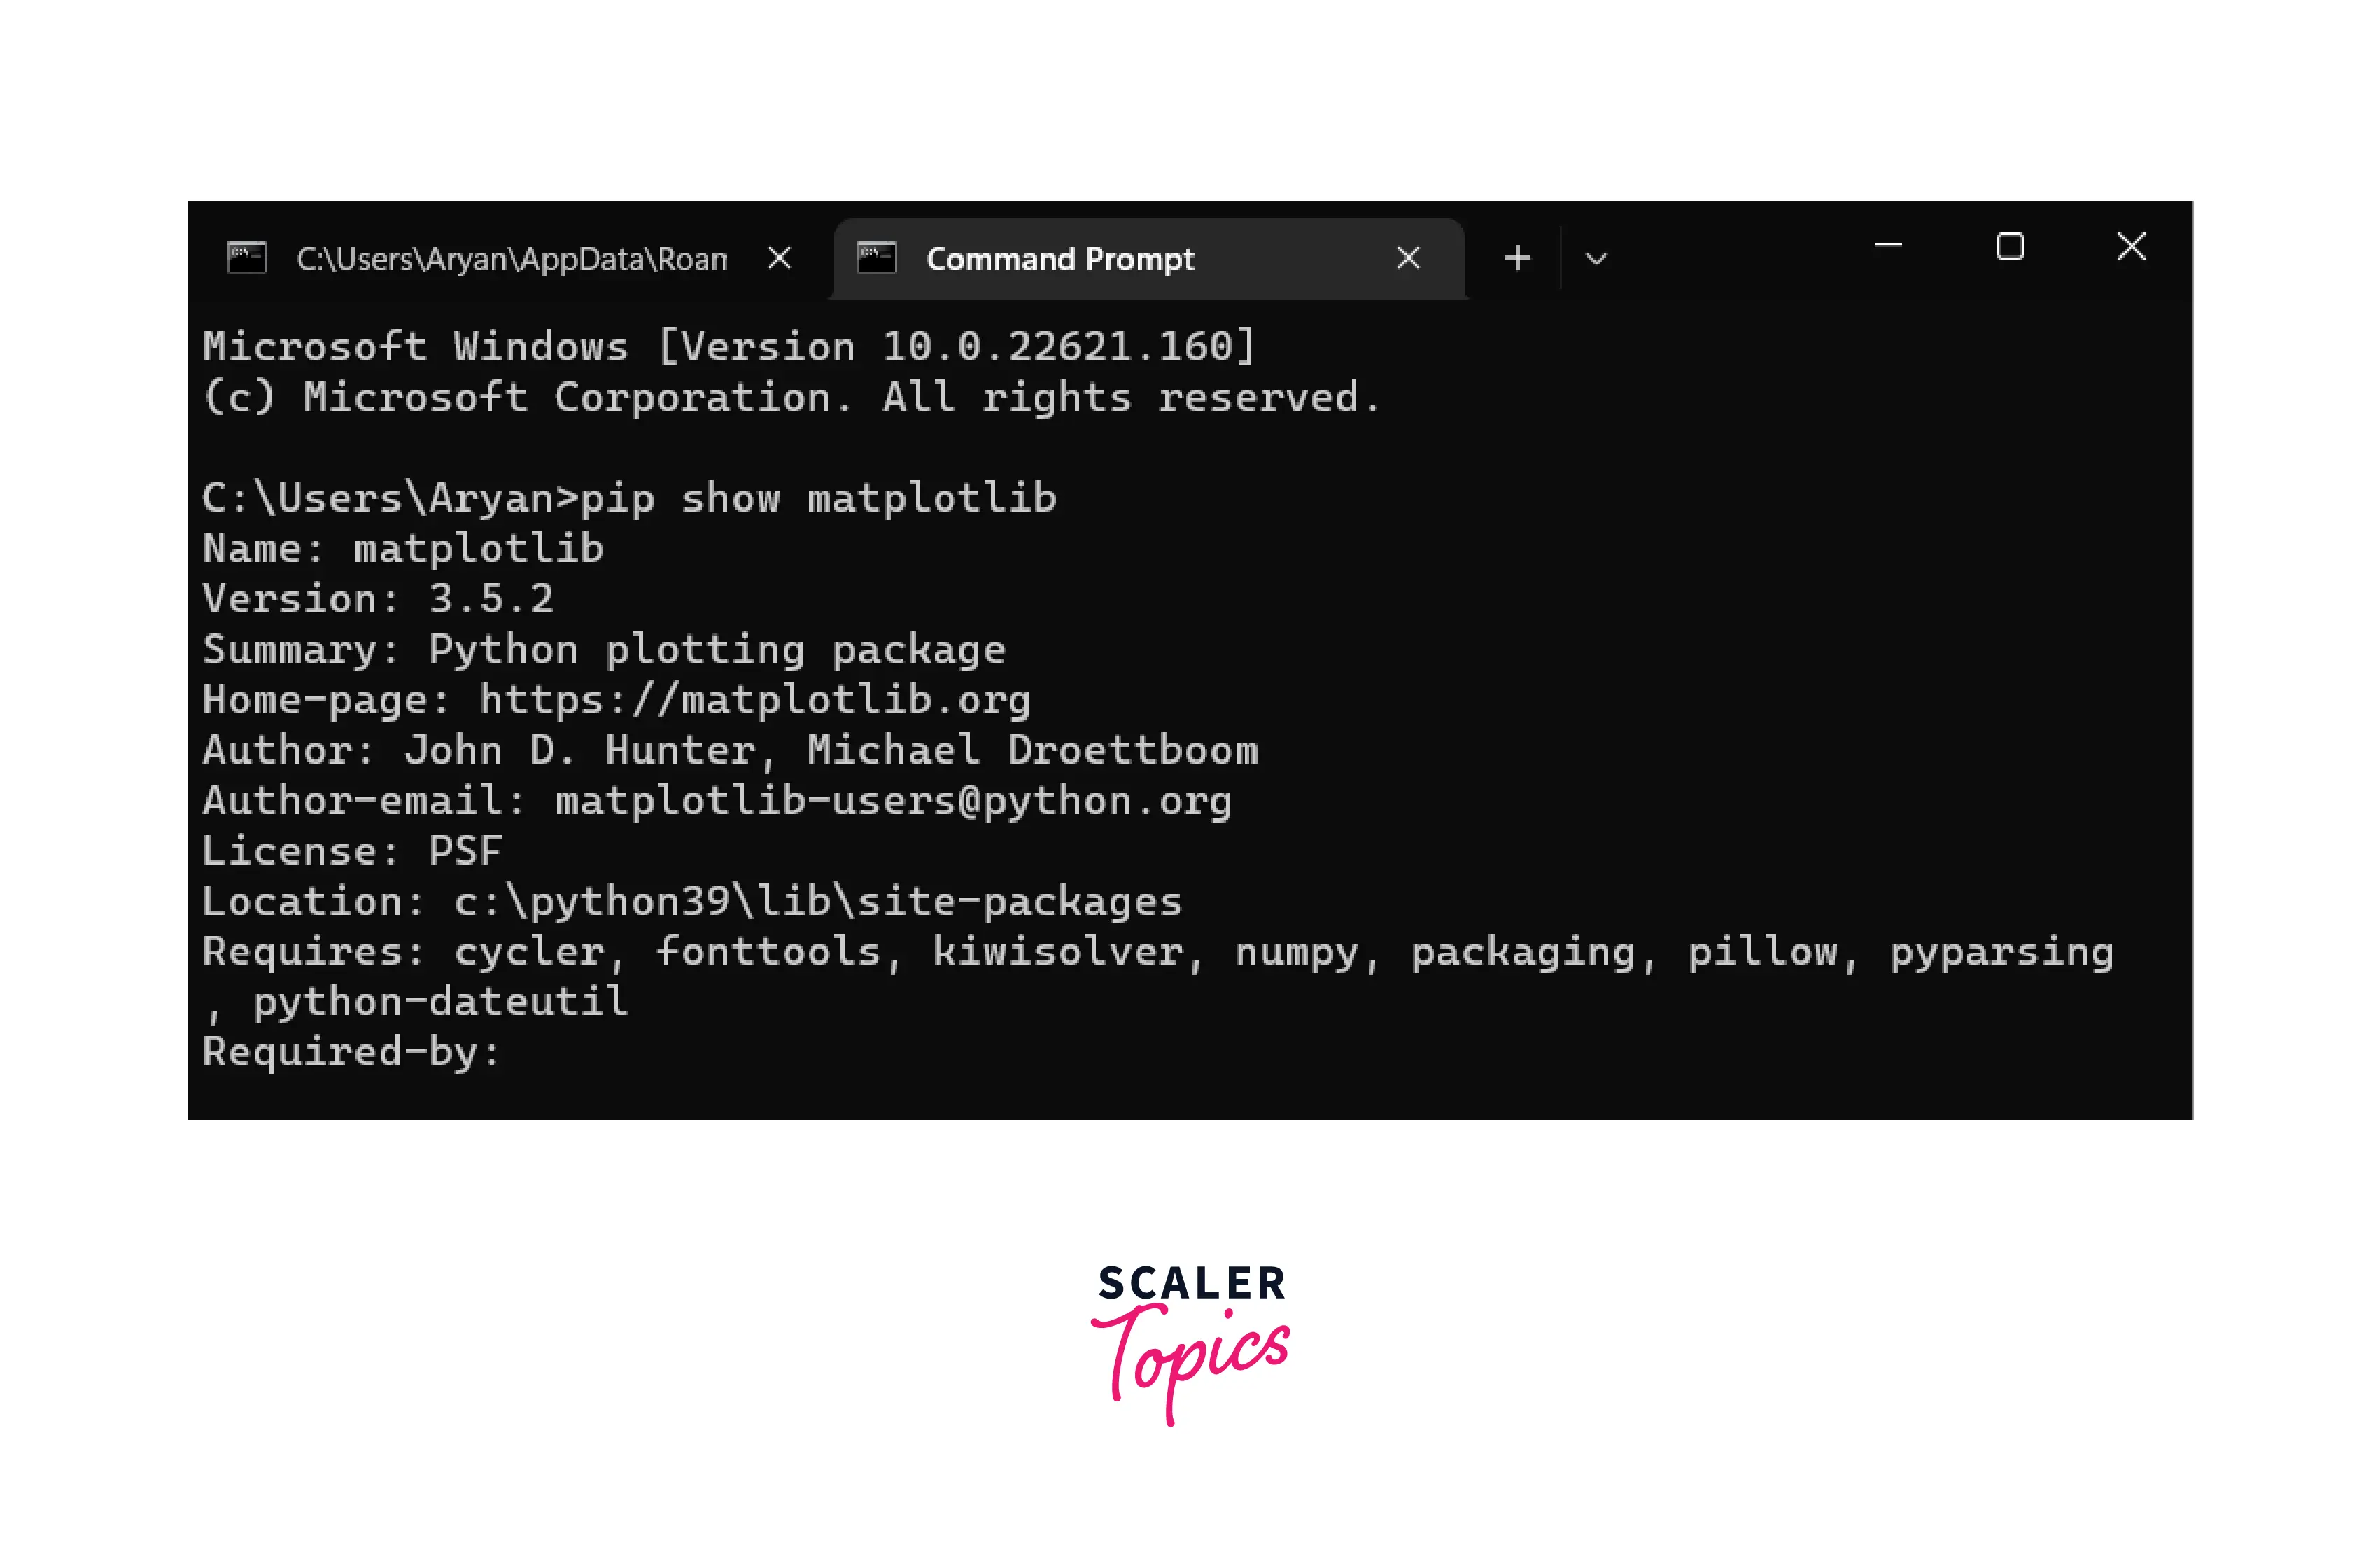
This guide will walk you through the essential steps to install Matplotlib, ensuring you’re well-equipped to embark on your data visualization journey. Whether you’re a budding data scientist eager to explore technological innovations, a marketing professional looking to visualize campaign performance and brand sentiment, or an investor tracking financial market trends, mastering Matplotlib installation is your crucial first step. We’ll cover everything from prerequisites and standard installation methods to best practices, virtual environments, and troubleshooting common issues, all designed to get you plotting with confidence and speed.
1. Setting the Stage: Understanding Matplotlib and Essential Prerequisites
Before diving into the installation process, it’s vital to grasp what Matplotlib is and why it’s an indispensable tool in the modern analytical toolkit. Furthermore, we’ll outline the foundational components you need to have in place to ensure a smooth installation experience.
1.1 What is Matplotlib and Why is it Essential?
Matplotlib is a comprehensive library for creating static, animated, and interactive visualizations in Python. It offers a vast array of plotting functions, allowing users to generate everything from simple line graphs and scatter plots to complex 3D visualizations, histograms, heatmaps, and much more. Its design philosophy emphasizes flexibility and customization, giving users fine-grained control over every aspect of their plots, from colors and fonts to labels and legends.
Its essentiality stems from several key areas, particularly relevant to the website’s themes:
- Technology & Software Development: Matplotlib is integral for visualizing algorithmic performance, debugging machine learning models, representing data structures, and creating reports on system metrics. It’s often paired with other scientific computing libraries like NumPy and Pandas to form a robust data analysis ecosystem. For those building AI tools or analyzing software usage, Matplotlib provides the visual feedback necessary for development and optimization.
- Brand Strategy & Marketing: In the realm of branding and marketing, data is king. Matplotlib empowers professionals to visualize consumer behavior, track website traffic, analyze social media engagement metrics, evaluate campaign ROI, and present market research findings. Creating clear, visually appealing charts can transform raw marketing data into compelling narratives that drive strategic decisions and enhance brand reputation. Imagine illustrating market share growth, customer segment penetration, or the effectiveness of A/B tests with crisp, professional graphs – this directly impacts brand perception and strategic direction.
- Money & Finance: For personal finance enthusiasts, investors, and business analysts, Matplotlib offers powerful capabilities for visualizing financial data. You can plot stock prices, cryptocurrency trends, investment portfolio performance, track expenses and income, or analyze economic indicators. Business finance managers can create dashboards to monitor KPIs, sales figures, profit margins, and cash flow, helping them identify opportunities, manage risks, and make sound financial decisions that impact the bottom line. Visualizing online income streams or side hustle growth can also be incredibly motivating and insightful.
1.2 Python and pip: The Foundational Tools
Matplotlib is a Python library, so the first and most crucial prerequisite is having a working installation of Python on your system. We recommend using Python 3.6 or newer for optimal compatibility and access to the latest features. Along with Python, pip (Package Installer for Python) is equally vital. Pip is the standard package manager for Python, used to install and manage software packages written in Python.
-
Verifying Python Installation: Open your terminal or command prompt and type:
python --versionor
python3 --versionYou should see an output indicating your Python version (e.g.,
Python 3.9.7). If not, you’ll need to download and install Python from the official Python website (python.org). -
Verifying pip Installation: Similarly, check your pip version:
bash

pip --version
or
bash

pip3 --version
This should return something likepip 21.2.4 from .... If pip is missing or outdated, you might need to upgrade it or ensure it was installed correctly with Python. Most modern Python installations include pip by default.
1.3 Virtual Environments: A Best Practice for Project Isolation
Before installing Matplotlib, it’s highly recommended to set up a virtual environment. A virtual environment is a self-contained directory that holds a specific Python installation and any associated libraries for a particular project, isolated from other projects.
Why are virtual environments a best practice?
- Dependency Management: Different projects often require different versions of the same library. Without virtual environments, installing a new version for one project might break another.
- Cleanliness and Organization: They keep your global Python installation clutter-free and ensure that project dependencies are clearly defined.
- Reproducibility: They make it easier to share your projects, as others can easily recreate your exact working environment.
How to create and activate a virtual environment:
-
Create a virtual environment: Navigate to your project directory in the terminal and run:
python3 -m venv my_matplotlib_envReplace
my_matplotlib_envwith a descriptive name for your environment. -
Activate the virtual environment:
- On macOS/Linux:
bash

source my_matplotlib_env/bin/activate
- On Windows (Command Prompt):
bash

my_matplotlib_envScriptsactivate.bat
- On Windows (PowerShell):
bash

.my_matplotlib_envScriptsActivate.ps1
Once activated, your terminal prompt will usually show the environment’s name in parentheses (e.g.,(my_matplotlib_env) user@host:~/my_project$).
- On macOS/Linux:
2. Core Matplotlib Installation Methods
With your Python environment set up and potentially a virtual environment activated, you’re ready to install Matplotlib. There are primarily two common methods: using pip, the standard Python package installer, and using Anaconda, a popular distribution for scientific computing.
2.1 Standard Pip Installation
The most straightforward and widely used method to install Matplotlib is via pip. Ensure your virtual environment is activated before proceeding.
-
Open your terminal or command prompt.
-
Activate your virtual environment (if you created one, as recommended).
-
Run the installation command:
pip install matplotlibThis command will download Matplotlib and its core dependencies (like NumPy, Pillow, Pyparsing, Cycler, Fonttools, and Kiwisolver) from the Python Package Index (PyPI) and install them into your active environment.
Optional: Installing specific backends/dependencies
Matplotlib relies on various “backends” to render plots (e.g., Agg for non-interactive rendering, TkAgg for interactive plots, Qt5Agg, etc.). The defaultpip install matplotlibusually pulls in common necessary dependencies. However, if you plan to use specific interactive features or integrate with particular GUI toolkits, you might need to install additional packages. For example, to ensure robust interactive plotting:pip install matplotlib pyqt5Or for a lightweight interactive option (often built-in but good to know):
pip install matplotlib ipythonFor most users,
pip install matplotlibwill suffice initially. If you encounter issues with interactive plots later, you can research the specific backend required for your environment.
2.2 Installing with Anaconda/Miniconda
For users involved in data science, machine learning, or complex scientific computing, Anaconda (or its lighter version, Miniconda) is a highly recommended Python distribution. Anaconda comes pre-packaged with many essential libraries, including Matplotlib, making installation incredibly simple. It also provides its own package and environment manager called conda.
-
If you haven’t already, download and install Anaconda or Miniconda from their official website.
-
Open the Anaconda Prompt (on Windows) or your terminal (on macOS/Linux).
-
Create a new
condaenvironment (recommended):
While Matplotlib might be in your base Anaconda environment, creating a dedicatedcondaenvironment is good practice, similar tovenv.conda create --name my_data_env python=3.9Replace
my_data_envwith your desired environment name andpython=3.9with your preferred Python version. -
Activate the
condaenvironment:conda activate my_data_env -
Install Matplotlib within the
condaenvironment:
bash

conda install matplotlib
condais often more efficient at resolving complex dependencies and ensuring compatibility thanpipin some scientific computing scenarios.
3. Verifying Your Installation and First Steps
After successfully running the installation command, it’s crucial to verify that Matplotlib is indeed installed and functioning correctly. This section will guide you through a simple verification process and show you how to create your very first plot.
3.1 Testing Your Installation
To confirm Matplotlib is installed and accessible in your Python environment, follow these steps:

-
Ensure your virtual/conda environment is activated.
-
Open a Python interpreter by typing
pythonorpython3in your terminal. -
Attempt to import Matplotlib:
import matplotlib
print(matplotlib.__version__)
If the import succeeds without any
ModuleNotFoundErroror other error messages, and you see a version number printed (e.g.,3.8.2), congratulations! Matplotlib is installed.To further test its plotting capabilities and ensure all dependencies are in place, try importing
pyplot, the module most commonly used for creating plots:import matplotlib.pyplot as pltAgain, if this runs without errors, you’re good to go.
3.2 A Simple Plot Example: Visualizing Data for Insight
Let’s create a basic line plot to demonstrate Matplotlib’s capabilities. This simple example could represent anything from sales trends over time (for a brand’s marketing analysis) to stock price movements (for financial analysis) or the performance of a new algorithm (for tech development).
-
Create a new Python file (e.g.,
first_plot.py) in your project directory. -
Add the following code:
import matplotlib.pyplot as plt
import numpy as np

# Data for the plot - could be anything from tech metrics to financial trends
x = np.linspace(0, 10, 100) # 100 evenly spaced values from 0 to 10
y = np.sin(x) # The sine of x

# Create the plot
plt.figure(figsize=(10, 6)) # Set the figure size for better aesthetics
plt.plot(x, y, label='Sine Wave', color='blue', linestyle='--')

# Add titles and labels for clarity
plt.title('Simple Sine Wave Plot: A Glimpse into Data Visualization', fontsize=16)
plt.xlabel('X-axis (e.g., Time, Feature Value)', fontsize=12)
plt.ylabel('Y-axis (e.g., Metric Value, Price)', fontsize=12)
plt.legend(fontsize=10)
plt.grid(True, linestyle=':', alpha=0.7) # Add a grid for readability

# Enhance readability for potential reports or brand presentations
plt.xticks(fontsize=10)
plt.yticks(fontsize=10)

# Save the plot to a file (useful for reports, presentations, or web content)
plt.savefig('sine_wave_plot.png', dpi=300, bbox_inches='tight')

# Display the plot
plt.show()
(Note: You might need to install NumPy if it wasn’t installed as a Matplotlib dependency or if you’re in a fresh environment:
pip install numpy) -
Run the script from your activated environment in the terminal:
bash

python first_plot.py
A window should pop up displaying your sine wave plot. Additionally, an image file namedsine_wave_plot.pngwill be saved in your project directory. This demonstrates not only successful plotting but also how you can generate high-quality images for reports, presentations, or even for use on your website to showcase brand insights or financial analysis.
4. Advanced Scenarios and Best Practices
As you become more comfortable with Matplotlib, you might encounter situations requiring more nuanced handling or want to ensure your setup adheres to best practices for long-term project sustainability.
4.1 Upgrading and Uninstalling Matplotlib
Keeping your libraries updated is crucial for accessing the latest features, performance improvements, and security patches.
-
Upgrading Matplotlib:
To upgrade Matplotlib to its latest version (within your active environment):pip install --upgrade matplotlibOr with
conda:conda update matplotlib -
Uninstalling Matplotlib:
If you need to remove Matplotlib from an environment for any reason:
bash

pip uninstall matplotlib
Or withconda:
bash

conda uninstall matplotlib
This will also prompt you to remove its dependencies.
4.2 Managing Backends and Dependencies
Matplotlib can use different “backends” to render plots. Some are for interactive GUIs (like TkAgg, Qt5Agg, WXAgg), while others are for non-interactive output (like Agg for PNGs, PS for PostScript). Matplotlib usually tries to guess the best backend for your environment. If you encounter issues with interactive plots (e.g., the plot window not appearing), it might be a backend issue.
You can explicitly set a backend in your script before importing pyplot:
import matplotlib
matplotlib.use('TkAgg') # or 'Qt5Agg', 'Agg', etc.
import matplotlib.pyplot as plt
# ... rest of your plotting code
To install a specific GUI backend library:
- For
TkAgg:pip install tk(often built-in with Python) - For
Qt5Agg:pip install pyqt5 - For
Qt6Agg:pip install pyqt6 - For
WXAgg:pip install wxpython
For most initial uses, the default setup works well, but understanding backends can be helpful for troubleshooting or specialized applications, particularly in advanced tech development scenarios where specific graphical interfaces are required.
5. Troubleshooting Common Installation Issues
Even with careful planning, installation issues can arise. Here are some common problems and their solutions, drawing upon experiences from various tech setups.
5.1 Permission Errors
Error Message Example: Permission denied: '/usr/local/lib/python3.9/site-packages/matplotlib' or similar.
Cause: This typically happens when you try to install packages globally (outside a virtual environment) without sufficient administrator/root privileges.
Solution:
- Use a virtual environment (highly recommended): This completely bypasses the need for global permissions.
- Do not use
sudo pip installunless absolutely necessary: Whilesudo pip install matplotlibmight fix the permission error, it’s generally discouraged as it can lead to package conflicts and security risks in your global Python environment. Always prefer virtual environments.
5.2 Dependency Conflicts or Missing Dependencies
Error Message Example: ModuleNotFoundError: No module named 'numpy' or ImportError: cannot import name 'cbook' from 'matplotlib' (path_to_matplotlib.py)
Cause: Matplotlib relies on several other libraries (NumPy, Pillow, etc.). If these aren’t installed correctly or their versions conflict, Matplotlib won’t work.
Solution:
- Ensure core dependencies are installed:
pip install numpy pillow cycler pyparsing fonttools kiwisolver(these are usually pulled in automatically withpip install matplotlib, but explicitly installing can sometimes resolve issues). - Upgrade pip: An outdated pip might struggle with dependency resolution.
python -m pip install --upgrade pip - Clean reinstall: Sometimes, a fresh start helps. Uninstall Matplotlib and its dependencies, then reinstall:
bash

pip uninstall matplotlib numpy pillow # ... and other listed dependencies if unsure

pip install matplotlib
- Check Matplotlib’s official documentation: For the exact dependencies of your Matplotlib version.
5.3 Python Version Mismatches
Error Message Example: ERROR: Could not find a version that satisfies the requirement matplotlib (from versions: none)
Cause: You might be trying to install a version of Matplotlib that is incompatible with your Python version, or your pip command is linked to a different Python interpreter than you expect.
Solution:
- Verify your Python version:
python --versionorpython3 --version. - Use
python -m pip: This explicitly tells Python to use thepipassociated with that specific Python interpreter, preventing ambiguity.
bash

python -m pip install matplotlib
- Check Matplotlib’s compatibility matrix: Refer to Matplotlib’s official documentation for supported Python versions for specific Matplotlib releases.
5.4 Issues with Interactive Plots (Plot Window Not Appearing)
Cause: This often relates to missing GUI toolkit backends or incorrect backend configuration.
Solution:
- Install a GUI backend: For example,
pip install pyqt5(for Qt5Agg) orpip install pyqt6(for Qt6Agg). - Specify the backend in your script: As mentioned earlier,
matplotlib.use('TkAgg')(orQt5Agg, etc.) beforeimport matplotlib.pyplot as plt. - Ensure
plt.show()is called: Withoutplt.show(), the plot window will not display interactively.
By understanding these common pitfalls and their solutions, you can efficiently troubleshoot most Matplotlib installation challenges, keeping your tech projects on track, your brand insights flowing, and your financial analyses clear.

Conclusion
Installing Matplotlib is a fundamental step for anyone venturing into data visualization with Python, offering a robust foundation for a myriad of applications across technology, branding, and finance. By following this comprehensive guide, you’ve learned to set up your environment, install Matplotlib using both pip and conda, verify its functionality with a simple plot, and navigate potential issues.
With Matplotlib successfully installed, a world of visual data exploration awaits. You’re now equipped to analyze complex datasets for software optimization, craft compelling visual stories for your brand’s marketing campaigns, or track intricate financial market movements. The journey from raw data to insightful visualizations begins here. Keep exploring, keep coding, and let Matplotlib empower your data-driven decisions. The ability to articulate data visually is an invaluable asset in today’s digital landscape, transforming the way we understand and interact with the world around us.
aViewFromTheCave is a participant in the Amazon Services LLC Associates Program, an affiliate advertising program designed to provide a means for sites to earn advertising fees by advertising and linking to Amazon.com. Amazon, the Amazon logo, AmazonSupply, and the AmazonSupply logo are trademarks of Amazon.com, Inc. or its affiliates. As an Amazon Associate we earn affiliate commissions from qualifying purchases.