
In an increasingly digitized world, the ability to visualize complex data and mathematical concepts has become an invaluable skill across various disciplines. For decades, this visualization often required expensive software, specialized hardware, or intricate manual plotting. Then came Desmos, a revolutionary online graphing calculator that democratized mathematical visualization. Free, intuitive, and remarkably powerful, Desmos has transformed how students, educators, and professionals interact with mathematics, making complex concepts accessible and engaging.
At its core, Desmos is more than just a tool for drawing lines; it’s an interactive environment for exploring functions, equations, inequalities, and data in real-time. Whether you’re a high school student grappling with calculus, a college student exploring multivariable functions, an engineer visualizing system behaviors, or an educator designing dynamic lessons, Desmos offers a robust platform to bring numbers to life. This comprehensive guide will walk you through the essentials and advanced functionalities of Desmos, empowering you to unlock its full potential and graph with unparalleled precision and insight.
Getting Started with Desmos: The Basics
Navigating the initial steps of any new software can be daunting, but Desmos is designed with user-friendliness at its core. Its minimalist interface belies a deep well of functionality, ensuring that even first-time users can quickly begin plotting and exploring.
Accessing Desmos and Understanding the Interface
To begin your graphing journey, simply open your web browser and navigate to desmos.com/calculator. You’ll be greeted by a clean, intuitive interface. On the left side is the “expression list,” where you’ll input your equations, inequalities, and data points. The large central area is your “graphing grid,” a dynamic canvas where your mathematical expressions come to life. Below the expression list, you’ll find a virtual keypad that replicates a scientific calculator, offering easy access to numbers, operators, and common functions.
While you can use Desmos without an account, creating one (via Google, Apple, or email) is highly recommended. An account allows you to save your graphs, organize them into folders, and access them from any device, ensuring your intricate explorations are never lost. Familiarizing yourself with these core components is the first step towards harnessing Desmos’s power. You can easily zoom in and out using your mouse wheel or pinch-to-zoom on touch devices, and pan across the grid by clicking and dragging, offering complete control over your viewing window.
Inputting Your First Equations
The real magic begins when you input your first equation. Desmos accepts a wide range of mathematical syntax, from simple linear equations to complex transcendental functions.
-
Linear Equations: Start with something simple like
y = 2x + 3. As soon as you type it, a straight line will appear on your grid. -
Quadratic Equations: Try
y = x^2. Desmos will instantly draw a parabola. Use the caret symbol^for exponents. -
Trigonometric Functions: Input
y = sin(x)ory = cos(x). You’ll see the familiar periodic waves. -
Implicit Equations: Desmos can even handle implicit equations like
x^2 + y^2 = 25to draw a circle centered at the origin.
The platform intelligently interprets your input, often automatically adding parentheses or correcting syntax errors to guide you. You can add multiple equations to the expression list, each represented by a distinct color on the graph, making it easy to compare and contrast different functions simultaneously. This immediate feedback loop is crucial for visual learners, allowing them to instantly see the impact of changing parameters or altering an equation’s structure.
Customizing Graphs: Colors, Styles, and Labels
Beyond simply drawing graphs, Desmos offers extensive customization options to enhance clarity and visual appeal. Each expression in your list has a small gear icon next to it. Clicking this reveals a settings menu where you can:
-
Change Colors: Select from a palette of colors to differentiate between multiple graphs.
-
Adjust Line Styles: Toggle between solid, dashed, or dotted lines.
-
Modify Line Thickness: Make a line bolder or finer.
-
Add Labels: Label specific points or the entire graph with text, which is particularly useful for presenting your work or distinguishing critical features.
Furthermore, by clicking the wrench icon in the top right corner, you can access the “Graph Settings” menu. Here, you can customize the x and y axes, including their ranges, labels, and step sizes. You can also toggle the grid, show or hide specific points, or even change the projection to polar coordinates. These customization tools allow you to tailor your graphs precisely to your analytical needs, transforming raw mathematical data into compelling visual narratives.
Advanced Graphing Techniques for Deeper Understanding
While the basics allow for fundamental plotting, Desmos truly shines in its advanced features, enabling dynamic exploration and profound insights into mathematical relationships. These tools move beyond static representations, inviting users to interact directly with variables and observe real-time transformations.
Utilizing Sliders for Dynamic Exploration
One of Desmos’s most powerful features is its ability to create interactive sliders. When you introduce a variable (e.g., a, b, c, m) into an equation, Desmos automatically prompts you to add a slider for that variable. For instance, if you type y = mx + b, Desmos will ask if you want to create sliders for m and b.
Once created, these sliders appear below your expression. You can drag them left or right to change the variable’s value and instantly observe how the graph transforms. Even more impressively, you can click the “play” button next to a slider to animate it, watching the graph evolve dynamically. This feature is invaluable for understanding:
-
Transformations of Functions: See how changing the coefficients
a,h, andkaffects the parabolay = a(x-h)^2 + k. -
Parameter Effects: Explore how the period or amplitude changes in trigonometric functions like
y = A sin(Bx). -
Families of Curves: Visualize how a single equation can represent an infinite number of related graphs.
Sliders make abstract mathematical concepts tangible, fostering a deeper, more intuitive understanding through experimentation.
Plotting Points, Tables, and Data Sets
Desmos isn’t limited to continuous functions; it’s also an excellent tool for visualizing discrete data.
-
Individual Points: To plot a single point, simply type its coordinates, e.g.,
(2, 5). -
Tables: For multiple points, you can create a table by clicking the
+button in the expression list and selecting “Table.” You can then manually input x and y values, and Desmos will plot them as discrete points. This is incredibly useful for plotting data collected from experiments or for visualizing sequences. -
Data Sets and Regression: Desmos excels at helping you find relationships within data. If you have a set of data points in a table, you can use Desmos’s regression capabilities to fit a line or curve to that data. For example, to find a linear regression line, you might type
y1 ~ mx1 + b, wherex1andy1refer to the columns in your table. Desmos will calculate the best-fitmandbvalues, and display the regression line, along with the correlation coefficient (R-squared value). This feature is indispensable for statistics, data analysis, and modeling real-world phenomena.
Inequalities and Restricted Domains
Desmos handles inequalities with ease, transforming static lines into shaded regions, and allows for precise domain restrictions to craft intricate visualizations.
-
Graphing Inequalities: Instead of an equals sign, use
<, >, <=, >=. For example,y > 2x + 1will shade the region above the line, whilex^2 + y^2 < 25will shade the interior of a circle. You can even combine inequalities to define complex regions, likey < xandy > -xto shade a triangular area. -
Restricted Domains: To graph a function over a specific interval, use curly braces
{}immediately after the equation. For example,y = x^2 {0 < x < 5}will only graph the parabola between x=0 and x=5. This is particularly useful for creating piecewise functions, defining segments of curves, or highlighting specific intervals of interest on a graph. You can even restrict domains for parameters in parametric equations or for the independent variable in polar equations, adding another layer of control to your visualizations.
Exploring Desmos’s Rich Feature Set
Beyond its core graphing capabilities, Desmos packs an array of specialized functions and operators that cater to a wide spectrum of mathematical needs, from basic arithmetic to advanced calculus and beyond.
Parentheses, Functions, and Operators
Desmos rigorously follows the order of operations, making parentheses crucial for defining complex expressions. It supports all standard mathematical operators (+, -, *, /) and many advanced ones. Furthermore, Desmos has a vast library of built-in functions:
-
Trigonometric:
sin(),cos(),tan(),arcsin(),arccos(),arctan() -
Logarithmic & Exponential:
log(),ln(),exp()(e^x) -
Absolute Value & Roots:
abs(),sqrt(),nthroot() -
Statistics:
mean(),median(),stdev(),sum(),product() -
Calculus:
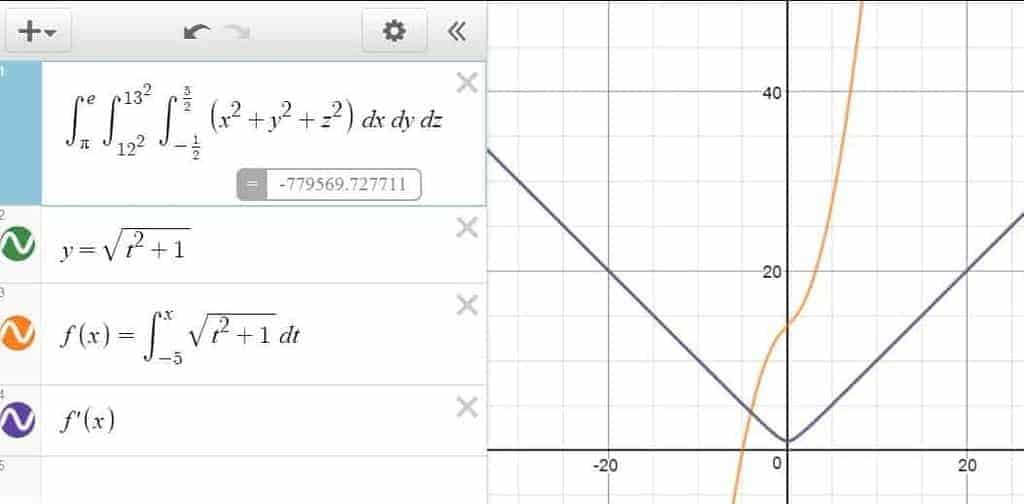
d/dx(derivatives),int(integrals),sum(summation),prod(product) operators -
Other:
round(),floor(),ceil(),mod()
You can also define your own functions. For example, typing f(x) = x^2 + 2x - 3 allows you to then evaluate f(5) or graph y = f(x-2), streamlining complex calculations and enhancing readability. This functional programming approach facilitates modularity and reusability, particularly beneficial when exploring variations of a core function.
Parametric and Polar Equations
Desmos extends its graphing prowess to more specialized coordinate systems, opening up new avenues for geometric and physical visualizations.
-
Parametric Equations: These equations define x and y coordinates in terms of a third parameter, often
t. For example, to draw a circle, you can type(cos(t), sin(t))and Desmos will automatically create a slider fort‘s range. Parametric equations are excellent for graphing curves that are not functions (like circles or spirals) or for visualizing paths over time. You can adjust thetrange to trace out partial curves or observe the motion of a point along a path. -
Polar Equations: These define points by their distance from the origin (
r) and an angle (θ). To switch to polar graphing, go to the graph settings (wrench icon) and select the polar grid. Then, you can input equations liker = sin(3θ)to create beautiful rose curves orr = θfor an Archimedean spiral. Polar equations are particularly useful in fields like physics and engineering, where phenomena often exhibit radial symmetry or angular dependencies.
Lists, Regression, and Statistics
Desmos’s ability to handle lists of numbers elevates its utility beyond simple function plotting, making it a robust tool for data analysis and statistical modeling.
-
Creating Lists: You can define a list of numbers using square brackets, e.g.,
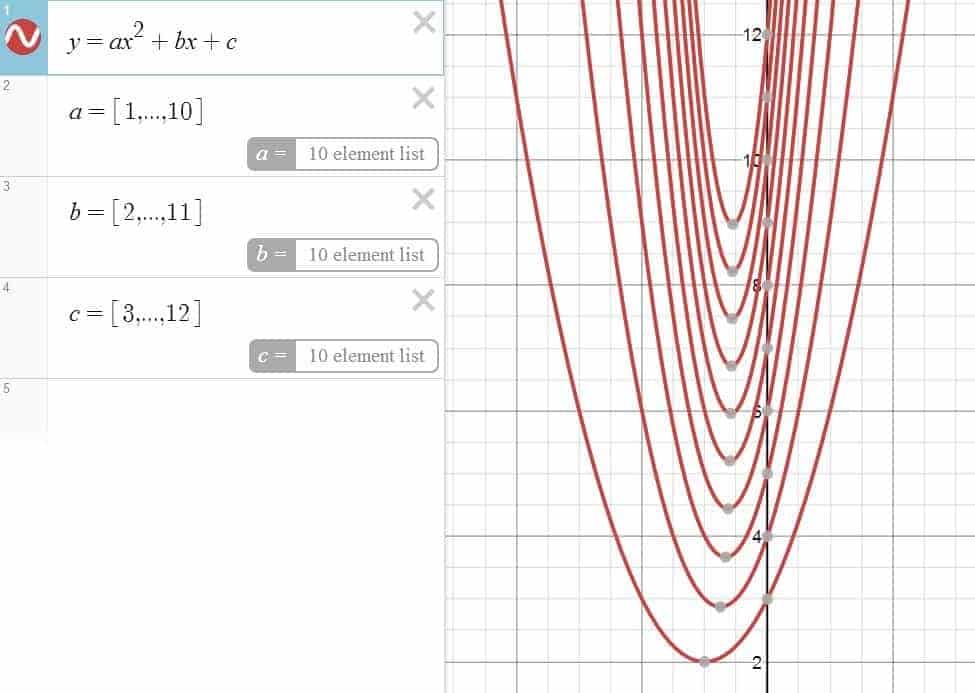
L = [1, 2, 3, 4, 5]. Lists can then be used in expressions, such asy = L*x, which would graph multiple lines simultaneously. You can also generate lists using sequences, like[1...10]for integers from 1 to 10. -
Regression Analysis: As mentioned previously, Desmos makes statistical regression straightforward. By inputting data into a table (e.g.,
x1,y1columns) and then typing a regression model (e.g.,y1 ~ ax1^2 + bx1 + c), Desmos will compute the coefficients (a, b, c) that best fit your data to a quadratic model. This functionality extends to linear, exponential, and other polynomial regressions, providing critical tools for predictive modeling and understanding data trends. -
Statistical Functions: Desmos offers built-in functions to perform statistical calculations on lists. For a list
L, you can easily findmean(L),median(L),stdev(L),min(L),max(L), andsum(L). This integration of descriptive statistics directly into the graphing environment means you can analyze your data and visualize its distribution all in one place.
Beyond Graphing: Leveraging Desmos for Learning and Teaching
Desmos isn’t just a calculator; it’s a dynamic platform designed to enhance mathematical education and collaborative exploration, fostering deeper engagement and understanding. Its interactive nature makes it an ideal tool for both individual learning and classroom instruction.
Interactive Dashboards and Simulations
The dynamic nature of Desmos, particularly with its sliders and animated graphs, lends itself perfectly to creating interactive dashboards and simulations. Educators can craft lessons where students actively manipulate variables and instantly observe the impact on graphs, fostering an intuitive grasp of complex concepts. For example, a teacher could create a graph of a pendulum’s motion, allowing students to adjust parameters like length or gravity and see how the period changes in real-time. This hands-on, exploratory approach encourages inquiry-based learning, moving away from rote memorization towards genuine conceptual understanding. Students can experiment with “what if” scenarios, building stronger mental models of mathematical relationships.
Saving, Sharing, and Collaborating
One of the practical advantages of Desmos is its seamless ability to save and share your work. If you have a Desmos account, every graph you create can be saved to your personal library, accessible from any device. More importantly, every saved graph generates a unique, shareable URL. This means you can:
-
Share Solutions: Students can share their work with classmates or teachers for feedback.
-
Collaborate on Projects: Multiple users can access and discuss the same dynamic graph.
-
Embed in Presentations/Websites: The generated URL can be easily embedded into digital presentations, online portfolios, or educational websites, making your mathematical visualizations an integral part of broader content.
This sharing functionality transforms Desmos from a solitary tool into a collaborative workspace, enabling distributed learning and peer interaction.
Desmos Activities and Classroom Tools
Beyond the standalone calculator, Desmos has developed a powerful suite of classroom activities and teaching tools, primarily accessible through teacher.desmos.com. These resources allow educators to:
-
Access Pre-built Activities: Explore a vast library of interactive lessons covering various topics, from algebra to calculus, designed by Desmos and fellow educators.
-
Create Custom Activities: Design their own guided explorations, self-checking problems, and formative assessments using the Desmos Activity Builder.
-
Monitor Student Progress: Through a teacher dashboard, educators can view student responses in real-time, identify common misconceptions, and provide targeted feedback, facilitating a responsive teaching environment.
-
Pacing and Collaboration: Teachers can pace activities, pause student screens, and anonymize student responses for whole-class discussions, creating a dynamic and engaging classroom experience.
These dedicated classroom tools exemplify Desmos’s commitment to not just facilitating graphing, but revolutionizing mathematics education itself, making complex ideas more approachable and student-centered.
Desmos has firmly established itself as an indispensable technological tool for anyone engaging with mathematics. From its accessible interface for plotting basic equations to its sophisticated features for dynamic exploration, data analysis, and educational interactivity, it empowers users to visualize, understand, and communicate mathematical concepts with unprecedented clarity and ease. By demystifying the complex and making the abstract concrete, Desmos is not just a graphing calculator; it’s a gateway to deeper mathematical insight and a cornerstone of modern STEM education. As you continue your mathematical journey, embrace Desmos as your companion, experiment with its vast capabilities, and unlock new dimensions of understanding.
aViewFromTheCave is a participant in the Amazon Services LLC Associates Program, an affiliate advertising program designed to provide a means for sites to earn advertising fees by advertising and linking to Amazon.com. Amazon, the Amazon logo, AmazonSupply, and the AmazonSupply logo are trademarks of Amazon.com, Inc. or its affiliates. As an Amazon Associate we earn affiliate commissions from qualifying purchases.