In the rapidly evolving landscape of technology, some tools remain foundational, bridging the gap between abstract mathematical concepts and tangible understanding. The graphing calculator is one such indispensable gadget. Far more than a simple number cruncher, it’s a dynamic visualizer, a powerful problem-solver, and an essential companion for students and professionals across various STEM fields. For many, the initial encounter can be daunting, a complex array of buttons and menus. However, with a systematic approach and a solid understanding of its capabilities, mastering your graphing calculator transforms from a chore into an empowering experience. This comprehensive guide will demystify the graphing calculator, leading you from basic functionality to advanced techniques, ensuring you harness its full potential.
The Graphing Calculator: More Than Just Numbers
At its core, a graphing calculator is a handheld computer designed to plot graphs, solve complex equations, and perform a myriad of mathematical and scientific functions. Unlike its simpler scientific counterpart, a graphing calculator boasts a larger screen capable of displaying multiple lines of text and, crucially, graphical representations of functions. It’s a visual learning aid that brings abstract algebraic and calculus concepts to life, allowing users to see the behavior of equations, analyze data trends, and understand relationships between variables in an intuitive way.
What is a Graphing Calculator?
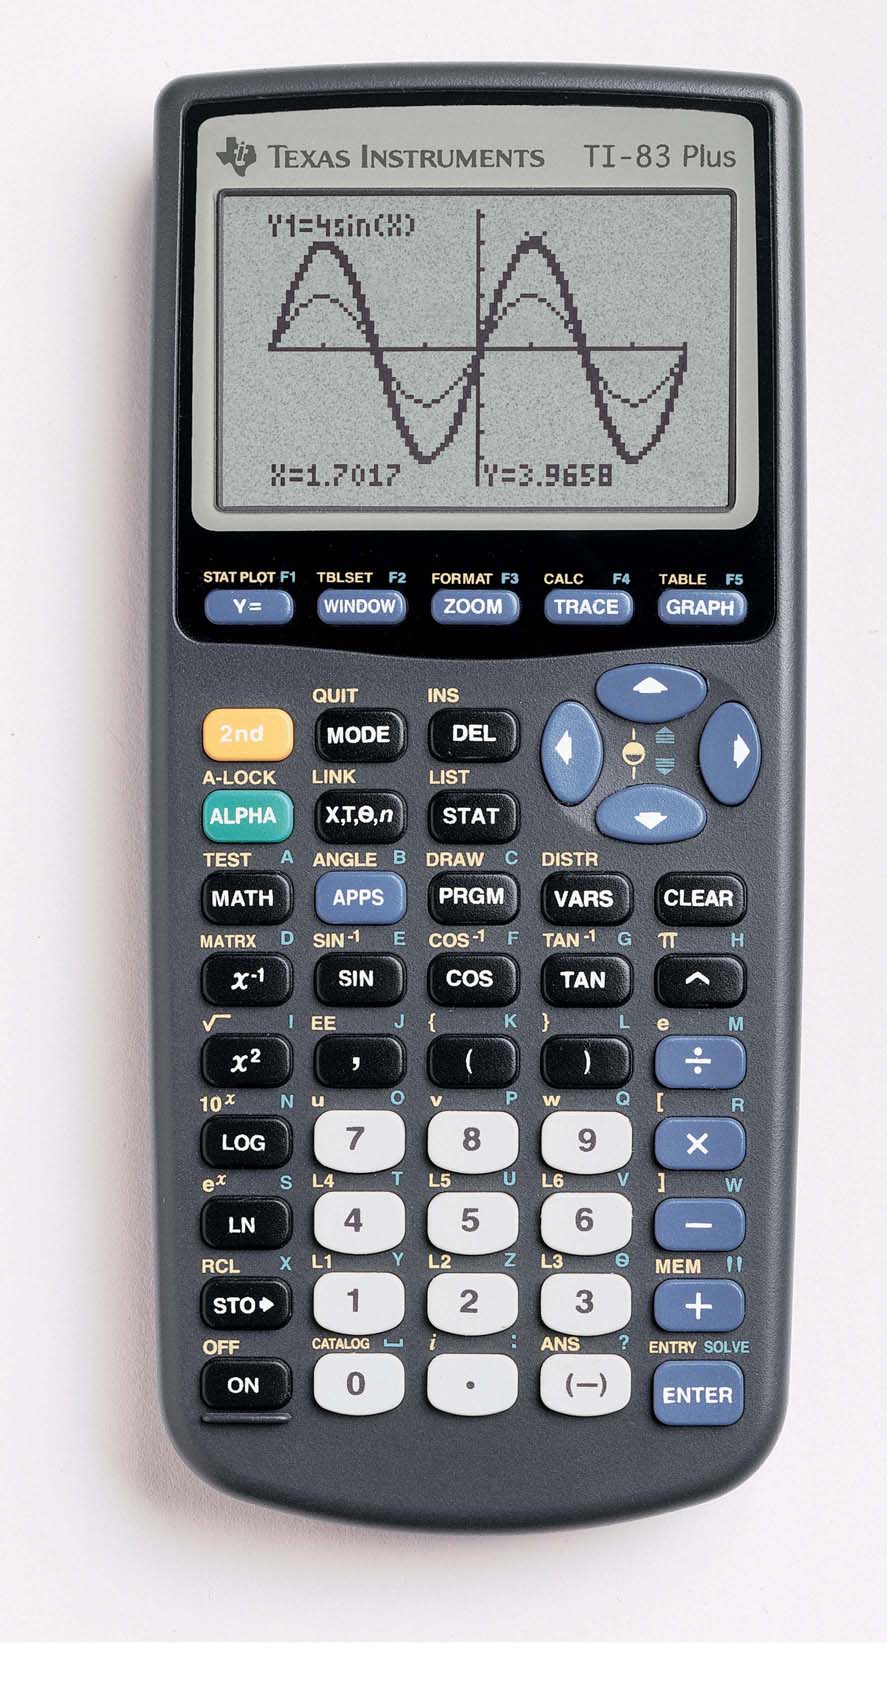
A graphing calculator integrates advanced computational power with a graphical display. Typically, these devices feature a QWERTY or scientific-style keypad, a monochrome or color LCD screen, and a robust operating system. While some models are dedicated purely to math, others include features like computer algebra systems (CAS) for symbolic manipulation, geometry applications, statistical analysis suites, and even basic programming capabilities. Popular models from Texas Instruments (TI-84 Plus, TI-Nspire CX II) and Casio (fx-CG50) dominate the market, each offering a unique blend of features and user experiences. The ability to plot functions (e.g., $y = x^2$), visualize data sets, find intercepts, calculate derivatives, and perform integrals makes it an indispensable tool for algebra, trigonometry, pre-calculus, calculus, statistics, and even physics and engineering.
Why Every Student (and Professional) Needs One
For students, the graphing calculator is an unparalleled learning instrument. It enables exploration of mathematical concepts, facilitating a deeper understanding beyond rote memorization. Seeing a parabola shift as a coefficient changes, or observing the intersection points of two functions, provides immediate feedback and builds intuition. In timed exam settings, its efficiency in solving complex problems—from finding roots to performing regressions—is invaluable. Beyond academia, professionals in fields like engineering, finance, and data science often use these calculators for quick computations, data analysis on the go, or as a reliable backup when more powerful software is unavailable. It streamlines tasks, minimizes calculation errors, and allows for rapid prototyping and analysis of mathematical models, making it a critical asset in both educational and professional toolkits.
Getting Started: Your First Steps with a Graphing Calculator
Embarking on your graphing calculator journey begins with familiarizing yourself with its physical layout and fundamental operations. While models vary, the core principles of navigation and input remain largely consistent. Understanding these initial steps is crucial for building confidence and efficiency in subsequent, more complex tasks.
Basic Setup and Navigation
Upon powering on your calculator (usually a dedicated ON button), you’ll typically be greeted by a home screen or a blank editor. The keypad is your primary interface, divided into functional zones: numeric keys, arithmetic operators, variable keys (like ‘X,T,theta,n’ for plotting), function keys (e.g., SIN, COS, TAN), and navigation arrows. The ‘MODE’ button is often the gateway to customizing settings like angle units (degrees vs. radians), display format, and graph types. Spend some time pressing each key to understand its immediate function or observe pop-up menus. The ‘2nd’ or ‘ALPHA’ key (often color-coded) acts as a shift modifier, accessing the secondary or alphabetic functions printed above the primary keys. Navigating menus usually involves arrow keys and the ‘ENTER’ key to select options, while ‘CLEAR’ or ‘QUIT’ (often ‘2nd’ + ‘MODE’) will return you to the previous screen or the home screen.
Inputting Equations and Functions
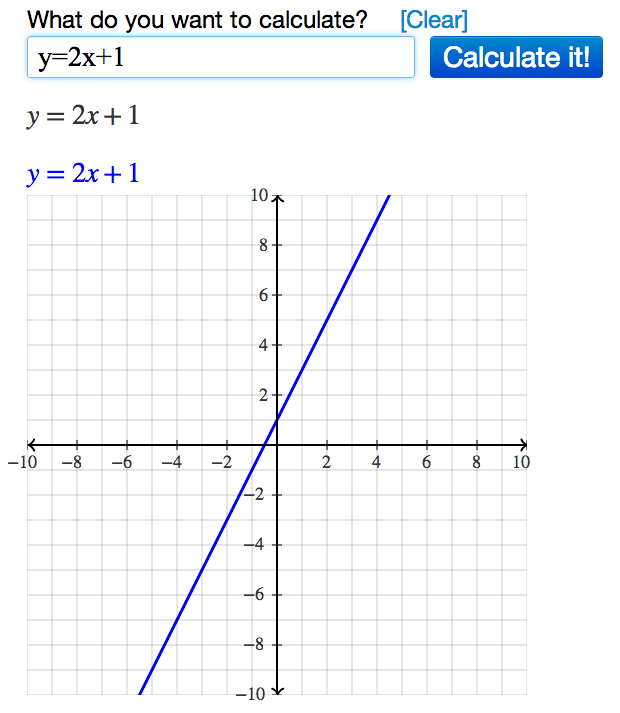
The heart of graphing is inputting functions. On most calculators, this is done via the ‘Y=’ editor (or ‘f(x)=’). Pressing this button brings up a list of equations, usually Y1, Y2, Y3, etc. To enter an equation, select a line (e.g., Y1) and type in your function using the keypad. For instance, to graph $y = 2x^2 + 3x – 5$, you would type 2X^2 + 3X - 5. Pay close attention to syntax:
- Multiplication: Explicit multiplication (e.g.,
2*Xor2X) is often required, although some calculators infer it. - Exponents: Use the ‘^’ key.
- Negative Numbers: Use the dedicated negative sign (-) rather than the subtraction operator. This is a common beginner mistake that leads to “SYNTAX ERROR” messages.
- Variables: Use the specific variable key (often labeled ‘X,T,theta,n’) for the independent variable.
Once entered, ensure the equation is “turned on” (usually indicated by a highlighted equals sign or a checkmark next to the Y= entry) so it will be plotted.
Understanding the Graphing Window
After entering an equation, pressing the ‘GRAPH’ button will display the function. However, if you don’t see anything, or only a small part of the graph, it’s likely an issue with the “window settings.” The ‘WINDOW’ button allows you to define the range of the x-axis (Xmin, Xmax) and y-axis (Ymin, Ymax) that your graph will display, along with the scale (Xscl, Yscl) for tick marks.
- Xmin/Xmax: The lowest and highest x-values visible.
- Ymin/Ymax: The lowest and highest y-values visible.
- Xscl/Yscl: The increment between tick marks on the axes.
- Zoom: The ‘ZOOM’ menu is incredibly useful. ‘ZoomStandard’ (often option 6) sets the window to a default -10 to 10 range for both axes, which is a good starting point. ‘ZoomFit’ (often option 0) attempts to adjust the Y range to show key features of the graph within the current X range. Other options like ‘ZoomIn’ and ‘ZoomOut’ allow you to adjust the view dynamically around a cursor. Mastering the window settings is key to effectively visualizing your functions.
Core Graphing Functions and Features
Once you’re comfortable with basic input and window adjustments, the true power of the graphing calculator begins to unfold. Its ability to not only display graphs but also analyze them provides profound insights into mathematical relationships.
Plotting Single and Multiple Functions
The ‘Y=’ editor isn’t limited to a single function. You can enter multiple equations (Y1, Y2, Y3, etc.) and plot them simultaneously. This feature is invaluable for comparing functions, understanding transformations, or finding points of intersection. For instance, you could plot $y = x^2$ in Y1 and $y = x^2 + 3$ in Y2 to visually understand a vertical shift, or plot $y = 2x – 1$ and $y = -0.5x + 4$ to find where they cross. Each active equation will typically be graphed in a different color or line style, depending on your calculator model, making it easy to distinguish them. Ensure all functions you wish to graph are “turned on” in the Y= editor.
Analyzing Graphs: Intercepts, Intersections, Maxima/Minima
The ‘CALC’ menu (often ‘2nd’ + ‘TRACE’) is where much of the analytical magic happens. This menu provides tools to calculate specific features of your graphed functions:
- Value: Input an x-value to find the corresponding y-value on the graph.
- Zero (Roots/x-intercepts): Finds where the graph crosses the x-axis ($y=0$). The calculator will prompt you for a “Left Bound” and “Right Bound” (points to the left and right of the root) and an initial “Guess” to pinpoint the zero.
- Minimum/Maximum: Finds the lowest or highest point of a curve within a specified interval, again using “Left Bound,” “Right Bound,” and “Guess.” Essential for optimization problems.
- Intersection: Determines the point(s) where two or more graphs cross. After selecting “Intersection,” you’ll choose the “First curve,” “Second curve,” and provide a “Guess” near the intersection point. This is particularly useful for solving systems of equations graphically.
The ‘TRACE’ button also allows you to move a cursor along a graph, displaying the x and y coordinates at each point, offering a dynamic way to explore the function’s behavior.
Statistical Plotting and Data Visualization
Graphing calculators are not just for functions; they are also powerful statistical tools. The ‘STAT’ menu is your gateway to data entry and statistical plotting.
- Edit Lists: Use ‘STAT’ -> ‘Edit’ to enter data into lists (L1, L2, etc.). For example, L1 could hold years and L2 could hold corresponding population data.
- Stat Plots: Go to ‘2nd’ + ‘Y=’ (STAT PLOT) to set up various types of plots:
- Scatter Plot: Visualizes the relationship between two sets of data (e.g., L1 vs. L2).
- Line Plot: Connects data points with lines.
- Histogram: Displays the frequency distribution of a single data set.
- Box Plot: Shows the five-number summary (min, Q1, median, Q3, max) of a data set.
After setting up a plot, use ‘ZOOM’ -> ‘ZoomStat’ (or ZoomData) to automatically adjust the window to fit your data, providing an immediate visual representation of trends or distributions.
Beyond Basic Graphs: Parametric, Polar, and Sequences
Many advanced graphing calculators offer additional graphing modes accessible via the ‘MODE’ button:
- Parametric Mode: Instead of $y=f(x)$, functions are defined by $x=f(t)$ and $y=g(t)$, where ‘t’ is a parameter. This is crucial for plotting paths, trajectories, and complex curves that might not pass the vertical line test.
- Polar Mode: Functions are defined by $r=f(theta)$, using polar coordinates. Ideal for visualizing spirals, cardioids, and other shapes common in polar geometry.
- Sequence Mode: Allows you to plot sequences (e.g., arithmetic or geometric progressions) as discrete points over time or index.
Switching to these modes changes the variable key and the ‘Y=’ editor to reflect the new input requirements, opening up a wider range of mathematical exploration.
Advanced Techniques and Maximizing Your Calculator’s Potential
Pushing beyond the core functions, graphing calculators offer sophisticated tools that can tackle complex problems, automate repetitive tasks, and even connect to external devices. Mastering these advanced techniques elevates the calculator from a basic visualization tool to a comprehensive mathematical workbench.
Solving Equations Graphically
One of the most intuitive ways to solve equations using a graphing calculator is through graphical analysis.
- Finding Roots/Zeros: To solve an equation like $2x^3 – 5x + 1 = 0$, you can graph $y = 2x^3 – 5x + 1$ and use the ‘CALC’ -> ‘Zero’ function to find the x-intercepts. Each x-intercept is a solution to the equation.
- Solving by Intersection: To solve an equation like $e^x = sin(x) + 2$, you can rewrite it as two functions: $Y1 = e^x$ and $Y2 = sin(x) + 2$. Graph both functions and then use ‘CALC’ -> ‘Intersection’ to find the x-values where they cross. This method is incredibly versatile for equations that are difficult or impossible to solve algebraically. Remember to adjust your window to see all potential intersection points.
Numerical Derivatives and Integrals
Calculus students heavily rely on graphing calculators for numerical approximations of derivatives and integrals.
- Numerical Derivative (dy/dx): In the ‘CALC’ menu, ‘dy/dx’ (or
nDeriv(on the home screen) allows you to find the slope of the tangent line to a curve at a specific x-value. This provides the instantaneous rate of change of the function at that point. While it doesn’t give the symbolic derivative, it’s excellent for understanding the concept and checking analytical solutions. - Numerical Integral ($int f(x)dx$): The ‘CALC’ menu’s ‘$int f(x)dx$’ (or
fnInt(on the home screen) computes the definite integral of a function between two specified limits (lower and upper bounds). This approximates the area under the curve. BothnDerivandfnIntare powerful tools for understanding the geometric and physical interpretations of calculus concepts, particularly when exact analytical solutions are complex or not required.
Programming Your Calculator
Many graphing calculators, particularly those from Texas Instruments, support basic programming. This allows users to write short scripts to automate repetitive calculations, create custom tools, or develop simple games.
- Creating Programs: Access the ‘PRGM’ menu, then ‘NEW’ to create a new program. You can then input commands (found under ‘PRGM’ -> ‘I/O’ for input/output, ‘CTL’ for control structures like If/Then, For loops, etc.).
- Applications: Common uses include:
- Formulas: Writing programs to solve quadratic equations, perform unit conversions, or apply specific physics formulas.
- Simulations: Running basic probability simulations.
- Tutorials: Creating interactive lessons for specific math concepts.
While requiring some basic coding logic, programming your calculator can significantly boost efficiency for recurring tasks and offer a deeper understanding of computational processes.
Connecting to Computers and Data Transfer
Modern graphing calculators aren’t isolated devices. Many models offer connectivity options:
- USB Cables: Used to connect the calculator to a computer. This enables:
- Firmware Updates: Ensuring your calculator has the latest operating system, bug fixes, and features.
- Data Transfer: Moving programs, lists, matrices, and even screenshots between the calculator and a computer, or between two calculators.
- Software Integration: Using companion software (e.g., TI-Connect, Casio FA-124) to manage calculator files, create programs on a larger screen, and integrate with spreadsheets or other applications for more comprehensive analysis.
- Wireless Connectivity: Some advanced models (like TI-Nspire CX II-T) have Bluetooth for connecting to classroom networks, allowing teachers to monitor student work or send files. This connectivity transforms the calculator into a more integrated learning and analysis tool within a digital ecosystem.
Choosing the Right Graphing Calculator and Best Practices
The market offers a diverse range of graphing calculators, each with its unique strengths and weaknesses. Making an informed decision and adopting effective usage habits are crucial for maximizing your investment and optimizing your learning experience.
Key Factors to Consider
Selecting the ideal graphing calculator involves weighing several practical considerations:
- Exam Compatibility: This is paramount. Different standardized tests (SAT, ACT, AP Exams, IB Exams, college courses) have specific rules about which calculator models are permitted. Always check the official guidelines for your exams. For instance, calculators with a Computer Algebra System (CAS) are often restricted.
- Features Needed:
- Basic graphing: All models excel here.
- Calculus tools: Most handle numerical derivatives/integrals.
- Statistics: Standard deviation, regressions, hypothesis tests are common.
- CAS (Computer Algebra System): If you need symbolic manipulation (e.g.,
(x+y)^2expands tox^2 + 2xy + y^2), you’ll need a CAS model (like TI-Nspire CX II CAS). - Color display: Enhances readability and distinguishes multiple graphs.
- Rechargeable battery: Convenient, but ensures you charge it.
- Budget: Prices vary significantly, from around $90-100 for basic models to over $200 for advanced CAS color versions. Consider purchasing used or renting if budget is a concern.
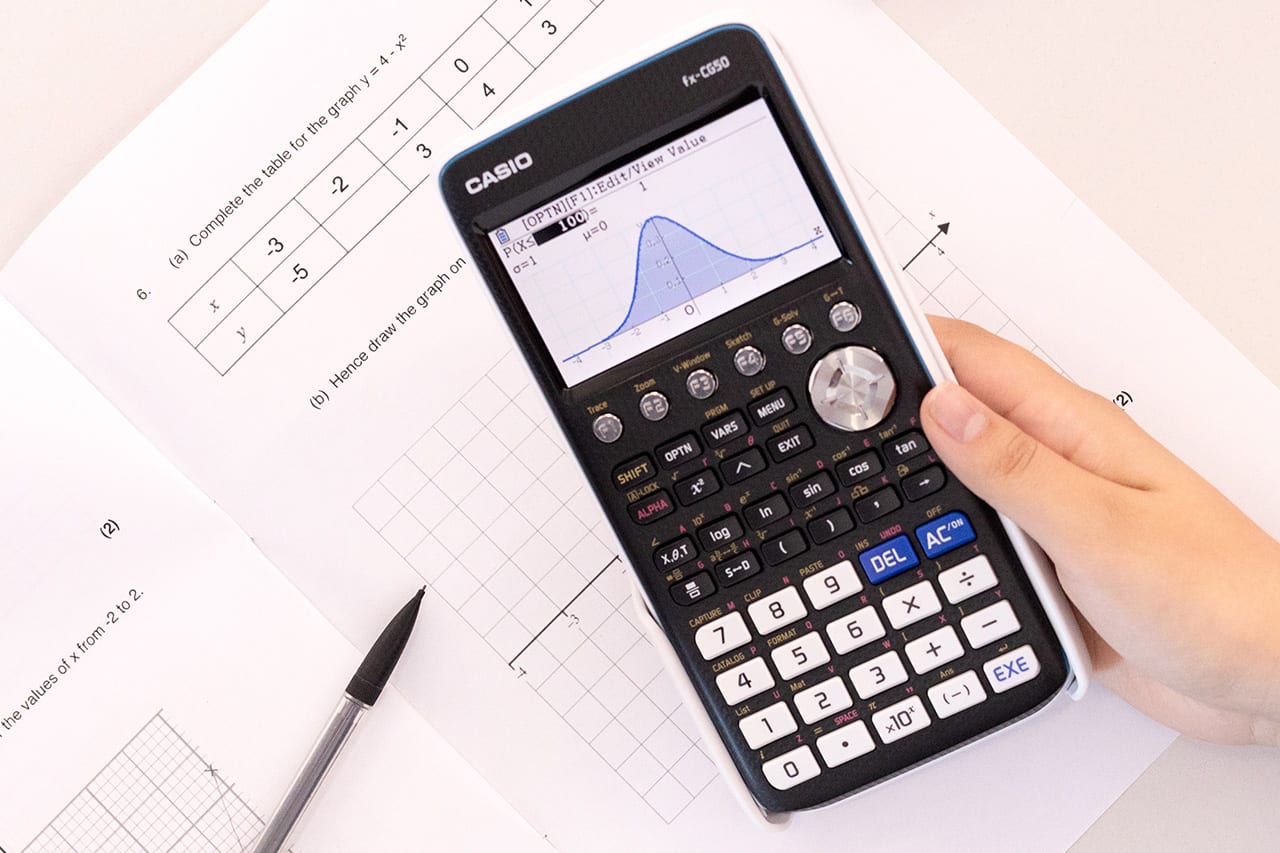
- Brand and Ecosystem: Texas Instruments (TI) dominates the educational market, meaning many teachers and peers will use TI-branded calculators (e.g., TI-84 Plus CE, TI-Nspire CX II). This can be beneficial for sharing programs, troubleshooting, and following classroom instructions. Casio offers excellent alternatives like the fx-CG50.
Popular Models and Their Strengths
- TI-84 Plus CE (Color Edition): The de facto standard for high school math and science. It’s user-friendly, has a vast online community, and is accepted on almost all standardized tests (non-CAS). Its color screen significantly improves visualization.
- TI-Nspire CX II / CX II CAS: A more advanced, computer-like interface with a document-based system. The non-CAS version is allowed on most tests, while the CAS version is more powerful for symbolic algebra but often restricted. It’s excellent for visual learners and offers dynamic geometry and spreadsheet applications.
- Casio fx-CG50 (Graphing Calculator with Color Display): Often praised for its natural input/output display, high-resolution color screen, and 3D graphing capabilities. It’s a strong competitor to the TI-84 Plus CE, offering comparable features and exam compatibility.
Tips for Effective Graphing Calculator Use
- Practice Regularly: Like any skill, proficiency with a graphing calculator comes from consistent practice. Work through examples, explore different functions, and experiment with settings.
- Understand the Math First: The calculator is a tool to aid understanding, not replace it. Always strive to grasp the underlying mathematical concepts before relying solely on the calculator for answers. It helps you recognize when a calculator output might be erroneous.
- Customize Your Settings: Configure your calculator’s mode settings (angle, display format, graph type) to match your current task. Save custom programs for frequently used formulas or routines.
- Backup Your Data: If your calculator allows, regularly back up your programs, lists, and settings to a computer. This protects your work and saves time if your calculator needs to be reset or replaced.
- Keep it Charged/Stocked: Ensure your calculator has fresh batteries or is fully charged before important classes or exams. Nothing is more frustrating than a dead calculator mid-test.
- Read the Manual (or Find Online Resources): The user manual, though dense, contains a wealth of information. Alternatively, countless tutorials and videos are available online for specific models and functions.
Mastering your graphing calculator is an investment in your mathematical journey. By understanding its capabilities, diligently practicing its functions, and choosing the right model for your needs, you transform what might initially seem like a complex device into a powerful ally, unlocking new depths of understanding and efficiency in the world of numbers and graphs.
aViewFromTheCave is a participant in the Amazon Services LLC Associates Program, an affiliate advertising program designed to provide a means for sites to earn advertising fees by advertising and linking to Amazon.com. Amazon, the Amazon logo, AmazonSupply, and the AmazonSupply logo are trademarks of Amazon.com, Inc. or its affiliates. As an Amazon Associate we earn affiliate commissions from qualifying purchases.